Original
article
Temporal
and
spatial
variation
in
transpiration
of
Norway
spruce
stands
within
a
forested
catchment
of
the
Fichtelgebirge,
Germany
Martina
Alsheimer
Barbara
Köstner,
Eva
Falge,
John
D.
Tenhunen
Department
of
Plant
Ecology
II,
Bayreuth
Institute
for
Terrestrial
Ecosystem
Research,
University
of
Bayreuth,
95440
Bayreuth,
Germany
(Received
15
January
1997;
accepted
27
June
1997)
Abstract - Tree
transpiration
was
observed
with
sapflow
methods
in
six
Norway
spruce
(Picea
abies)
stands
located
in
the
Lehstenbach
catchment,
Fichtelgebirge,
Germany,
differing
in
age
(40
years
up
to
140
years),
structure,
exposition
and
soil
characteristics.
The
seasonal
pattern
in
tree
canopy
transpiration,
with
the
highest
transpiration
rates
in
July,
was
very
similar
among
the
stands.
However,
young
dense
stands
had
higher
transpiration
compared
to
older
less
dense
stands.
Because
of forest
management
practices,
stand
density
decreases
with
increasing
stand
age
and
provides
the
best
predictor
of
canopy
water
use.
Measured
xylem
sapflux
density
did
not
dif-
fer
significantly
among
stands,
e.g.
vary
in
correlation
with
stand
density.
Thus,
differences
in
canopy
transpiration
were
related
to
differences
in
cumulative
sapwood
area,
which
decreases
with
age
and
at
lower
tree
density.
While
both
total
sapwood
area
and
individual
tree
sapwood
area
decrease
in
older
less
dense
stands,
leaf area
index
of the
stands
remains
high.
Thus,
transpiration
or
physiological
activity
of
the
average
individual
needle
must
decrease.
Simulations
with
a
three-dimensional
stand
model
suggest
that
stand
structural
changes
influence
light
climate
and
reduce
the
activity
of the
average
needle
in
the
stands.
Nevertheless,
age
and
nutrition
must
be
con-
sidered
with
respect
to
additional
direct
effects
on
canopy
transpiration.
(©
Inra/Elsevier,
Paris.)
transpiration
/
canopy
conductance
/ sapwood
area
/ stand
age
/ stand
density
/ Picea
abies
Résumé -
Variations
spatiotemporelles
de
la
transpiration
de
peuplements
d’épicéas
dans
un
bassin-versant
du
Fichtelgebirge
(Allemagne).
La
transpiration
des
arbres
a
été
évaluée
au
moyen
de
méthodes
de
mesure
du
flux
de
sève
dans
six
peuplements
d’épicéas
(Picea
abies),
situés
dans
le
bassin-versant
du
Lehstenbach,
Fichtelgebirge
(Allemagne),
qui
différaient
en
âge
(40
à
140
ans),
structure,
exposition,
et
en
caractéristiques
de
sol.
L’allure
des
variations
saisonnières
*
Correspondence
and
reprints
Tel:
(49)
921
55 56 20;
fax:
(49)
921
55 57 99;
e-mail:
john.tenhunen@bitoek.uni-bayreuth.de
de
la
transpiration
des
arbres,
avec
notamment
un
maximum
en
juillet,
était
très
similaire
entre
ces
peuplements.
Néanmoins,
les
jeunes
peuplements
denses
ont
montré
une
plus
forte
transpi-
ration
que
les
peuplements
âgés
et
moins
denses.
La
densité
du
peuplement
s’est
avérée
être
la
meilleure
variable
explicative
de
la
transpiration,
car
les
pratiques
sylvicoles
réduisent
la
densité
des
peuplements
en
fonction
de
l’âge.
La
densité
de
flux
de
sève
n’a
pas
montré
de
différences
significatives
entre
les
peuplements.
Ainsi,
les
différences
de
transpiration
étaient
seulement
dues
aux
différences
de
surface
de
bois
d’aubier,
qui
diminue
avec
l’âge
et
la
densité.
Alors
que
la
surface
de
bois
d’aubier
à
l’échelle
du
peuplement
comme
à
celle
de
l’arbre
diminuaient
dans
les
peuplements
âgés
et
peu
denses,
l’indice
foliaire
de
tous
les
peuplements
étudiés
restait
élevé.
Ainsi,
il
est
probable
que
la
transpiration
ou
l’activité
physiologique
des
aiguilles
diminuent
avec
l’âge
des
arbres.
Des
simulations
réalisées
au
moyen
d’un
modèle
de
couvert
3D
suggèrent
que
les
modifications
de
structure
des
peuplements
influencent
le
microclimat
lumineux
et
rédui-
sent
l’activité
foliaire.
Malgré
tout,
l’âge
et
la
nutrition
doivent
être
pris
en
compte
dans
leurs
effets
sur
la
transpiration
des
arbres.
(©
Inra/Elsevier,
Paris.)
transpiration,
conductance
du
couvert,
surface
de
bois
d’aubier,
âge,
densité,
Picea
abies
1.
INTRODUCTION
Norway
spruce
(Picea
abies
(L.)
Karst.),
because
of
its
importance
in
tim-
ber
production,
is
one
of
the
most
widely
studied
forest
trees
of
Europe.
The
empir-
ically
derived
yield
tables
for
Norway
spruce
demonstrate
that
substantial
dif-
ferences
in
stand
development
and
pro-
ductivity
occur
regionally
within
Germany
[3,
30,
54,
56,
73]
and
between
neighbor-
ing
countries
(Austria
in
Marschall
[44];
Slovakia
in
Halaj
[26];
Switzerland
in
Badoux
[5]).
Observations
and
recon-
structions
of
height
growth
and
wood
vol-
ume
increment
for
Norway
spruce
at
long-
term
sites
demonstrate
1)
a
rapid
increase
in
growth
and
production
followed
by
growth
decline
after
approximately
80-100
years
[12,
57],
2)
a
clear
differ-
entiation
in
development
due
to
climate
and
soils
[30,
54]
and
3)
a
recent
trend
for
growth
stimulation
even
in
older
stands
due,
among
other
factors,
to
high
nitro-
gen
deposition
[16,
17, 54].
An
evalua-
tion
of
the
relative
importance
of
long-
term
changes
in
site
climate
(temperature,
precipitation
and
atmospheric
CO
2
),
site
quality
(also
as
affected
by
atmospheric
nitrogen
deposition),
and
tree
physiology
on
forest
growth
requires
both
an
improved
analysis
of
heterogeneity
in
structure
and
function
of
spruce
stands
within
landscapes
and
along
chronose-
quences
and
new
analytic
capabilities
to
separate
the
complex
effects
of
multiple
factors
on
carbon
fluxes,
i.e.
potentials
for
comparison
of
sites
as
may
be
achieved
with
process-oriented
simulation
models.
Landscape
heterogeneity
in
transpira-
tion
occurs
as
a
result
of
the
presence
of
different
species,
variation
in
site
quality,
local
climate
gradients,
the
spatial
mosaic
in
stand
age
as
well
as
stand
density,
and
silvicultural
treatment.
Heterogeneity
in
transpiration
potential
is
accompanied
by
shifts
in
foliage
mass
to
sapwood
area
ratios
[43].
Espinosa-Bancalari
et
al.
[13]
found
that
variations
in
foliage
area
to
sap-
wood
area
ratios
are
strongly
correlated
with
mean
annual
ring
width
of
the
sap-
wood,
implying
that
growth
potential
is
an
important
component
in
the
dynamic
maintenance
of
xylem
water
supply
capac-
ity.
Sapwood
permeability
is
directly
pro-
portional
to tree
growth
rate
[74].
Greater
latent
heat
exchange
and
CO
2
fixation
in
young
as
compared
to
old
stands
of Pinus
banksiana
were
observed
in
northern
Canada
[63].
Decreases
in
canopy
transpiration
of
35
%
with
aging
of
Norway
spruce
were
reported
by
Schu-
bert
(in
[37])
in
a
comparison
of
40-
and
100-year-old
stands.
Yoder
et
al.
[75]
found
that
photosynthetic
rates
decreased
in
old
trees
of
Pinus
ponderosa,
suggest-
ing
that
canopy
gas
exchange
is
reduced
in
old
stands
as
growth
potential
decreases.
Falge
et
al.
[14]
reported
in
Picea
abies,
that
the
observed
data
were
compatible
with
an
unaltered
mesophyll
photosyn-
thetic
capacity
but
a
greater
stomatal lim-
itation
as
trees
aged.
In
the
present
study,
tree
canopy
tran-
spiration
was
simultaneously
examined
along
a
chronosequence
of
Picea
abies
stands
growing
in
relatively
close
prox-
imity
within
a
forested
catchment
of
the
Fichtelgebirge,
Germany.
Our
purpose
was
to
determine
whether
regulation
of
the
transpiration
flux
differed,
and
if
so,
potential
causes
of
this
variation,
i.e.
potential
differences
in
microclimate,
in
canopy
structure
and
light
interception,
in
site
quality
and
tree
nutrition,
or
in
water
supply
capacity
as
reflected
in
the
foliage
area
to
sapwood
area
ratio.
While
tree
canopy
transpiration
can
be
measured
or
estimated
via
micrometerological
meth-
ods,
homogeneous
areas
lend
themselves
best
to
interpretation
with
these
methods
and
large
fetch
distances
are
required.
Measurements
of
water
flux
at
the
leaf
or
shoot
level
are
limited
due
to
problems
encountered
in
a
direct
scaling-up
of
rates
to
the
stand
level
[39].
Thus,
xylem
sapflow
measurements
were
used
in
our
study
and
are
viewed
as
the
most
appro-
priate
method
for
obtaining
coupled
infor-
mation
about
the
physiology
of
individ-
ual
trees,
tree
structural
development,
and
site
factors
as
they
affect
water
relations.
2.
MATERIALS
AND
METHODS
The
experimental
sites
are
located
within
the
Lehstenbach
catchment,
Fichtelgebirge,
northeastern
Bavaria,
Germany
at
an
altitude
of
approximately
750-800
m.
More
than
90
%
of
the
catchment
is
covered
with
Norway
spruce
[Picea
abies
[L.]
Karst.].
The
exposed
sub-
strates
are
mainly
phyllite
and
gneiss
and
the
most
common
soils
are
brown
earths
and
pod-
sols.
Where
ground
water
is
near
the
surface,
local
boggy
organic
layers
form.
The
mean
annual
air
temperature
is
approximately
5.8
°C
(at
an
altitude
of
780
m)
and
mean
annual
pre-
cipitation
is
1
000-1
200
mm.
There
is
also
a
high
occurrence
of
fog
(100-200
d
per
year)
and
only
a
short
growing
season
(100-130
d
per
year).
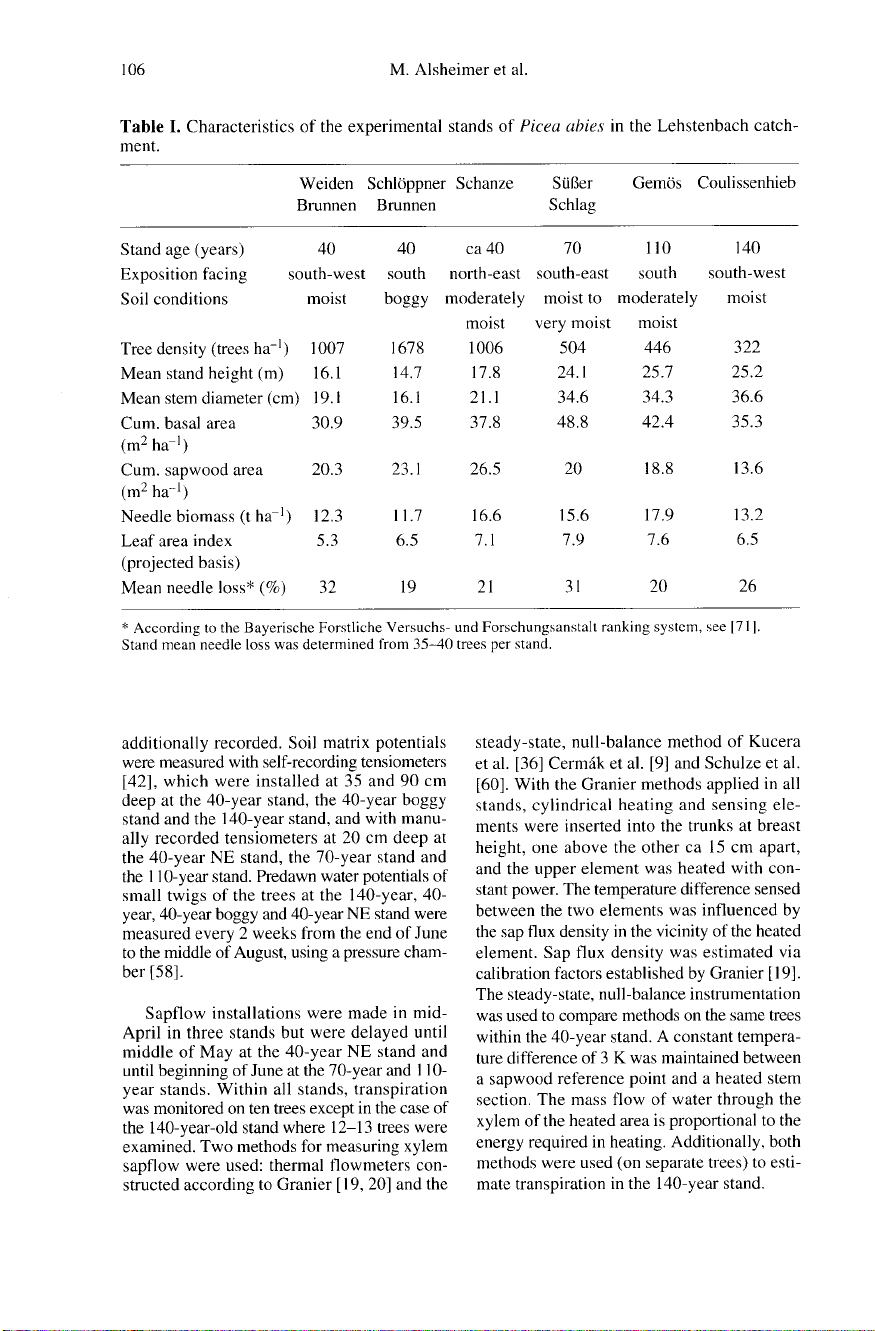
Six
spruce
stands
differing
either
in
age
and
structure,
in
exposition,
or
in
soil
characteris-
tics
were
chosen
for
study.
Three
of
the
stands
were
of
approximately
the
same
age
(40
years).
The
stand
Schlöppner
Brunnen
compared
to
the
other
stands
is
growing
on
very
wet
and
boggy
soil
(subsequently:
40-year
boggy
stand),
while
the
stands
Weiden
Brunnen
(sub-
sequently:
40-year
stand)
and
Schanze
are
located
on
moderately
moist
to
moist
soils.
The
stand
Schanze
has
a
north-east
exposition
(subsequently:
40-year
NE
stand)
while
all
other
stands
occur
on
south-facing
(south-east
to
south-west)
slopes.
In
addition
to
these
three
stands
of
the
same
age,
the
70-year
old
stand
Süßer
Schlag
(subsequently:
70-year
stand),
the
1
10-year
old stand
Gemös
(subsequently:
110-year-stand)
and
the
140-year-old
stand
Coulissenhieb
(subsequently:
140-year
stand)
located
on
drained
but
moist
soils
were
inves-
tigated.
Tree
density
of
the
stands
decreases
with
age
owing
to
thinning
and
removal
of
wood
in
forest
management.
Stand
character-
istics
are
summarized
in
table
I.
Investigations
were
carried
out
primarily
in
the
year
1995
from
the
middle
of
April
to
the
middle
of
November
(preliminary
experi-
ments
with
fewer
stands
were
conducted
dur-
ing
1994
as
described
below).
Air
tempera-
ture,
relative
humidity
and
net
radiation
or
global
radiation
were
recorded
automatically
at
meteorological
stations
above
the
canopy
at
the
40-year
boggy,
the
40-year
NE
and
the
140-year
stand
as
well
as
for
several
weeks
in
autumn
at
the
40-year
stand.
Vapor
pressure
deficit
(D)
was
calculated
from
temperature
and
relative
humidity
measurements
at
the
first
three
sites.
The
remaining
sites
were
consid-
ered
most
similar
to
the
140-year
stand
and
transpiration
at
these
sites
was
related
to
D
at
the
140-year
stand.
Precipitation
was
measured
in
an
open
field
near
the
140-year
stand.
At
the
140-year
stand,
rainfall,
throughfall
and
windspeed
as
well
as
soil
temperature
were
additionally
recorded.
Soil
matrix
potentials
were
measured
with
self-recording
tensiometers
[42],
which
were
installed
at
35
and
90
cm
deep
at
the
40-year
stand,
the
40-year
boggy
stand
and
the
140-year
stand,
and
with
manu-
ally
recorded
tensiometers
at
20
cm
deep
at
the
40-year
NE
stand,
the
70-year
stand
and
the
110-year
stand.
Predawn
water
potentials
of
small
twigs
of
the
trees
at
the
140-year,
40-
year,
40-year
boggy
and
40-year
NE
stand
were
measured
every
2
weeks
from
the
end
of
June
to
the
middle
of
August,
using
a
pressure
cham-
ber
[58].
Sapflow
installations
were
made
in
mid-
April
in
three
stands
but
were
delayed
until
middle
of
May
at
the
40-year
NE
stand
and
until
beginning
of
June
at
the
70-year
and
110-
year
stands.
Within
all
stands,
transpiration
was
monitored
on
ten
trees
except
in
the
case
of
the
140-year-old
stand
where
12-13
trees
were
examined.
Two
methods
for
measuring
xylem
sapflow
were
used:
thermal
flowmeters
con-
structed
according
to
Granier
[19,
20]
and
the
steady-state,
null-balance
method
of
Kucera
et
al.
[36]
Cermák
et
al.
[9]
and
Schulze
et
al.
[60].
With
the
Granier
methods
applied
in
all
stands,
cylindrical
heating
and
sensing
ele-
ments
were
inserted
into
the
trunks
at
breast
height,
one
above
the
other
ca
15
cm
apart,
and
the
upper
element
was
heated
with
con-
stant
power.
The
temperature
difference
sensed
between
the
two
elements
was
influenced
by
the
sap
flux
density
in
the
vicinity
of
the
heated
element.
Sap
flux
density
was
estimated
via
calibration
factors
established
by
Granier
[19].
The
steady-state,
null-balance
instrumentation
was
used
to
compare
methods
on
the
same
trees
within
the
40-year
stand.
A
constant
tempera-
ture
difference
of
3
K
was
maintained
between
a
sapwood
reference
point
and
a
heated
stem
section.
The
mass
flow
of
water
through
the
xylem
of the
heated
area
is
proportional
to
the
energy
required
in
heating.
Additionally,
both
methods
were
used
(on
separate
trees)
to
esti-
mate
transpiration
in
the
140-year
stand.
Total
sapflow
per
tree
was
obtained
by
mul-
tiplying
sap
flux
density
by
the cross-sectional
area
of
sapwood
at
the
level
of
observation.
Sapwood
area
of
sample
trees
was
estimated
from
regressions
relating
GBH
(girth
at
breast
height)
to
sapwood
area
determined
either
with
an
increment
borer,
by
computer
tomography
[25],
or
from
stem
disks
of
harvested
trees.
Since
no
correlation
was
found
between
tree
size
and
sap
flux
density
except
at
the
40-year
NE
stand,
stand
transpiration
(mm
d
-1
)
was
estimated
(except
at
the
40-year
NE
stand)
by
multiplying
mean
flux
density
of
all
sample
trees
by
total
cross-sectional
sapwood
area
of
the
stand
and
dividing
by
stand
ground
sur-
face.
At
the
40-year
NE
stand
where
flux
den-
sity
was
correlated
with
tree
size,
tree
transpi-
ration
was
extrapolated
to
stand
transpiration
according
to
the
frequency
of
occurrence
of
trees
in
different
size classes.
For
days
with
missing
data
owing
to
technical
failures
as
well
as
for
the
early
season
before
sensors
could
be
installed
in
some
stands,
canopy
daily
transpi-
ration
sums
were
estimated
from
correlations
established
between
the
measured
daily
tran-
spiration
and
daily
maximum
vapor
pressure
deficit
(D
max
,
cf. figure
4).
From
tree
canopy
hourly
transpiration
rates
and
hourly
average
D
measured
above
the
canopy,
values
of
total
canopy
conductance
(G
t)
were
derived.
The
time
courses
for
mea-
sured
sap
flow
were
shifted
by
0.5-1.5
h
until
compatability
between
morning
increases
in
photosynthetic
photon
flux
density
and
esti-
mated
tree
canopy
transpiration
were
achieved.
Thus,
our
analysis
assumes
that
a
linear
shift
compensates
for
the
capacitive
delay
in
flow
detection
at
breast
height
as
compared
to
crown
level
transpiration.
Further
details
regarding
the
estimate
of
Gt
as
dependent
on
shifted
tree
canopy
transpiration
and
on
D
are
given
by
Köstner
et
al.
[32, 34]
and
Granier
et
al.
[22].
Tree
canopy
conductance
was
calculated
according
to
the
following
formula:
where g
c
is
tree
canopy
conductance
(mm
s
-1),
Ec
is
tree
canopy
transpiration
(kg
H2O
m
-2
h
-1),
D
is
vapour
pressure
deficit
(hPa),
Gv
is
gas
constant
(0.462
m3
kPa
kg-1
K
-1),
Tk
is
air
temperature
(Kelvin).
Needle
nutrient
content
was
measured
for
twig
samples
collected
in
July
in
the
sun
crown
of five
harvested
trees
at
the
70-year
and
at
the
110-year
stands
and
at
the
end
of
October
1994
from
five
trees
of
the
40-year,
the
40-year
boggy
and
the
40-year
NE
stand.
Nutrient
con-
tent
of
the
needles
of
the
140-year
stand
was
determined
in
October
1992
and
in
October
1995.
Needle
biomass
of five
individual
trees
per
site,
selected
over
the
GBH
distribution
(girth
at
breast
height),
was
determined
by
applying
the
’main
axis
cutting
method’
of Chiba
[10].
Needle
area/needle
biomass
was
determined
for
sub-samples
taken
from
the
lower-,
mid-,
and
upper-third
of
the
canopy
with
a
Delta-T
image
analyzer
(DIAS).
Regression
equations
relating
total
needle
surface
area
for
trees
to
GBH
were
used
to
sum
leaf
area
for
trees
in
the
stand
and
to
estimate
LAI.
Harvest
results
indicated
that
trees
from
40-year
stands
were
of
similar
structure
and
these
data
were
pooled
for
needle
surface
area
regressions.
For
the
older
stands,
LAI
estimates
are
based
on
five
trees
per
stand.
Cross-sectional
sapwood
area
of
stands
was
estimated
from
regressions
relat-
ing
GBH
to
sapwood
area
determined
either
with
an
increment
borer,
by
computer
tomog-
raphy
[25],
or
from
stem
disks
of
harvested
trees
(cf. figure
9).
3. RESULTS
3.1.
Stand
climate
and
water
supply
During
the
intensive
measurement
phase,
which
was
carried
out
from
the
middle
of
April
to
the
beginning
of
November
1995,
a
pronounced
period
of
cloudy
and
rainy
weather
occurred
in
June,
with
sunny
warm
weather
in
early
and
mid
summer,
and
cool
clear
weather
in
fall.
Monthly
changes
in
climate
factors
are
given
in
table
II.
T
max
and,
thus,
D
max
were
consistently
lower
(ca
15
%)
at
the
40-
year
NE
stand
as
compared
to
the
40-year
and
140-year
stand
which
were
adjacent
on
the
northern
divide
of
the
watershed.
The
lowest
D
max
(20
%
less
than
40-year
stand
owing
to
evaporation
from
standing
water
and
mosses
in
the
understory)
was
found
in
the
40-year
boggy
stand.
In
mid-
July
and
in
August,
moderate
drying
of
the
surface
soil
layers
occurred.
However,


%20--%3e%3cdefs%3e%3cstyle%3e%20.st0%20{%20fill:%20%23fff;%20}%20.st1%20{%20fill:%20%237800fa;%20}%20%3c/style%3e%3c/defs%3e%3cpath%20class='st1'%20d='M117.78,12.18H43.11c2.9,3.47,4.65,7.94,4.65,12.82,0,5.6-2.3,10.66-6.01,14.29h76.02l7.22-13.56-7.22-13.56Z'/%3e%3cg%3e%3cpath%20class='st0'%20d='M53.58,26.17h-.59v-1.46h.59v-4.96h2.83c1.78,0,2.67.94,2.67,2.82v5.76c0,1.87-.89,2.81-2.67,2.81h-2.83v-4.96ZM55.36,21.37v3.34h1.1v1.46h-1.1v3.34h1.01c.61,0,.91-.37.91-1.1v-5.93c0-.74-.3-1.1-.91-1.1h-1.01Z'/%3e%3cpath%20class='st0'%20d='M65.99,31.14h-1.8l-.31-2.07h-2.19l-.31,2.07h-1.64l1.82-11.39h2.62l1.82,11.39ZM65.28,18.04c-.25.46-.51.77-.75.94-.21.15-.47.22-.79.22-.26,0-.57-.07-.92-.22l-.38-.15c-.14-.05-.26-.07-.37-.07-.3,0-.53.18-.71.54l-.91-.68c.25-.46.51-.77.75-.94.21-.14.48-.21.79-.21.26,0,.57.07.92.21l.38.15c.14.05.26.07.37.07.3,0,.53-.18.71-.54l.91.68ZM61.91,27.52h1.73l-.87-5.76-.87,5.76Z'/%3e%3cpath%20class='st0'%20d='M74.53,26.89v1.52c0,1.91-.89,2.86-2.67,2.86s-2.67-.95-2.67-2.86v-5.93c0-1.91.89-2.86,2.67-2.86s2.67.95,2.67,2.86v1.11h-1.69v-1.22c0-.75-.31-1.12-.93-1.12s-.93.37-.93,1.12v6.15c0,.74.31,1.11.93,1.11s.93-.37.93-1.11v-1.63h1.69Z'/%3e%3cpath%20class='st0'%20d='M81.4,31.14h-1.8l-.31-2.07h-2.19l-.31,2.07h-1.64l1.82-11.39h2.62l1.82,11.39ZM75.9,19.2l1.52-1.91h1.71l1.51,1.91h-1.61l-.76-.95-.75.95h-1.61ZM77.32,27.52h1.73l-.87-5.76-.87,5.76ZM83.1,15.99l-1.76,1.91h-1.26l1.17-1.91h1.86Z'/%3e%3cpath%20class='st0'%20d='M84.86,19.75c1.78,0,2.67.94,2.67,2.82v1.48c0,1.87-.89,2.81-2.67,2.81h-.85v4.28h-1.79v-11.39h2.64ZM84.01,21.37v3.86h.85c.58,0,.87-.36.87-1.08v-1.71c0-.71-.29-1.07-.87-1.07h-.85Z'/%3e%3cpath%20class='st0'%20d='M93.51,19.75c1.78,0,2.67.94,2.67,2.82v1.48c0,1.87-.89,2.81-2.67,2.81h-.85v4.28h-1.79v-11.39h2.64ZM92.66,21.37v3.86h.85c.58,0,.87-.36.87-1.08v-1.71c0-.71-.29-1.07-.87-1.07h-.85Z'/%3e%3cpath%20class='st0'%20d='M98.8,31.14h-1.79v-11.39h1.79v4.88h2.03v-4.88h1.83v11.39h-1.83v-4.88h-2.03v4.88Z'/%3e%3cpath%20class='st0'%20d='M105.36,24.55h2.46v1.62h-2.46v3.34h3.09v1.63h-4.88v-11.39h4.88v1.63h-3.09v3.18ZM108.17,17.29l-1.76,1.91h-1.26l1.17-1.91h1.86Z'/%3e%3cpath%20class='st0'%20d='M112.2,19.75c1.78,0,2.67.94,2.67,2.82v1.48c0,1.87-.89,2.81-2.67,2.81h-.85v4.28h-1.79v-11.39h2.64ZM111.35,21.37v3.86h.85c.58,0,.87-.36.87-1.08v-1.71c0-.71-.29-1.07-.87-1.07h-.85Z'/%3e%3c/g%3e%3ccircle%20class='st1'%20cx='25'%20cy='25'%20r='20'/%3e%3cpath%20class='st0'%20d='M32.78,19.27c2.92,0,4.43,2.55,5.28,5.33l.71,2.17c.14.38-.33.75-.71.75h-5.61c.19-.33.24-.71.09-1.08l-.75-2.45c-.43-1.32-.99-2.64-1.79-3.77.75-.57,1.65-.94,2.78-.94h0ZM25,18.38c3.25,0,4.9,2.78,5.89,5.89l.76,2.45c.14.42-.33.8-.8.8h-11.69c-.42,0-.94-.38-.8-.8l.75-2.45c.99-3.11,2.64-5.89,5.89-5.89h0ZM25,11.35c1.74,0,3.11,1.37,3.11,3.11s-1.37,3.11-3.11,3.11-3.11-1.41-3.11-3.11,1.41-3.11,3.11-3.11h0ZM17.27,19.27c1.08,0,1.98.38,2.73.94-.8,1.13-1.37,2.45-1.74,3.77l-.8,2.45c-.14.38-.05.75.09,1.08h-5.56c-.42,0-.9-.38-.75-.75l.71-2.17c.9-2.78,2.41-5.33,5.33-5.33h0ZM17.27,12.91c1.51,0,2.78,1.27,2.78,2.83s-1.27,2.83-2.78,2.83-2.83-1.27-2.83-2.83,1.27-2.83,2.83-2.83h0ZM32.78,12.91c1.56,0,2.78,1.27,2.78,2.83s-1.23,2.83-2.78,2.83-2.83-1.27-2.83-2.83,1.27-2.83,2.83-2.83h0ZM27.07,28.56v.09c0,.57-.24,1.08-.61,1.46h0v.05c-.38.33-.9.57-1.46.57s-1.08-.24-1.46-.61h0c-.38-.38-.61-.9-.61-1.46v-.09h1.41v.09c0,.19.05.38.19.47v.05c.09.09.28.19.47.19s.38-.09.47-.19v-.05c.14-.09.24-.28.24-.47t-.05-.09h1.41ZM30.99,28.56v.09c0,1.65-.66,3.16-1.74,4.24-1.08,1.08-2.59,1.79-4.24,1.79s-3.16-.71-4.24-1.79l-.05-.05c-1.04-1.08-1.7-2.55-1.7-4.2v-.09h1.41v.09c0,1.27.47,2.4,1.27,3.25h.05c.85.85,1.98,1.37,3.25,1.37s2.4-.52,3.25-1.37c.85-.8,1.37-1.98,1.37-3.25v-.09h1.37ZM34.99,28.56v.09c0,2.78-1.13,5.28-2.92,7.07-1.79,1.79-4.29,2.92-7.07,2.92s-5.23-1.13-7.07-2.92c-1.79-1.79-2.92-4.29-2.92-7.07v-.09h1.41v.09c0,2.4.94,4.53,2.5,6.08,1.56,1.56,3.72,2.5,6.08,2.5s4.52-.94,6.08-2.5c1.56-1.56,2.5-3.68,2.5-6.08v-.09h1.41Z'/%3e%3c/svg%3e)