
J. FOR. SCI., 54, 2008 (3): 109–120 109
JOURNAL OF FOREST SCIENCE, 54, 2008 (3): 109–120
Tree biomass equations are tools to express
biomass components in terms of dry mass on the
basis of easily measurable variables. These are gen-
erally tree diameter at breast height (D) and tree
height (H). Other variables such as crown length,
crown width or tree age are sometimes estimated
in ecosystem studies and specific inventories of
forest ecosystem and may additionally improve the
tree biomass assessment. The information on tree
biomass is required to assess the amount of carbon
held in trees, which in turn represents the basis
of the assessment of carbon stock held in forests.
This leads to the estimation of forest carbon stock
changes, which belongs to reporting requirements
of the parties to the United Nations Framework
Convention on Climate Change and its Kyoto Pro-
tocol. As these policies require transparent and ver-
ifiable reporting of emissions by sources and sinks
related to carbon stock changes in forests, countries
develop suitable methodological approaches to do
so. The fundamental methodological advice on the
carbon reporting from the sector Land Use, Land
Use Change and Forestry (LULUCF) is given in the
Good Practice Guidance (GPG) for the LULUCF
sector (IPCC 2003). GPG encourages using and/or
developing suitable region- and species-specific
tree biomass functions. Tree biomass equations
may be used directly at tree level or as a compo-
nent of biomass expansion factors, which may be
also designed to be applicable to aggregated stand
level data (e.g. L et al. 2004; S et
al. 2007).
Supported by the Ministry of Environment of the Czech Republic, Project CzechCARBO – VaV/640/18/03.
Biomass functions applicable to oak trees grown
in Central-European forestry
E. Cienciala, J. Apltauer, Z. Exnerová, F. Tatarinov
Institute of Forest Ecosystem Research (IFER), Jílové u Prahy, Czech Republic
ABSTRACT: This study describes the parameterization of biomass functions applicable to oak (Quercus robur, Quer-
cus petraea) trees grown in the conditions of Central-European forestry. It is based on destructive measurements of
51 grown trees sampled from 6 sites in different regions of the Czech Republic important for oak forest management.
The samples covered trees of breast height diameter (D) ranging from 6 to 59 cm, tree height (H) from 6 to 32 m and
age between 12 and 152 years. The parameterization was performed for total aboveground biomass and its individual
components. The two basic levels of biomass functions utilized D either as a single independent variable or in combina-
tion with H. The functions of the third level represented the best function for each biomass component with the optimal
combination of available independent variables, which included D, H, crown length (CL), crown width (CW), crown ratio
(CR = CL/H), tree age and site altitude. D was found to be a particularly strong predictor for total tree aboveground
biomass. H was found to always improve the fit, particularly for the individual components of aboveground biomass.
The contribution of CW was minor, but significant for all biomass components, whereas CL and CR were found useful
for the components of stem and living branches, respectively. Finally, the remaining variables tree age and altitude were
each justified only for one component function, namely living branch biomass and stem bark, respectively. The study
also compares the fitted functions with other available references applicable to oak trees.
Keywords: Quercus robur; Quercus petraea; biomass components; carbon; forest; temperate region
110 J. FOR. SCI., 54, 2008 (3): 109–120
The most important tree species in the Czech Re-
public are European beech, English and sessile oak,
Scots pine and Norway spruce. Recently, several
studies on allometry of these species of temperate
Europe were conducted, including beech (J
et al. 2004; C et al. 2005), pine (C
et al. 2006) and spruce (W et al. 2004). The spe-
cies that has not been in the focus is oak and suit-
able allometric equations applicable to oak are still
missing. The reported studies on oak species include
H (2002), who provided equations for
bulk aboveground biomass applicable to oak, but this
study did not include individual components. Very
recently, Austrian scientists reported branch biomass
equations for oak grown in admixtures together with
other species (G, S 2006;
L, N 2006). Outside Europe, a
pooled function for aboveground biomass of broad-
leaves including oak species is available (S
et al. 1997). A rigorous quantification of total tree
biomass for a certain region requires locally pa-
rameterized allometric equations, optimally based
on representative and large sampling. In practice,
however, sampling is limited since biomass studies
are generally very laborious and costly.
Here, we parameterize allometric equations based
on destructively measured components of 51 grown
oak trees from 6 selected regions. The aim of this
paper was to determine and parameterize allom-
etric equations for oak trees (Quercus robur L. and
Quercus petraea (Matt.) Liebl.) grown in classically
managed oak-dominated stands in the conditions
of Central-European temperate forestry. These
functions could be used for the quantification of
total aboveground biomass and individual tree
components, i.e. stem (over and under bark), living
branches, dead branches and stem bark.
MATERIAL AND METHODS
Generally, the study is based on tree sampling that
was aimed at covering the most important regions
for oak forest management in the Czech Republic.
At each site, 8–9 trees were measured in standing
position and thereafter measured again after felling
and destructively sampled to estimate biomass and
wood density. The site description and sampling are
given below.
Site description and tree sampling
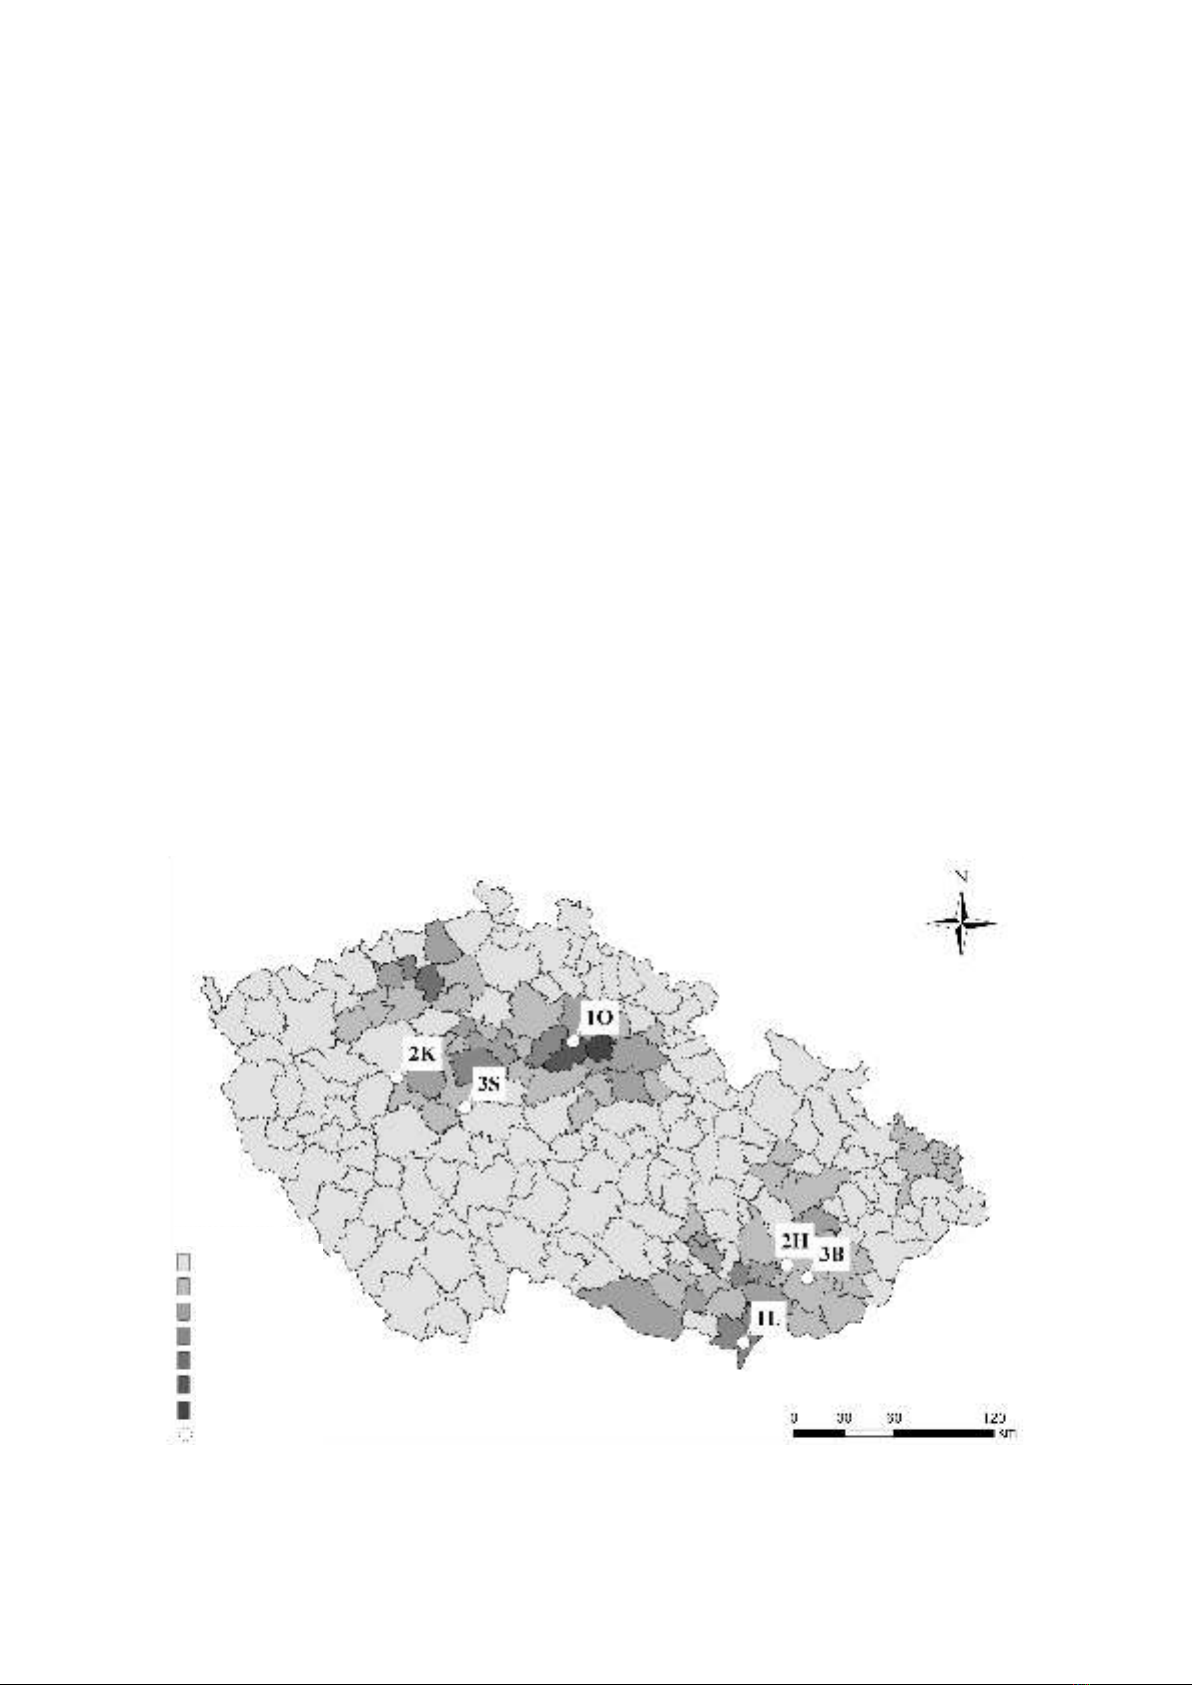
Altogether six locations (Nymburk, Křivoklát,
Lanžhot, Bučovice, Buchlovice and Slapy) were iden-
tified for destructive biomass sampling including
Oak proportion (%)
0.0–10.0
10.1–20.0
20.1–30.0
30.1–39.0
39.1–50.0
50.1–60.0
60.1–66.3
Locality and FST
Fig. 1. The map of six locations selected for destructive sampling and measurement of oak trees. The labels indicate the forest
site type (FST) according to the local typological classification (see Material and Methods)
J. FOR. SCI., 54, 2008 (3): 109–120 111
51 trees. The sites represented the most important
regions for the growing of oak in this country (Fig. 1).
The sites represented typical growth conditions with
site index 1 to 5 (Table 1) of the possible range (1 to
9). The forest site types according to the local forest
typological system represented a range of condi-
tions from fertile (1L, 2H, 3B), medium fertile (1O,
3S) to a poorer site class (2K). The typical altitude
for oak management in this country includes mostly
lowlands, which is reflected in the range of sample
site altitudes between 150 and 430 m a.s.l. At each
site, oak was a dominant species with a proportion
between 40 and 100%. Altogether 8 to 9 trees per
site were selected for destructive sampling so as to
cover the full range of dimensions. The trees were
selected subjectively to represent typical trees of
the main canopy layer for selected sites, site class
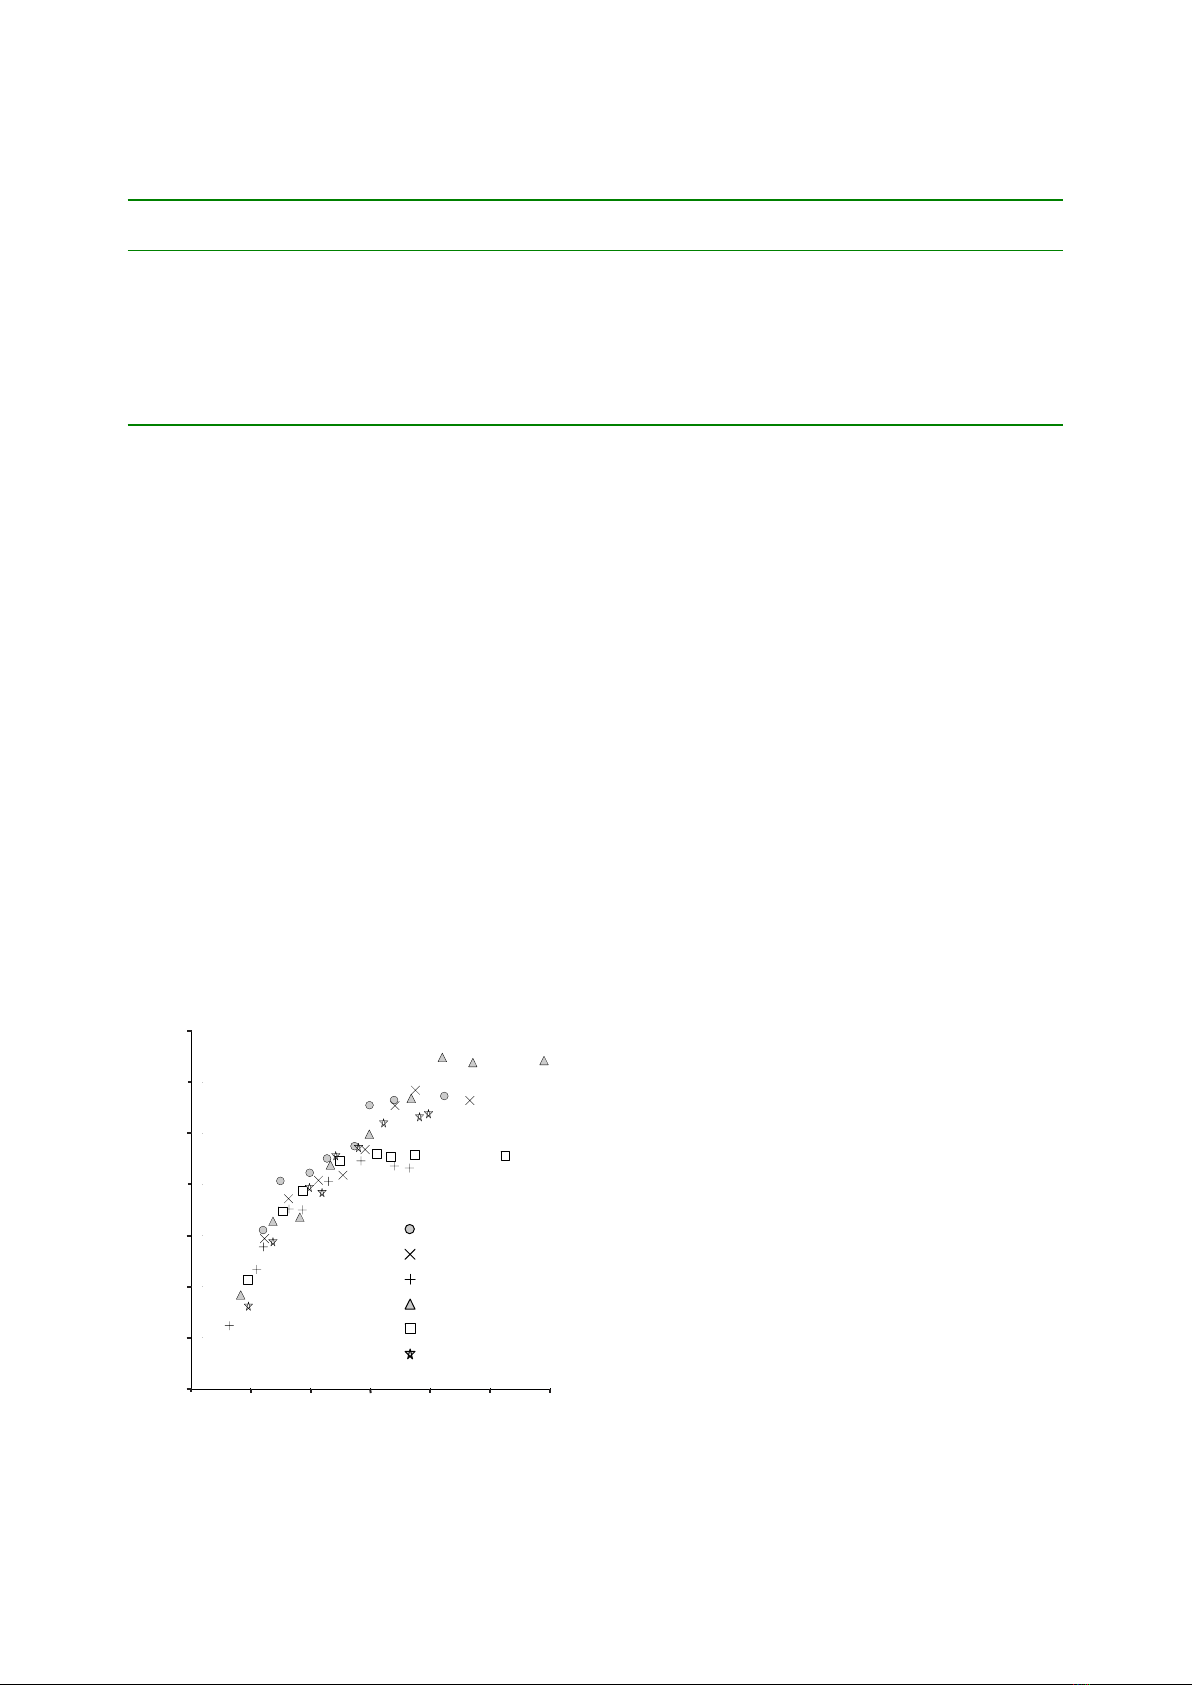
and stands. The diameter height relationship for all
sample trees (n = 51) classified by site locations is
shown in Fig. 2.
Sampling of trees at all sites was conducted in
early spring before bud break. All selected trees were
measured both standing and lying on the ground
after felling. All basic measurable information was
recorded, including tree diameter along the stem axis
in 1-m intervals, tree height, crown base and stem
diameter at the point of the crown base, height of the
green crown and bark thickness.
The biomass components were assessed either
from direct measurements or from in situ weighing
and later oven-drying of biomass samples. Stem and
stem bark volume was assessed using diameter and
bark thickness measurements in 1-m intervals. These
components in volume units were converted to bio-
mass using the conventional density of 580 kg/m3
for stem wood and 300 kg/m3 for bark, respectively
(IPCC 2003). Living branch biomass was assessed
on the basis of fresh to oven-dry weight ratio, which
was estimated from selected branches from three
segments of the tree crown of each sample tree.
Oven-drying of segments was performed at a tem-
perature of 90°C for a period of about 8 days. The
total aboveground biomass was represented by the
sum of stem-wood over bark and living branches.
The component of dead branches was treated sepa-
rately (and biomass equations estimated specifically,
see below) due to the mostly insignificant quantity
(see Results) and it was not included in the above-
ground biomass. As the sampling was conducted in
a leafless stage prior to bud break, no leaf biomass
was considered in this study.
Biomass functions
The pooled dataset of all trees and their compo-
nents was used for the parameterization of biomass
equations. The analyzed biomass components in-
cluded total aboveground biomass, stem over bark,
Table 1. Site description including the Natural Forest Region (NFR), forest site type (FST), site index in relative and
absolute units, oak proportion in sampled stands, site altitude, number of sampled trees and their stem diameter and
height range
NFR Forest
Enterprise FST Altitude
(m)
Site class
(–, m)
Oak
proportion (%)
Tree No.
(n) Diameter (cm) Height
(m)
17 Nymburk 1O 210 3–5 (24–22) 80–100 8 9.5–52.5 10.7–23.0
35 Lanžhot 1L 150 1–2 (32–28) 80–100 9 8.3–59.0 6.2–22.3
36 Bučovice 2H 300 3–5 (24–22) 50–80 8 12.3–46.6 14.7–29.2
9 Křivoklát 2K 300 4–5 (24–22) 80–100 9 6.4–36.5 6.2–22.3
36 Buchlovice 3B 430 2–3 (28–26) 50–90 8 12.1–42.4 15.5–28.6
10 Slapy 3S 360 4–5 (26–24) 40–70 9 9.6–39.7 8.1–26.9
0 10 20 30 40 50 60
D (cm)
0
5
10
15
20
25
30
35
T
r
e
e
h
e
i
g
h
t
(
m
)
Slapy
Nymburk
Lanzhot
Krivoklat
Bucovice
Buchlovice
35
30
25
20
15
10
5
0
Tree height (m)
0 10 20 30 40 50 60
D (cm)
Buchlovice
Bučovice
Křivoklát
Lanžhot
Nymburk
Slapy
Fig. 2. Tree diameter at breast height (D) and tree height for
all sample trees (n = 51) classified by site locations

112 J. FOR. SCI., 54, 2008 (3): 109–120
stem under bark, living and dead branches and stem
bark.
The most common form of biomass functions (e.g.
Z, M 2004) used to estimate tree
aboveground tree biomass (Y) and its components
is the power form
Y = p0 × Dp1 (1)
where: D – diameter at breast height, representing the
independent variable,
p0, p1 – parameters to be fitted.
Other fundamental information on trees is tree
height (H), which is often used to differentiate
growth conditions at different sites and commonly
serves as a basis for expressing the site index for the
purpose of forest management planning. Hence, the
inclusion of tree height is crucial for merging data
sets from different sites. The most commonly used
functional dependence of the biomass components
on the two basic measurable independent variables,
i.e. D and H, has the form as follows:
Y = p0 × Dp1 × Hp2 (2)
where: p0, p1, p2 – three parameters of the equation.
However, it is to note that in allometric studies the
nonlinear regression analysis is often avoided using
the logarithmic linearization of the power functions,
which can be exemplified as below:
lnY = p0 + p1 × lnX1 + p2 × lnX2 + p3 × lnX3 ...
... + pn × lnXn + ε (3)
Eq. (3) contains the independent variables X1 to Xn
and a corresponding set of parameters p0 to pn , while
ε represents an additive error term. While the lin-
earization permits a common linear regression pro-
cedure to be applied and stabilizes variance across
the observed tree dimensions, this transformation
produces a bias and must be statistically treated (e.g.
S 1983; Z 1996). This is commonly done by
setting a correction component estimated as a half
of the standard error of the estimate of parameter-
ized Eq. (3) (e.g. Z et al. 2005), which is added
to the linearized equation for the exponential back-
transformation, although no standard correction
has been proposed yet. Instead, M (1987)
calculated a model specific correction factor λ from
the data as
n
Σ
Yi
λ = i=1 (4)
n
Σ
elnŶi
i=1
where: n – number of sample trees,
Yi, Ŷi – represent the observed and fitted values.
This method ensures that the mean predicted value
is equal to the mean observed value. Hence, an un-
biased estimate of Y is given as
Ŷ = λ × exp( p0 + p1 × lnX1 + p2 × lnX2 + p3 × lnX3 ...
... + pn × lnXn ) (5)
The approach of linearization and general linear
model were used for the parameterization of biomass
functions for aboveground biomass and all other
components besides dead branches. For each of
these components three functions were determined
using the linearized model (Eq. 3), namely (i) that
utilizing solely D, (ii) that combining D and H, and
(iii) the best function detected by a step-wise re-
gression procedure that tested the combination of
the available independent predictors, namely D, H,
altitude (Z), tree age (A), crown length (CL), crown
width (CW) and crown ratio (CR) defined as CL/H.
As for the component of dead branches with
several zero values involved, the non-linear regres-
sion procedure with Eqs. (1) and (2) was applied
to determine a suitable biomass function and its
parameters.
The mean relative prediction error (MPE; %) was
calculated as follows (see e.g. N et al. 1999):
100
n
MPE = –––
Σ |
Yi – Ŷi
|/
Yi (6)
n i=1
When calculating MPE for dead branches, only
the trees with non-zero observed values were taken
into account.
The test of equality of regression equations ob-
tained from different sample sites was performed for
the optimal equations for aboveground biomass and
living branch biomass using the Chow criterion as it
was described in our earlier study (C et al.
2006). The criterion calculated for each pair of sites is
compared with table values of F-distribution taking
into account the amount of parameters and standard
deviations of residuals of the tested sites.
Reference stand
For a quantitative analysis of the parameterized
allometric equations of this study and available
equations published elsewhere, a fictitious oak stand
of young (25 years), medium (50 years) and old
(100 years) age was generated. This was done on the
basis of Czech growth and yield tables (Č et al.
1996) and its software derivative, growth and yield
J. FOR. SCI., 54, 2008 (3): 109–120 113
model SILVISIM (e.g. Č 2005). The prescribed
stand characteristics corresponded to a typically
managed oak stand of site index 3 (slightly above-
average conditions) with a management regime set
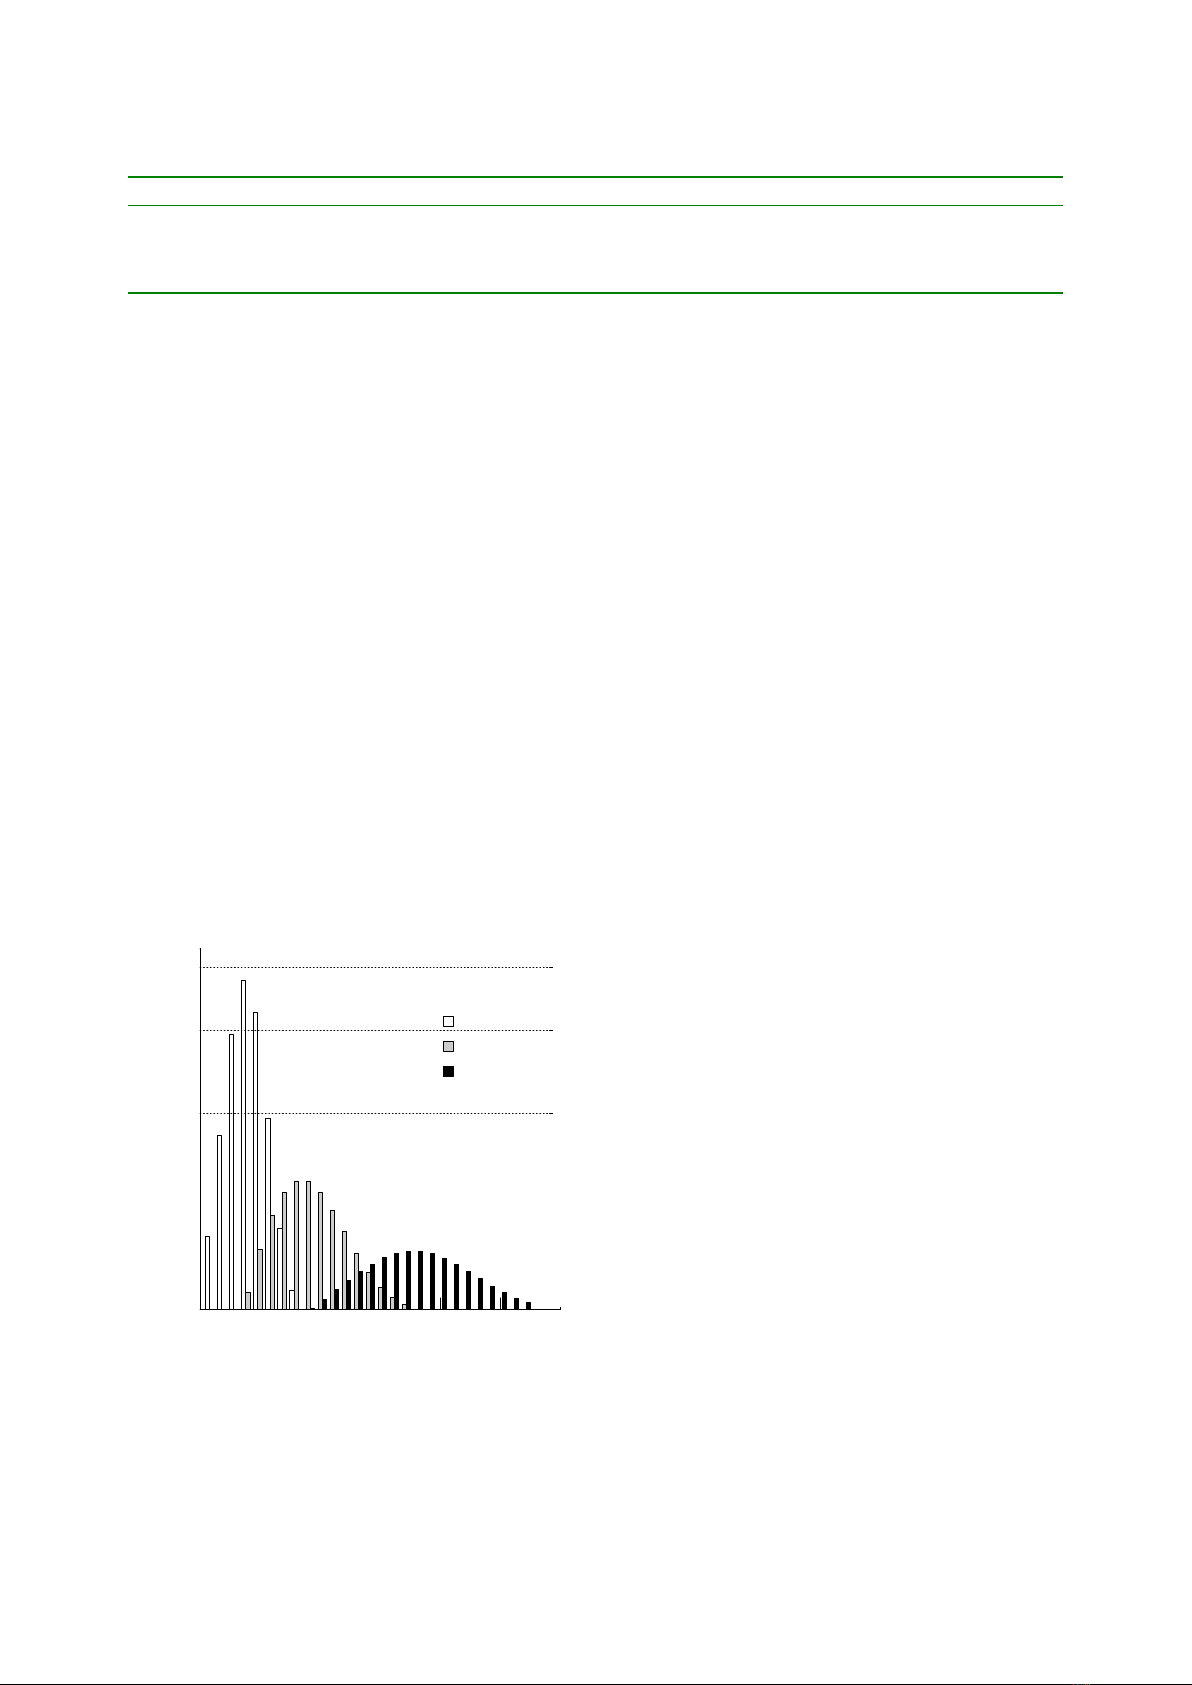
to full stocking. Stand characteristics for the exem-
plified stand age phases (young, medium and old)
are given in Table 2 and the frequency distribution
of trees in this example stand at 25, 50 and 100 years
of age is shown in Fig. 3.
RESULTS
Biomass equations and contribution
of independent variables
The dependence of the observed values of above-
ground biomass (AB) on the independent variables
breast height diameter (D), tree height (H), crown
length (CL), crown width (CW) and age is shown in
Fig. 4. This relation was typically exponential for all
independent variables. As expected, D produces the
clearly strongest relationship, while the dependence
of AB on other variables produces larger scatter.
The regression analysis performed for all biomass
components reflected the above observations. The
estimated biomass equations for all biomass com-
ponents except dead branches are listed in Table 3,
while Table 4 shows the results for the component
of dead branches. It can be observed that the gen-
erally best fit was obtained for the component of
aboveground biomass and stem biomass over and
under bark, explaining most of the total variation in
the observed data on a logarithmic scale (Table 3).
Only the slightly weaker match was found for the
component of bark (about 97%). Somewhat weaker
was the fit for the component of living branches,
which ranged between 90 and 93% for the set of ap-
plied equations. These observations for logarithmi-
cally transformed variables were magnified in terms
of the mean prediction error (MPE) using the real
values. For the optimal models, MPE reached about
5–6% for the components of aboveground biomass
and stem, while it increased to 15.5 and 29% for bark
biomass and living branches, respectively (Table 3).
Generally, the inclusion of tree height (H) and
other independent variables in equations always
improved the fit for biomass components relative
to the equation including only a single independent
variable D. H usually helped to explain the variation
of logarithmically transformed variable by additional
0.5 to 1% (Table 3). In terms of the mean prediction
error (MPE), however, the inclusion of tree height
always meant a notable MPE reduction (Table 3).
As for information on the tree crown, it helped
to improve the regression estimates for all tested
biomass components. The optimal combination of
independent variables for each component always
included crown width (CW), whereas other variables
worked differently for individual biomass compo-
nents. The optimal equation for stem biomass (under
or over bark) included, besides D and H, both CW
and crown length (CL). However, the effect of these
additional variables was rather small relative to the
function combining just D and H: the improvement
in the explained variability on a logarithmic scale
was barely significant, although MPE was further
Table 2. Stand characteristics of a generated test stand exemplifying the typical management of oak; mean stand height,
basal area and stocking density (N) are shown for each stand age
Stand Age (years) Mean stand height (m) Basal area (m2/ha) N (trees/ha)
Young 25 11.1 20.7 3,626
Medium 50 19.3 26.5 1,004
Old 100 26.0 32.9 323
0 10 20 30 40 50 60
D
400
800
1200
N
100
50
25
Age (years)
1,200
800
400
N (trees/ha)
0 10 20 30 40 50 60
D (cm)
50
100
Age (years)
Fig. 3. Frequency histogram of tree diameters (D) for a ficti-
tious managed stand of oak at 25, 50 and 100 years of age, site
class 3. The corresponding stand characteristics are shown in
Table 1. Note that for clarity the y-axis is shown on a power-
transformed (0.5) scale
25


%20--%3e%3cdefs%3e%3cstyle%3e%20.st0%20{%20fill:%20%23fff;%20}%20.st1%20{%20fill:%20%237800fa;%20}%20%3c/style%3e%3c/defs%3e%3cpath%20class='st1'%20d='M117.78,12.18H43.11c2.9,3.47,4.65,7.94,4.65,12.82,0,5.6-2.3,10.66-6.01,14.29h76.02l7.22-13.56-7.22-13.56Z'/%3e%3cg%3e%3cpath%20class='st0'%20d='M53.58,26.17h-.59v-1.46h.59v-4.96h2.83c1.78,0,2.67.94,2.67,2.82v5.76c0,1.87-.89,2.81-2.67,2.81h-2.83v-4.96ZM55.36,21.37v3.34h1.1v1.46h-1.1v3.34h1.01c.61,0,.91-.37.91-1.1v-5.93c0-.74-.3-1.1-.91-1.1h-1.01Z'/%3e%3cpath%20class='st0'%20d='M65.99,31.14h-1.8l-.31-2.07h-2.19l-.31,2.07h-1.64l1.82-11.39h2.62l1.82,11.39ZM65.28,18.04c-.25.46-.51.77-.75.94-.21.15-.47.22-.79.22-.26,0-.57-.07-.92-.22l-.38-.15c-.14-.05-.26-.07-.37-.07-.3,0-.53.18-.71.54l-.91-.68c.25-.46.51-.77.75-.94.21-.14.48-.21.79-.21.26,0,.57.07.92.21l.38.15c.14.05.26.07.37.07.3,0,.53-.18.71-.54l.91.68ZM61.91,27.52h1.73l-.87-5.76-.87,5.76Z'/%3e%3cpath%20class='st0'%20d='M74.53,26.89v1.52c0,1.91-.89,2.86-2.67,2.86s-2.67-.95-2.67-2.86v-5.93c0-1.91.89-2.86,2.67-2.86s2.67.95,2.67,2.86v1.11h-1.69v-1.22c0-.75-.31-1.12-.93-1.12s-.93.37-.93,1.12v6.15c0,.74.31,1.11.93,1.11s.93-.37.93-1.11v-1.63h1.69Z'/%3e%3cpath%20class='st0'%20d='M81.4,31.14h-1.8l-.31-2.07h-2.19l-.31,2.07h-1.64l1.82-11.39h2.62l1.82,11.39ZM75.9,19.2l1.52-1.91h1.71l1.51,1.91h-1.61l-.76-.95-.75.95h-1.61ZM77.32,27.52h1.73l-.87-5.76-.87,5.76ZM83.1,15.99l-1.76,1.91h-1.26l1.17-1.91h1.86Z'/%3e%3cpath%20class='st0'%20d='M84.86,19.75c1.78,0,2.67.94,2.67,2.82v1.48c0,1.87-.89,2.81-2.67,2.81h-.85v4.28h-1.79v-11.39h2.64ZM84.01,21.37v3.86h.85c.58,0,.87-.36.87-1.08v-1.71c0-.71-.29-1.07-.87-1.07h-.85Z'/%3e%3cpath%20class='st0'%20d='M93.51,19.75c1.78,0,2.67.94,2.67,2.82v1.48c0,1.87-.89,2.81-2.67,2.81h-.85v4.28h-1.79v-11.39h2.64ZM92.66,21.37v3.86h.85c.58,0,.87-.36.87-1.08v-1.71c0-.71-.29-1.07-.87-1.07h-.85Z'/%3e%3cpath%20class='st0'%20d='M98.8,31.14h-1.79v-11.39h1.79v4.88h2.03v-4.88h1.83v11.39h-1.83v-4.88h-2.03v4.88Z'/%3e%3cpath%20class='st0'%20d='M105.36,24.55h2.46v1.62h-2.46v3.34h3.09v1.63h-4.88v-11.39h4.88v1.63h-3.09v3.18ZM108.17,17.29l-1.76,1.91h-1.26l1.17-1.91h1.86Z'/%3e%3cpath%20class='st0'%20d='M112.2,19.75c1.78,0,2.67.94,2.67,2.82v1.48c0,1.87-.89,2.81-2.67,2.81h-.85v4.28h-1.79v-11.39h2.64ZM111.35,21.37v3.86h.85c.58,0,.87-.36.87-1.08v-1.71c0-.71-.29-1.07-.87-1.07h-.85Z'/%3e%3c/g%3e%3ccircle%20class='st1'%20cx='25'%20cy='25'%20r='20'/%3e%3cpath%20class='st0'%20d='M32.78,19.27c2.92,0,4.43,2.55,5.28,5.33l.71,2.17c.14.38-.33.75-.71.75h-5.61c.19-.33.24-.71.09-1.08l-.75-2.45c-.43-1.32-.99-2.64-1.79-3.77.75-.57,1.65-.94,2.78-.94h0ZM25,18.38c3.25,0,4.9,2.78,5.89,5.89l.76,2.45c.14.42-.33.8-.8.8h-11.69c-.42,0-.94-.38-.8-.8l.75-2.45c.99-3.11,2.64-5.89,5.89-5.89h0ZM25,11.35c1.74,0,3.11,1.37,3.11,3.11s-1.37,3.11-3.11,3.11-3.11-1.41-3.11-3.11,1.41-3.11,3.11-3.11h0ZM17.27,19.27c1.08,0,1.98.38,2.73.94-.8,1.13-1.37,2.45-1.74,3.77l-.8,2.45c-.14.38-.05.75.09,1.08h-5.56c-.42,0-.9-.38-.75-.75l.71-2.17c.9-2.78,2.41-5.33,5.33-5.33h0ZM17.27,12.91c1.51,0,2.78,1.27,2.78,2.83s-1.27,2.83-2.78,2.83-2.83-1.27-2.83-2.83,1.27-2.83,2.83-2.83h0ZM32.78,12.91c1.56,0,2.78,1.27,2.78,2.83s-1.23,2.83-2.78,2.83-2.83-1.27-2.83-2.83,1.27-2.83,2.83-2.83h0ZM27.07,28.56v.09c0,.57-.24,1.08-.61,1.46h0v.05c-.38.33-.9.57-1.46.57s-1.08-.24-1.46-.61h0c-.38-.38-.61-.9-.61-1.46v-.09h1.41v.09c0,.19.05.38.19.47v.05c.09.09.28.19.47.19s.38-.09.47-.19v-.05c.14-.09.24-.28.24-.47t-.05-.09h1.41ZM30.99,28.56v.09c0,1.65-.66,3.16-1.74,4.24-1.08,1.08-2.59,1.79-4.24,1.79s-3.16-.71-4.24-1.79l-.05-.05c-1.04-1.08-1.7-2.55-1.7-4.2v-.09h1.41v.09c0,1.27.47,2.4,1.27,3.25h.05c.85.85,1.98,1.37,3.25,1.37s2.4-.52,3.25-1.37c.85-.8,1.37-1.98,1.37-3.25v-.09h1.37ZM34.99,28.56v.09c0,2.78-1.13,5.28-2.92,7.07-1.79,1.79-4.29,2.92-7.07,2.92s-5.23-1.13-7.07-2.92c-1.79-1.79-2.92-4.29-2.92-7.07v-.09h1.41v.09c0,2.4.94,4.53,2.5,6.08,1.56,1.56,3.72,2.5,6.08,2.5s4.52-.94,6.08-2.5c1.56-1.56,2.5-3.68,2.5-6.08v-.09h1.41Z'/%3e%3c/svg%3e)