ISSN 1859-1531 - THE UNIVERSITY OF DANANG - JOURNAL OF SCIENCE AND TECHNOLOGY, VOL. 22, NO. 11C, 2024 97
RESEARCH ON PROPOSING AN EFFECTIVENESS ASSESSMENT CRITERIA
FRAMEWORK OF RESIDENTIAL AND COMMERCIAL BUILDING
CONSTRUCTION INVESTMENT PROJECTS TOWARD SUSTAINABLE
DEVELOPMENT IN NHA TRANG CITY
Le Huu Hau, Nguyen Quang Trung, Huynh Thi Minh Truc*
The University of Danang - University of Science and Technology, Vietnam
*Corresponding author: htmtruc@dut.udn.vn
(Received: September 17, 2024; Revised: September 29, 2024; Accepted: October 15, 2024)
DOI: 10.31130/ud-jst.2024.565E
Abstract - In the context of global climate change, sustainable
development has become a critical factor in housing and
commercial construction projects. This research aims to
propose a framework of criteria for evaluating the effectiveness
of construction investment projects aligned with sustainable
development goals. The proposed framework is divided into
five key groups: time and cost efficiency, quality and safety
performance, environmental protection, social accessibility and
affordability, and satisfaction and legal compliance. A total of
21 criteria have been identified for empirical surveys. The study
will collect and analyze data, assess the level of consensus, and
rank the criteria accordingly. The research outcomes will
provide a framework to assist regulatory agencies and investors
in evaluating and selecting projects with sustainable
development potential, thereby contributing to the long-term
and comprehensive development of the city.
Key words - Sustainable development; Assessment criteria
framework; Residential and Commercial building; Investment
and construction projects; Nha Trang city
1. Introduction
In the context of climate change, sustainable
development becomes an important factor, especially in
housing and commercial service construction projects, to
reduce the impact on the environment and the community.
To optimize the use of water, energy and land resources, it
is necessary to develop a framework of criteria for effective
assessment and management.
In Nha Trang, the People's Committee of Khanh Hoa
province has approved the green transformation project
2024-2030 to build a sustainable, modern and
environmentally friendly urban area. Resolution 09-
NQ/TW also sets the goal of developing Khanh Hoa
province into a centrally-governed city by 2030, with Nha
Trang as the core urban area.
This study focuses on identifying and developing a
comprehensive criteria framework to effectively assess
investment projects in housing and commercial service
construction in Nha Trang, integrating sustainable
development factors. At the same time, the study also
provides specific recommendations and instructions for
applying the criteria framework into the practice of
managing construction investment projects.
2. Research overview
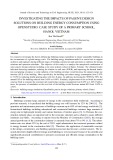
The criteria framework in this study aims to evaluate
the success of housing and commercial service
construction projects towards sustainable development,
applied at the time of completion and successful projects.
Projects in the preparation phase can refer to this
framework to improve the likelihood of success.
Consulting experts can also use the criteria framework to
make investment decisions for sustainable development in
Nha Trang. The benefits of the standard set are shown in
Figure 1.
Figure 1. Benefits of building an evaluation criteria framework
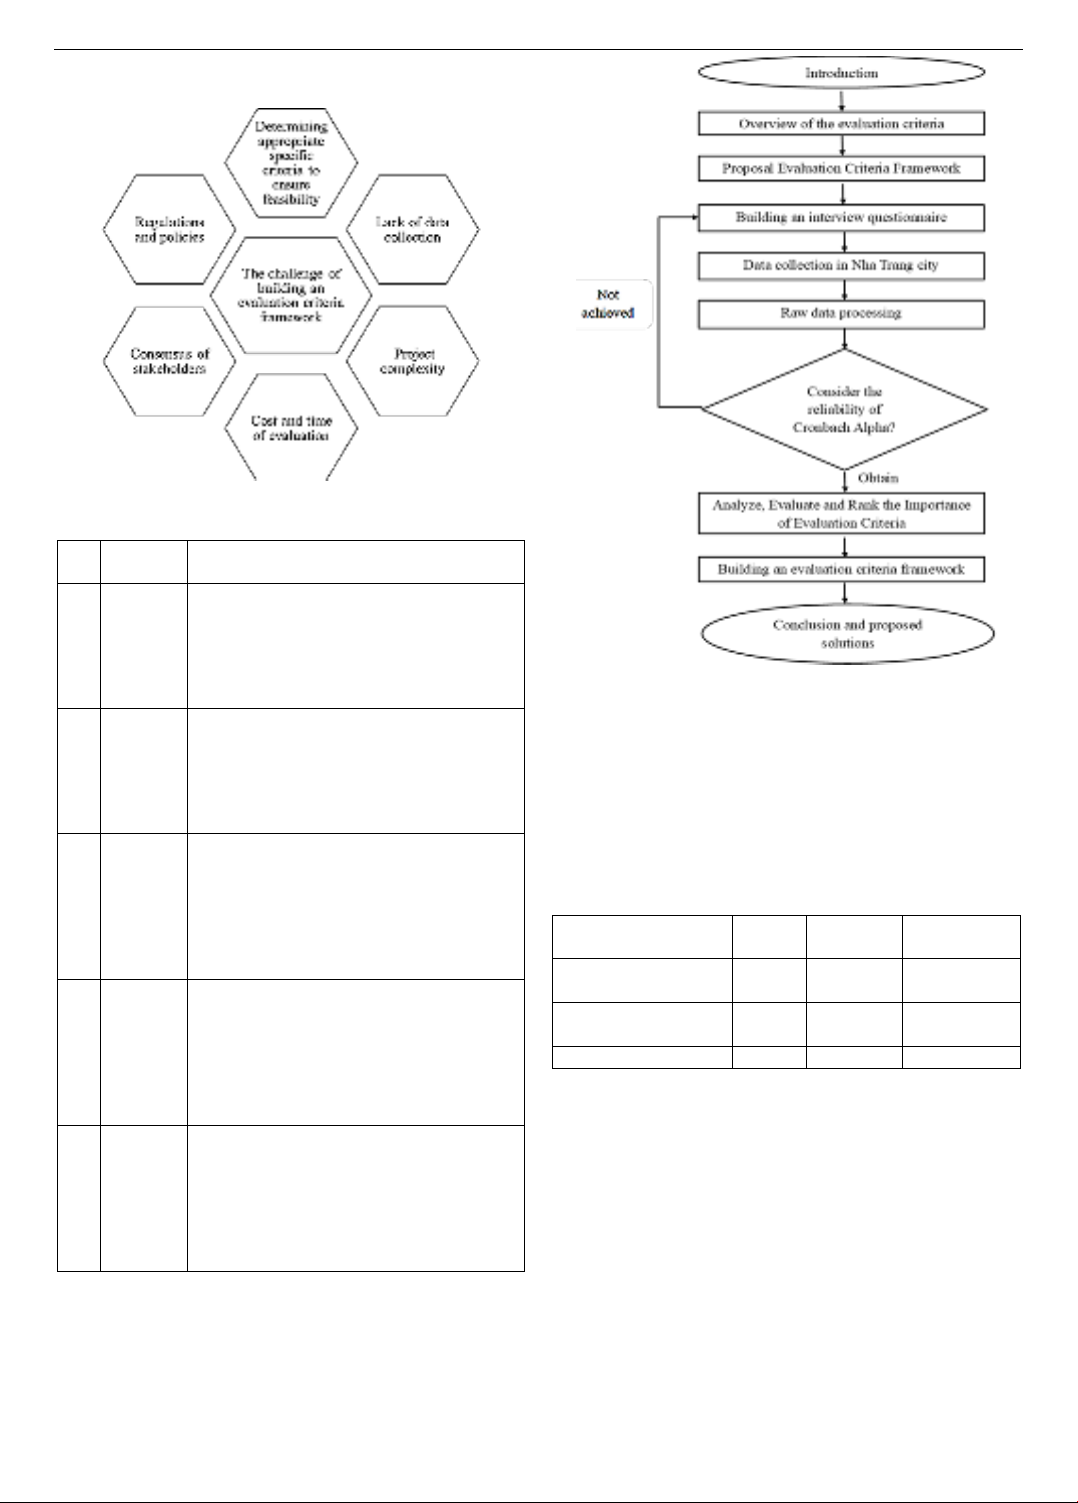
Besides, many factors need to be analyzed and clarified
to successfully build a criteria framework including the
following 6 aspects: determining appropriate specific
criteria to ensure feasibility, lack of collected data, lack of
project complexity, cost and assessment time, stakeholder
consensus, regulations and policies. The challenge of
developing an evaluation criteria framework is depicted in
Figure 2.
In addition, many factors need to be analyzed and
clarified to successfully build a criteria framework
including the following 6 aspects: determining appropriate
specific criteria to ensure feasibility, lack of data
collection, project complexity, cost and time of evaluation,
consensus of stakeholders, regulations and policies. The
challenge of building an evaluation criteria framework is
described in Figure 2. After synthesizing related studies,
this study proposed 21 standard values [3, 4, 5, 6]. In
which, the study proposed 5 main groups including: time
and cost efficiency, quality and safety efficiency,
98 Le Huu Hau, Nguyen Quang Trung, Huynh Thi Minh Truc
environmental protection efficiency, social accessibility
and affordability, humor please and add tricks (Table 1).
Figure 2. Challenges of Developing an Evaluation Framework
Table 1. Symbols of evaluation criteria
Stt
Criteria
Symbols
Evaluation criteria
I
TC
Time and cost effective
1
TC1
Project Completion Time
2
TC2
Maintainability of housing facilities
3
TC3
Reduce life cycle costs
4
TC4
Reduce public spending on housing
management
II
CL
Effective in quality and safety
5
CL1
Compliance with quality objectives
6
CL2
Aesthetic perspective of housing projects
7
CL3
Overall quality performance (cost, time,
safety, quality).
8
CL4
Safety effectiveness (crime prevention)
III
MT
Environmental protection efficiency
9
MT1
Use environmentally friendly materials for
construction
10
MT2
Energy efficient housing
11
MT3
Water-saving design and installation
12
MT4
Environmentally friendly (waste management,
environmental standards compliance).
IV
DK
Social accessibility and affordability
13
DK1
Housing affordability
14
DK2
Affordability of Housing Rentals
15
DK3
Household travel expenses to the facility
16
DK4
Functions of housing facilities
17
DK5
Technology transfer/innovation
18
DK6
Housing facility take-up rate
V
HL
Satisfaction and compliance with the law
19
HL1
Legal Effectiveness (Compliance with Law
and Legal Relationships Among
Stakeholders)
20
HL2
Stakeholder satisfaction during project
implementation
21
HL3
User Satisfaction
3. Research Methodology
3.1. Research process
The study proposes evaluation criteria frameworks to
assess the effectiveness of investment projects in housing
and commercial service construction in Nha Trang. The
research diagram is illustrated in Figure 3.
Figure 3. Research diagram
3.2. Collecting research data
This study collects data through a survey questionnaire.
The survey aims to gather stakeholder opinions on the
evaluation criteria framework for sustainable housing and
commercial service investment projects in Nha Trang. The
objective is to understand stakeholder perspectives and
improve the effectiveness of future projects.
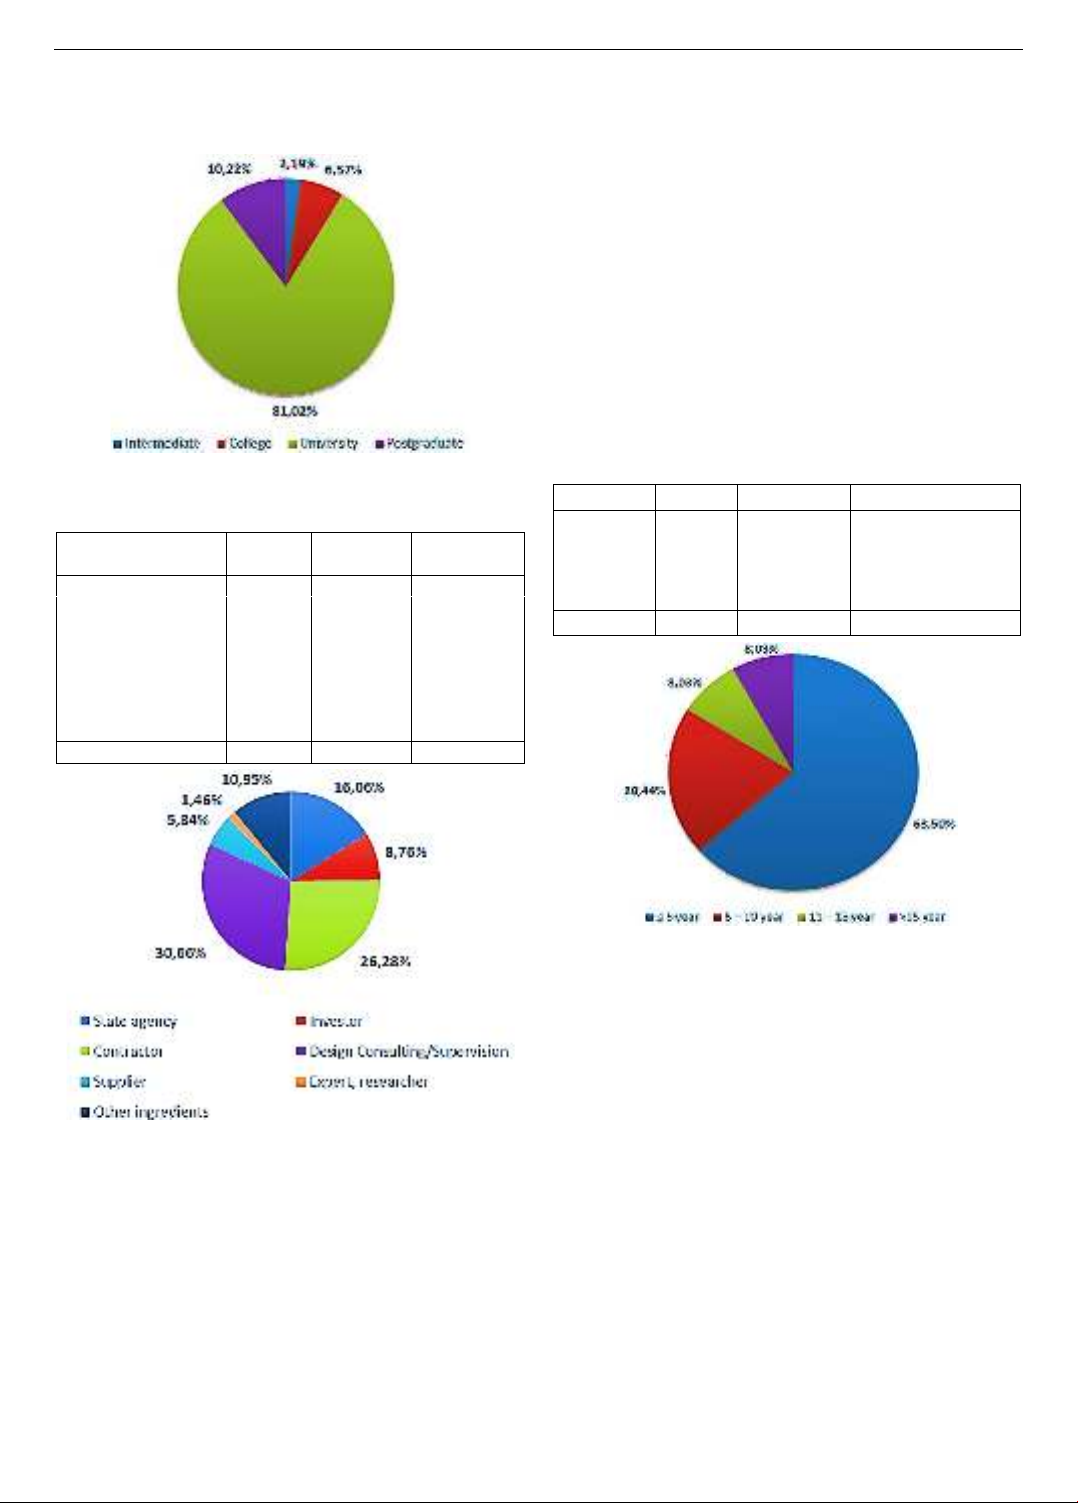
Table 2. Statistical table of interview information by
educational level
Education Level
Number
Percentage
%
Accumulation
rate %
Intermediate
3
2.19%
2.19%
College
9
6.57%
8.76%
University
111
81.02%
89.78%
Postgraduate
14
10.22%
100%
Sum
137
100%
The survey sample was built based on the diversity of
participants' educational levels, types of organizations and
work experiences. This helps ensure comprehensiveness
and accuracy, reflecting many different perspectives on the
effectiveness of construction investment projects. The
participation of highly qualified and experienced experts
further enhances the value and reliability of the survey
results. According to Table 2, the educational level of the
interviewees shows that 81.02% have university degrees,
10.22% have postgraduate degrees, 6.57% have college
degrees and 2.19% have intermediate degrees. The high
proportion of people with university degrees shows that the
majority of participants have relevant knowledge and
experience, creating an in-depth perspective on the criteria
for evaluating the effectiveness of construction investment
projects. The diversity in educational levels not only
ISSN 1859-1531 - THE UNIVERSITY OF DANANG - JOURNAL OF SCIENCE AND TECHNOLOGY, VOL. 22, NO. 11C, 2024 99
improves the accuracy and reliability of the data but also
ensures the inclusion of different perspectives, helping to
build a more comprehensive and effective criteria
framework.
Figure 4. The chart shows the level of education
Table 3. Statistical table of interview information by
type of organization
Organizational
Number
Percentage
%
Accumulation
rate %
State agency
22
16.06%
16.06%
Investor
12
8.76%
24.82%
Contractor
36
26.28%
51.09%
Design Consulting/
Supervision
42
30.66%
81.75%
Supplier
8
5.84%
87.59%
Expert, researcher
2
1.46%
89.05%
Other ingredients
15
10.95%
100%
Sum
137
100%
Figure 5. The chart shows the organizational structure of
the survey participants
According to the type of organization of the
interviewer (Table 3), the design consulting/supervision
contractor group accounts for the largest proportion
(30.66%), followed by the contractor group (26.28%) and
the agency group state agencies (16.06%). Other groups
account for 10.95%, while investors account for 8.76%,
suppliers 5.84%, and research experts 1.46%. The
diversity in the type of organization shows a strong
presence of consultants and contractor teams, providing
valuable information on the realities of project
implementation and factors affecting performance. The
presence of state agencies and research experts also
supports access to official information and in-depth
research, helping to build a more comprehensive
framework of performance assessment criteria.
After synthesizing the survey results (Table 4), the
analysis was based on the years of experience, job position,
and type of organization of the interviewees. In terms of
years of experience, the group with <= 5 years of
experience used the maximum rate of 63.5%. Next was the
group with 6-10 years of experience using 20.44%, the
group with 11-15 years of experience using 8.03%, and the
group with over 15 years of experience using 8.03%.
Although the group of experts aged 11-15 and over
15 years of experience used a small proportion of the
survey sample, they played a very important role in
influencing the interview results.
Table 4. Statistical table of interview information by
type of organization
Experience
Number
Percentage %
Accumulation rate %
≤ 5 year
87
63.50%
63.50%
6 – 10 year
28
20.44%
84%
11- 15 year
11
8.03%
92%
≥ 15 year
11
8.03%
100%
Sum
137
100%
Figure 6. Chart showing years of experience
4. Results and discussion
4.1. Ranking of criteria
The study performed a classification based on the
research criteria based on the mean values of the criteria.
The data showed that the criteria on quality assurance
(CL1), safety efficiency (CL4) and use of environmentally
friendly materials for construction (MT1), environmental
friendliness (MT4) occupied the highest positions, with
CL1 having the highest mean value of 4.19. This shows
that the standards related to quality and safety efficiency;
environmental protection efficiency were highly
appreciated in the analysis process. In contrast, the criteria
on time and cost efficiency (TC) and social accessibility
and affordability (DK), although having lower mean
values, were still in the high range (from 3.978 to 4.066),
indicating that they still play an important role but are less
prioritized. The results are shown in Table 5.
The small difference between the mean values shows a
high level of agreement between the assessments, with the
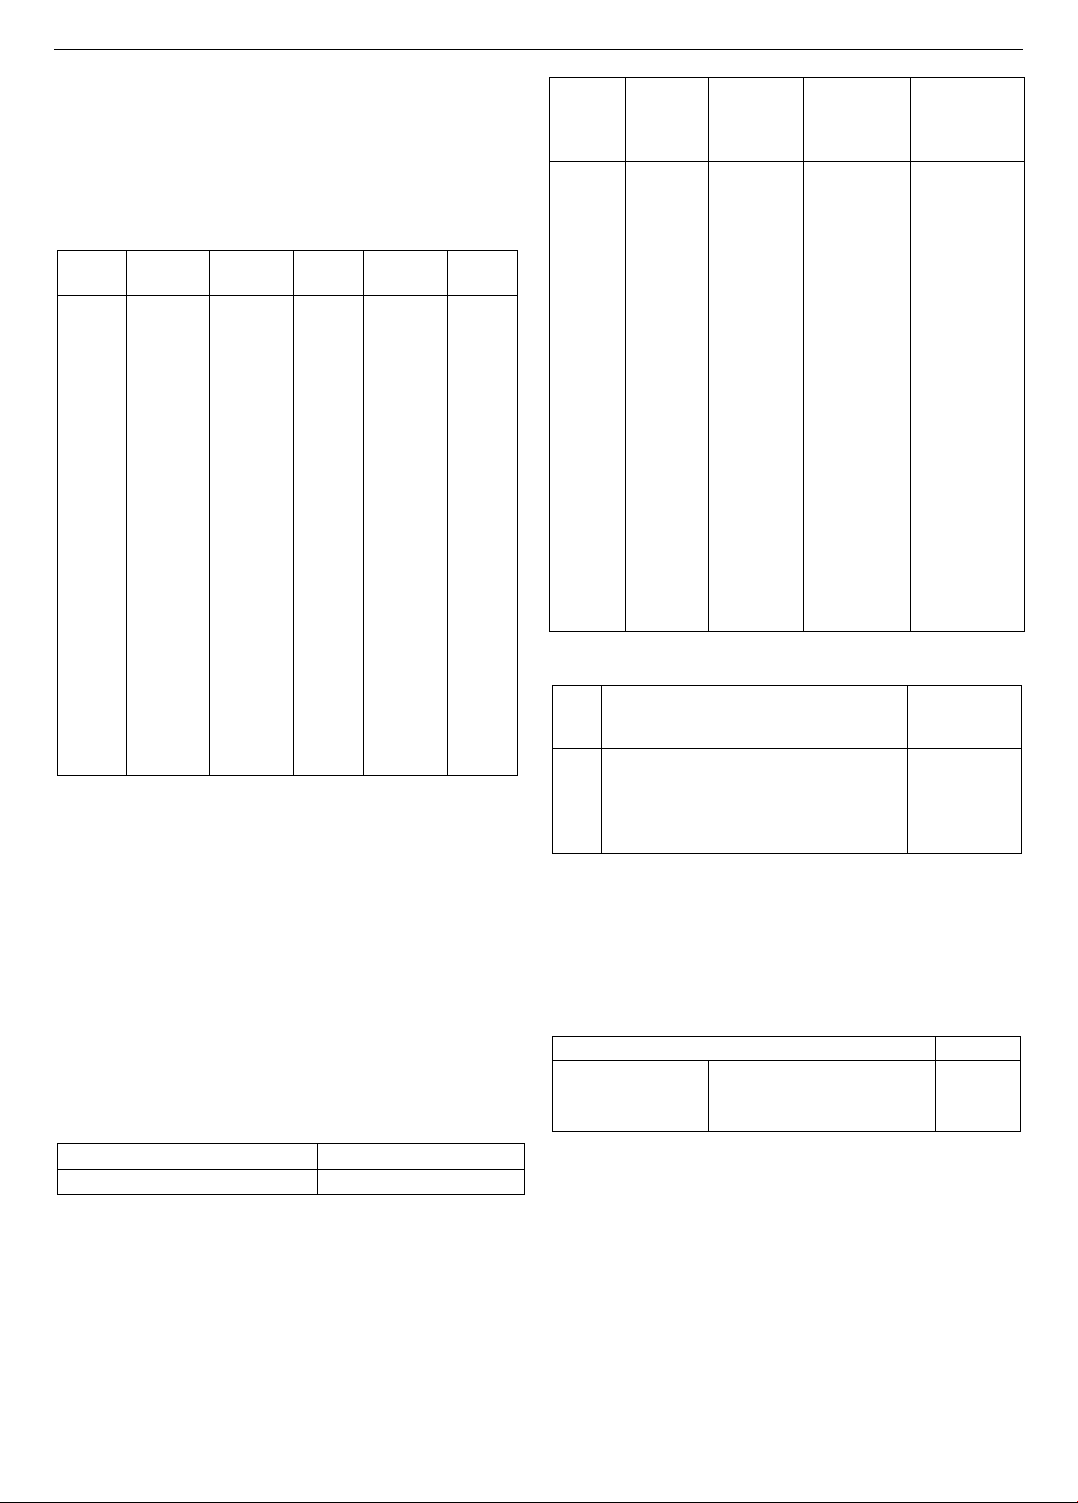
100 Le Huu Hau, Nguyen Quang Trung, Huynh Thi Minh Truc
gap between the highest (CL1) and lowest criteria of
reducing life cycle costs (TC3), reducing public
expenditure on housing management (TC4), and household
travel costs to facilities (DK3) being only about 0.21
points. This shows that there is not a large difference in
priority between the criteria in the overall assessment
process.
Table 5. Ranking of evaluation criteria
Criteria
Symbols
Minimum
Maximum
Mean
Std.
Deviation
Rating
CL1
1.0
5.0
4.190
0.9590
1
CL4
1.0
5.0
4.182
1.0016
2
MT1
1.0
5.0
4.168
1.0115
3
MT4
1.0
5.0
4.146
0.9742
4
TC2
1.0
5.0
4.131
1.0060
5
MT3
1.0
5.0
4.131
1.0133
6
CL3
1.0
5.0
4.131
1.1557
8
CL2
1.0
5.0
4.109
0.9828
9
DK1
1.0
5.0
4.066
0.9792
10
TC1
1.0
5.0
4.066
1.2497
10
HL3
1.0
5.0
4.058
1.2589
11
DK4
1.0
5.0
4.051
.9950
12
DK5
1.0
5.0
4.044
1.0493
13
MT2
1.0
5.0
4.044
1.0838
13
HL2
1.0
5.0
4.036
1.0738
14
DK2
1.0
5.0
4.015
0.9999
15
DK6
1.0
5.0
3.985
1.0360
16
TC4
1.0
5.0
3.978
1.0946
17
TC3
1.0
5.0
3.978
1.0810
17
DK3
1.0
5.0
3.978
1.0252
17
4.2. Cronbach's alpha reliability test
To assess the reliability of the survey data set, the
Cronbach’s Alpha coefficient is used [9]. This coefficient
reflects the level of correlation between observed variables.
Previous studies have shown that the Cronbach’s Alpha
coefficient is an effective tool to assess the reliability of
data. According to Nunnally, when the Cronbach’s Alpha
value is 0.7 or higher, the scale is considered reliable [10].
In addition, the Corrected Item – Total Correlation index is
also considered to assess the level of association of each
variable with the remaining variables. According to the
study of Cristobal et al. [11], factors with a total item
correlation coefficient of less than 0.3 will be eliminated to
ensure the accuracy of the scale.
Table 6. Data reliability values
Reliability value
Number of factors
0.980
21
Cronbach’s Alpha coefficient was used to assess the
reliability of the data with a value of 0.980 (Table 6),
indicating that the data is of good quality. In addition,
Table 7 presents the total correlation coefficient of each
criterion. The results show that most of the total correlation
coefficients have high values.
The study evaluated the Cronbach's Alpha coefficient
for the hypothetical groups (Table 8). The results showed
that all groups met the requirements, ensuring reliability
for further analysis.
Table 7. Overall correlation system for each criterion
Criteria
Symbols
Scale
Mean if
Item
Deleted
Scale
Variance if
Item
Deleted
Corrected
Item-Total
Correlation
Cronbach's
Alpha if
Item Deleted
TC1
81.453
312.911
0.719
0.980
TC2
81.387
314.754
0.854
0.978
TC3
81.540
313.927
0.813
0.979
TC4
81.540
312.765
0.834
0.978
CL1
81.328
315.855
0.865
0.978
CL2
81.409
314.685
0.878
0.978
CL3
81.387
313.812
0.760
0.979
CL4
81.336
314.872
0.855
0.978
MT1
81.350
314.185
0.866
0.978
MT2
81.474
313.516
0.822
0.979
MT3
81.387
313.812
0.875
0.978
MT4
81.372
317.677
0.795
0.979
DK1
81.453
314.294
0.893
0.978
DK2
81.504
314.458
0.868
0.978
DK3
81.540
314.691
0.839
0.978
DK4
81.467
313.854
0.891
0.978
DK5
81.474
314.310
0.829
0.979
DK6
81.533
313.795
0.855
0.978
HL1
81.489
315.340
0.849
0.978
HL2
81.482
314.502
0.803
0.979
HL3
81.460
314.000
0.687
0.980
Table 8. Correlation coefficient of the total variables of
the hypothesized groups
Stt
Hypothetical group
Cronbach's
Alpha
coefficient
1
Time and cost effective
0.886
2
Effective in quality and safety
0.904
3
Environmental protection efficiency
0.944
4
Social accessibility and affordability
0.960
5
Satisfaction and compliance with the law
0.850
4.3. Exploratory factor analysis EFA
The KMO value in this study reached 0.959 > 0.6 and
the sig coefficient of Bartlett's test was 0.000 < 0.05. This
result proves that the variables are closely correlated with
each other and are suitable for conducting EFA exploratory
factor analysis.
Table 9. KMO & Bartlett's Test coefficient
Kaiser-Meyer-Olkin Measure of Sampling Adequacy
0.959
Bartlett's Test of
Sphericity
Approx. Chi-Square
3280.537
df
190
Sig.
0.000
After conducting EFA factor analysis using the PCA
method with Varimax rotation and factor loading threshold
of 0.5, the study identified 04 main components suitable to
evaluate the effectiveness of housing construction
investment projects. Residential and commercial buildings
in Nha Trang. The rotation results of the four exploratory
factors are presented in Table 10, clarifying the important
criteria to consider.
According to the results in Table 10, factor MT1 has a
factor loading coefficient expressed on 02 main factors,
with the loading difference between the two factors being
0.019 (less than 0.2). However, MT1 still holds the 3rd
ranking position out of 21 criteria, affirming its important
ISSN 1859-1531 - THE UNIVERSITY OF DANANG - JOURNAL OF SCIENCE AND TECHNOLOGY, VOL. 22, NO. 11C, 2024 101
role in evaluating the effectiveness of residential and
commercial construction investment projects in Nha
Trang. Therefore, the study still retains MT1 in the factor
with a higher loading factor, specifically factor 3. The
results of the four factors discovered in the study are
presented in Table 11.
The survey results clearly identify participants'
priorities regarding quality, safety and environmental
protection in project construction works, while
emphasizing the importance of time and cost in the process.
Table 10. Rotation matrix result
Main ingredients
1
2
3
4
DK3
0.801
DK4
0.745
DK2
0.736
DK5
0.724
CL2
0.693
DK1
0.671
CL1
0.640
DK6
0.622
CL4
0.610
TC1
0.835
CL3
0.810
HL3
0.692
HL2
0.549
MT4
0.782
MT2
0.717
MT3
0.637
MT1
0.577
0.596
TC3
0.721
TC4
0.680
TC2
0.658
HL1
0.638
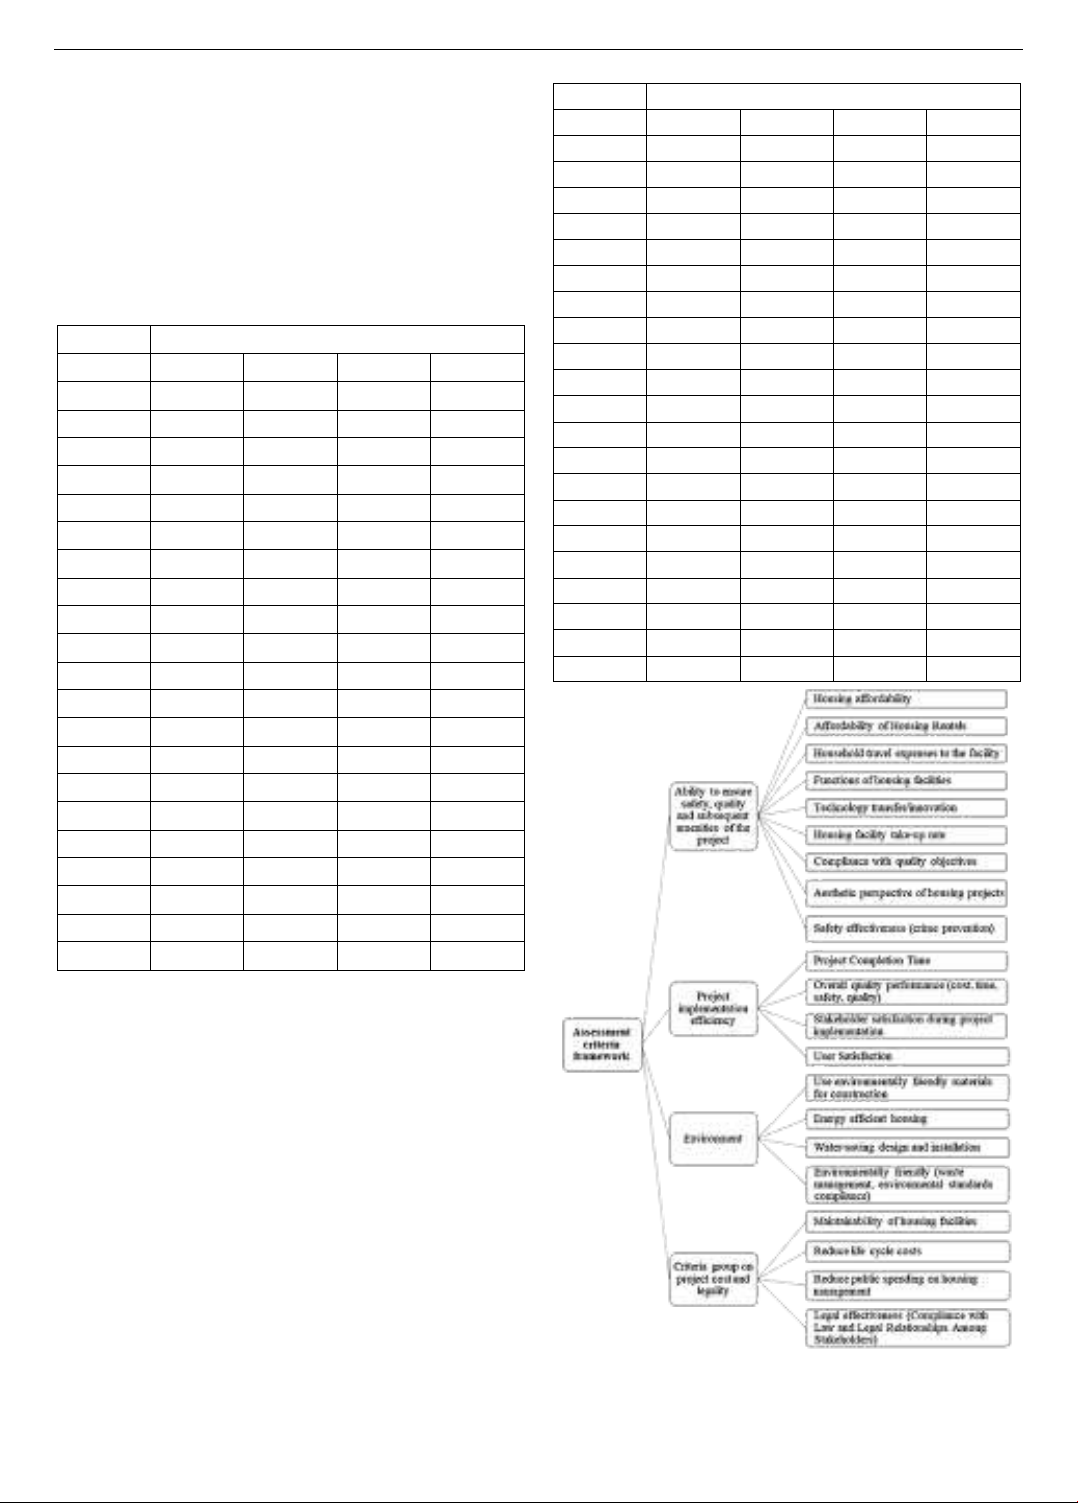
4.4. Proposed Evaluation Criteria Framework
Based on the analysis results in Table 11, this study
proposes a criteria framework (Figure 7) to evaluate 04
exploratory factors in order: (1) Criteria group on the
ability to ensure safety, quality and social access of the
project (including criteria DK1, DK2, DK3, DK4, DK5,
DK6, CL1, CL2, CL4); (2) Criteria group on evaluating
project implementation efficiency (including criteria TC1,
CL3, HL2, HL3); (3) Criteria group on environment
(including criteria MT1, MT2, MT3, MT4); (4) Criteria
group on project cost and legality (including criteria TC2,
TC3, TC4, HL1).
The criteria for safety, quality and social access are
crucial to the success of a project. Safety prevents risks and
builds community trust. Quality ensures compliance with
technical standards, improves efficiency and reduces repair
costs. Social access benefits the community, especially
vulnerable groups. This criteria not only ensures safety and
quality but also connects the project to society.
Table 11. Exploratory Factor Analysis
Main ingredients
1
2
3
4
DK3
0.801
DK4
0.745
DK2
0.736
DK5
0.724
CL2
0.693
DK1
0.671
CL1
0.640
DK6
0.622
CL4
0.610
TC1
0.835
CL3
0.810
HL3
0.692
HL2
0.549
MT4
0.782
MT2
0.717
MT3
0.637
MT1
0.596
TC3
0.721
TC4
0.680
TC2
0.658
HL1
0.638
Figure 7. A effectiveness assessment criteria framework of
residential and commercial building construction investment
projects toward sustainable development in Nha Trang city