Journal of Medicine and Pharmacy - No.5 69
ENDOSCOPIC FEATURES AND RISK FACTORS
OF ESOPHAGEAL VARICEAL BLEEDING
IN CIRRHOTIC PATIENTS
Hoang Trong Thang, Nguyen Thi Phuong Uyen
Hue University of Medicine and Pharmacy, Vietnam
Abstract
Objective: Esophageal variceal bleeding is a severe complication in cirrhosis, so assessing the risk
factors for rebleeding play an important role in treating and predicting for cirrhotic patients. Patients and
methods: 84 patients enrolled in study. Criteria diagnosis of cirrhosis bazed on portal vein hypertension
and liver failure sydroma, associated with U.S signs. The endoscopic classification by JEA. The risk
factors of esophageal variceal bleeding including: Child Pugh index, endoscopic images: Size of varices,
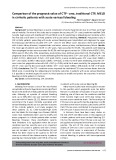
the red signs and platelet count. Results: (i) The 3rd grade of varices: 46.4%, the 1rst: 28.6% and the
2nd: 25.0%; (ii) The red signs: 17.9%, and none red signs: 82.1%; (iii) The sites of varices: 1/3 lower
part of esophage: 80.9%; (iv) The mean diameter of portal vein in red signs group: 15.5 ± 1.1 mm, and
in none red signs group: 12.1 ± 1.7 mm; (v) The middle and severe bleeding in red signs group: 92.2%;
in the none red signs group only 76.5% (p < 0.05). Conclusion: (i) Endoscopy was the best method in
esophageal variceal detection, most cases of varices located at the 1/3 under part of esophage. There
was the relation between the red signs and the degree of esophageal varices p < 0.01; (ii) The bigger the
diameter of portal vein the more severe of esophageal varices.
Key words: Esophageal varice, cirrhosis
1. INTRODUCTION
Esophageal varices bleeding is a common
and severe complication in cirrhosis. It’s the
second cause in G.I bleeding and consumed
a large money in treatment. The mortality
rate for the first time of bleeding reached to
20-50%.
Primary prevention in Esophageal variceal
bleeding aim to reduce the mortality and
increase the survival to the patients. Upper
G.I endoscopy took a very important role in
the diagnosis, prognosis the rebleeding of
esophageal varices, so the study aimed to
describe the images of esophageal varices
and to evaluate the relationship between
the endoscopy images and the risks factors
due to Esophageal variceal bleeding in
decompensated cirrhosis.
2. PATIENTS AND METHODS
Including 84 in patients with decompensated
cirrhosis > 15 years old admitted to Gastro
enterology Department of Hue Central Hospital.
2.1. Diagnosis criteria of cirrhosis
Mainly based on the portal hypertension
and liver failure syndrome associated with the
typical signs of of cirrhosis on ultrasound.
2.1.1. Characteristic of Esophageal variceal
endoscopy
Followed the criteria of JEA, including: sites,
size, aspects, red signs, and the bleeding images.
2.1.2. Assesement the risk factors in
esophageal variceal bleeding
- The Child Pugh index
- Endoscopic images: The size of varices,
thered signs.
- The platelet count
3. RESULTS
3.1. Endoscopy
3.1.1. Located of varices
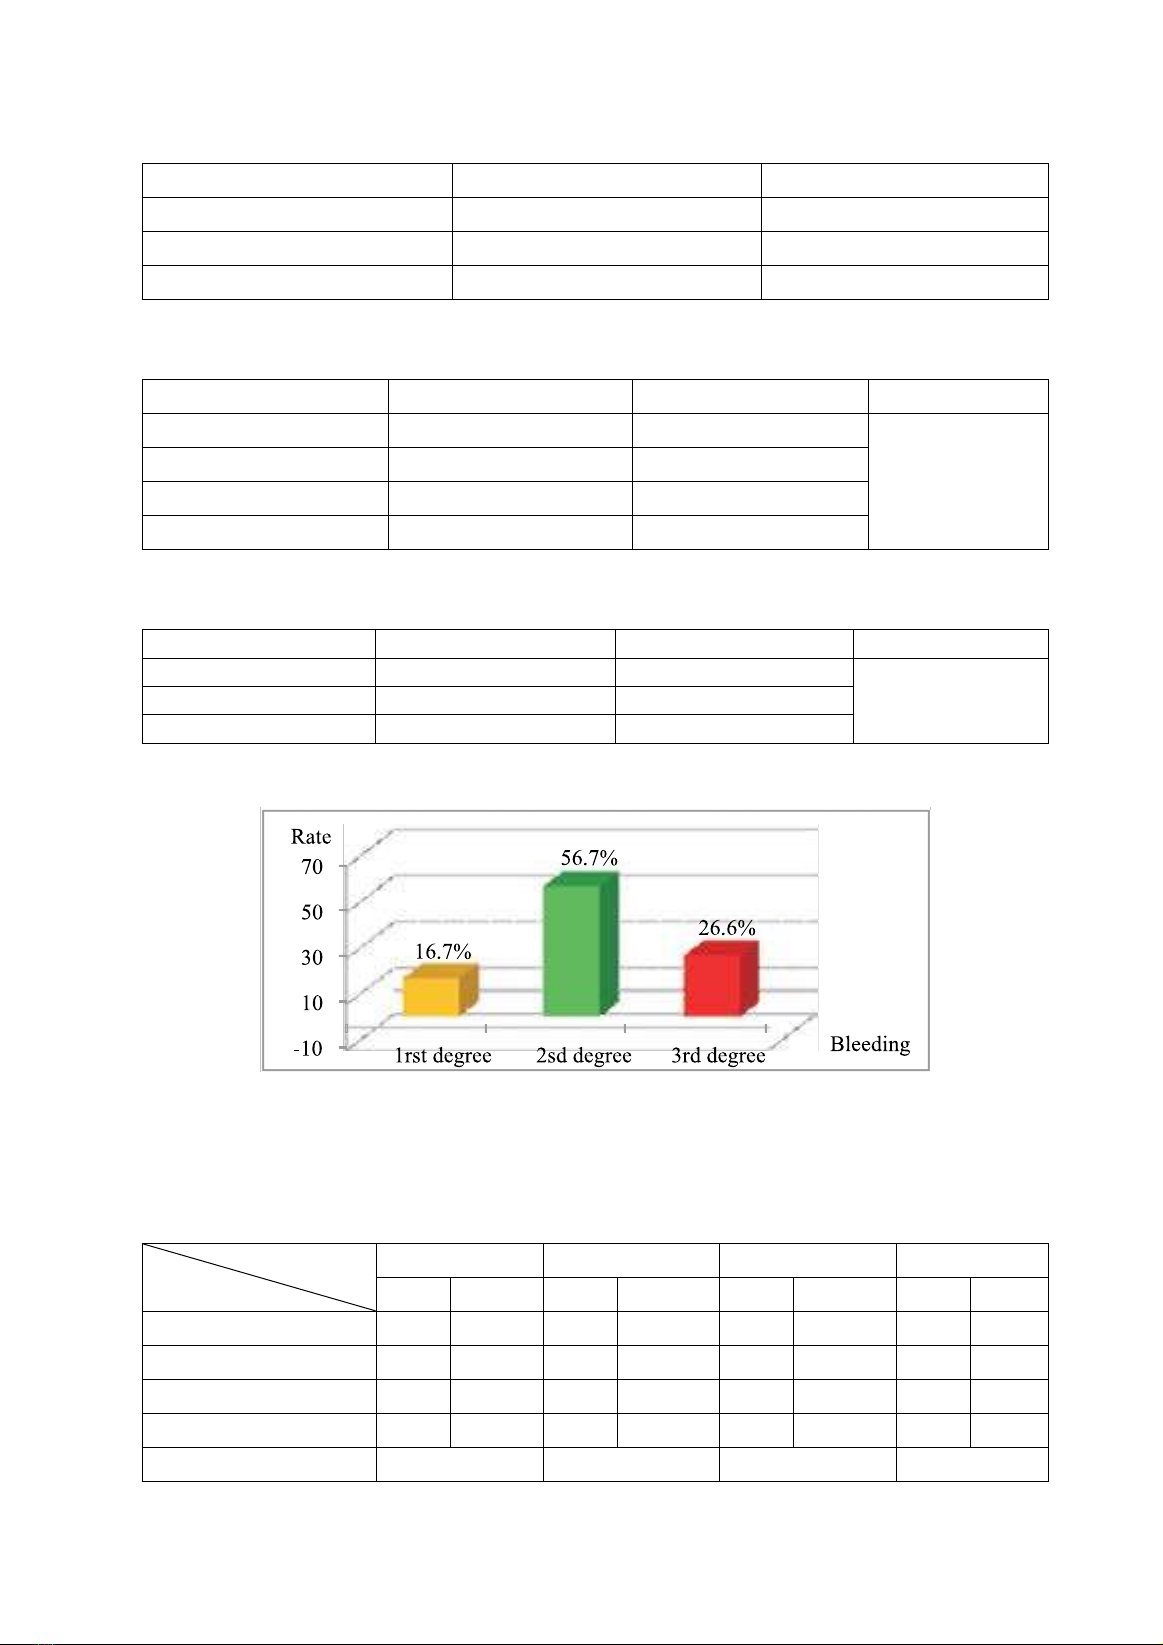
Table 1. Distribution the sites of varices
Site Pts %
1/3 of under part 68 80.9
2/3 of under part 16 19.1
Tol 84 100.0
Mostly of varices belong to 1/3 of under.
- Corresponding author: Hoang Trong Thang, email: htthang2002@yahoo.com
- Received: 12/5/2014 * Revised: 22/6/2014 * Accepted: 25/6/2014 DOI: 10.34071/jmp.2014.1e.12
Journal of Medicine and Pharmacy - No.5
70
3.1.2. The form of varices
Table.2 The forms of varices
Forms pts %
Bunch of grape 59 70.2
Linear 25 29.8
Tol 84 100.0
Bunch of grape account for 70.2%.
3.1.3. Degree of varices
Table 3. The distribution of the degree of varices
Degree pts % P
1rst degree 24 28.6
<0.05
2sd degree 21 25.0
3rd degree 39 46.4
Tol 84 100.0
The 3rd degree of varices 46.4%.
3.1.4. The red signs on the esophageal variceal vein
Table 4. Distribution of the red signs on the esophageal variceal vein
Red signs Pts % P
Yes 15 17.9
<0.01No 69 82.1
Tol 84 100.0
Red signs account for only 17.9%. Mostly of pts have no red signs: 82.1%.
3.1.5. Degree of bleeding due to esophageal varices bleeding
Chart 3.1. Degree of bleeding
Midle bleeding 56.7%, the mild bleeding was low 16.7% and severe bleeding 26.6%.
3.2. The relations between the image of varices and the risk of variceal bleeding
3.2.1. The relation of Child-Pugh and the degree of esophageal varices
Table 5. The relation of Child-Pugh and the degree of esophageal varices
Varices
Child-Pugh
1rst 2nd 3rd Tol
n% N % N % N %
Child-Pugh A 2 8.3 2 9.5 4 10.3 8 9.5
Child-Pugh B 9 37.5 6 28.6 18 46.2 33 39.3
Child-Pugh C 13 54.2 13 61.9 17 43.6 43 51.2
Tol 24 100.0 21 100.0 39 100.0 84 100.0
P< 0.01 < 0.01 < 0.01
In the 3rd group, the Child-Pugh B: 6.2% higher than the Child-Pugh C (43.6%), p < 0.01.
Journal of Medicine and Pharmacy - No.5 71
3.2.2. Relation between the degree of varices and the red signs
Table 6. Relation of the degree of varices and the red signs
Varices
Red sign
1 st 2 nd 3 rd Tol
N % N % N % N %
Yes 0 0.0 4 19.1 11 45.8 15 17.8
No 24 100.0 17 80.9 24 54.2 69 82.2
Tol 24 100.0 21 100.0 39 100.0 84 100.0
P < 0.01 < 0.01
Mostly the red signs belong to the 3rd grade of varices, without red sign in the 1rst grade varices, p < 0.01.
3.2.3. Relation between the red signs and the diameter of portal vein
Table 7. Relation between the red signs the diameter of portal vein
Red signs Yes No
Diameter of portal vein (mm) 15.5 ± 1.1 12.1 ± 1.7
rs = 0.635, p < 0.05
There was the relation between the red signs the diameter of portal vein p < 0.05.
3.2.4. Relation between the red signs and the severity of bleeding
Table 8. Relation between the red signs and the severity of bleeding
Bleeding
Red sign
Mild midle severe Tol
N % n%n% N %
Yes 1 7.8 6 46.1 6 46.1 13 100.0
No 4 23.5 11 64.7 2 11.8 17 100.0
Tol 5 16.7 17 56.7 8 26.6 30 100.0
P < 0.05
Midle and severe bleeding in red sign group: 92.2%, higher than in those with no red sign: 76.5%,
p < 0.05.
3.2.5. Relation between the varices and the number of platelets
Table 9. Relation between the varices and the number of platelets
Plats
Varices
<150 K/µL ≥150 K/µL Tol
N % N % N %
1 19 26.4 5 41.7 24 28.6
2 18 25.0 3 25.0 21 25.0
3 35 48.6 4 33.3 39 46.4
Tol 72 100.0 12 100.0 84 100.0
P< 0.01 > 0.05
In group of low platelets (< 150 K/µL); mainly the varices belong to 2rd and 3rd degree in which the
3rd degree: 48.6%, p < 0.01.
Journal of Medicine and Pharmacy - No.5
72
4. DISCUSSION
4.1. Location of varices
Mostly the varices located in the 1/3 of
lower part of esophage: 80.9%; 2/3 of upper
part: 9.1%. According to Nguyen Khanh Du
80.0% varices located in the 1/3 of lower
esophageal part. The study of To Thi Tinh: the
varices located in 1/3 of lower part: 80.0%.
According to Nguyen Thi Thu Huong, varices
located in 1/3 of lower part: 64.7%. Our
results was similar to these study.
4.2. The forms of varices
In our study the bunch grape form of varices:
70.2%, the linear form only 29.8%.
The result of Phan Hong Nhan, the bunch grape
form: 82.5%. That was similar to those of us.
4.3. The degree of varices
In our study, the 3rd degree of varices: 46.4%,
the 1rst degree was only 28.6%, and the 2rd degree
of varices: 25.0%.
Tran Ngoc Luu Phuong studied on 115 pts
have also showed: the 1rst degree: 11.1%, the 2nd:
26.0%, and the 3rd: 48.1%.
The results of Nguyen Thi Thu Huong showed
the 3rd: 65.7%, the 2nd: 21.3% and the 1st degree:
13.0%. Our result was similar.
4.4. The presence of red signs on varices
In our study there was only 17.9% varices
with red signs, and varices none red signs: 82.1%,
p < 0.01. The red signs in the study of Nguyen Thi
Thu Huong: 58.0%.
4.5. Relation between Child-Pugh index and
varices
The 3rd grade of varices were mostly in Child
B and C, in Child B: 46,2% and higher than in
Child C: 43.6% (< 0.01). That was concordant
to those of Tran Ngoc Luu Phuong, the 2nd and
3rd varices in cirrhosis with Child-Pugh B and
C: 67.8%, higher than in Child-Pugh A: 4.4%,
p <0.02.
4.5. Relation between varices and red signs
The results showed that the red signs appear
only in 2nd and 3rd esophageal varices, no red signs
in 1rst grade of varices (p < 0.05). The result of
Nguyen Thi Thu Huong, in 3rd grade of varices, the
red signs: 75.0%, and 40.9% in 2nd grade of varices
(p< 0.05). The bigger of the varices the thinner of
the wall, so it’s easy to rupture.
4.6. Relation between the red signs and the
diameter of portal vein
The mean diameter of portal vein in group with
red signs: 15.5 ± 1.1mm, meanwhile in none red
signs group: 12.1 ± 1.7 mm, p< 0.01.
There was the relation between the red signs
and the diameter of portal vein. According to
Kieu Thi Phuong Nhan, the mean diameter
of portal vein in red signs group: 1.33 ± 0.12
cm higher than in the none red signs group:
1.2± 0.1 cm, p < 0.05
4.7. Relation between the red signs and bleeding
In red signs group, the middle and severe
bleeding: 92.2% higher than in the none red signs
group: 76.5% (p < 0.05). According to Nguyen
Thi Thu Huong, in red signs group, the severe
bleeding: 60.3% and in none red signs group the
bleeding was only 37.5%.
4.8. Relation between the varices and the
platelets
In group with platelets <150 K/µL, the 3rd
grade of varices was 48.6%, (p< 0.05). Meanwhile
in group with platelets >150 K/µL, the 2nd grade
of varices was dominant, p > 0.05. According
to Tran Anh Tuyet, the platelets < 100 K/µL
was the predictive factor of varices. The study
of Hoang Trong Thang also showed that the
cut -off point of platelets count in prediction of
varices: 97 K/µL.
5. CONCLUSION
5.1. The endoscopic images of esophageal
varices
- The 3rd grade of varices: 46.4%, the 1rst:
28.6% and the 2nd: 25.0%.
- The red signs: 17.9%, and none red signs:
82.1%.
- The sites of varices: 1/3 lower part of
esophage: 80.9%.
5.2. Relation between the endoscopic images
and the risk factors of esophageal variceal
bleeding
- There was the relation between the red signs
and the degree of esophageal varices p < 0.01.
- The bigger the diameter of portal vein the
more severe of esophageal varices.
- There was a close positive relation between
diameter of portal vein and the red signs
(rs= 0.635, p < 0.05). The mean diameter of portal
vein in red signs group: 15.5 ± 1.1 mm, and in
none red signs group: 12.1 ± 1.7 mm.
- The red signs related to the esophageal
variceal bleeding; the middle and severe bleeding
in red signs group: 92.2%; in the none red signs
group only 76.5% (p < 0.05).
Journal of Medicine and Pharmacy - No.5 73
REFERENCE
1. Mai Hong Bang (2006), “Study the relation
between the esophageal varix with the grade
of cirrhosis and the complication of GI
bleeding”, Practice Medicine Journal, (2), pp.
29-31.
2. Pham Thi Binh (2008), “Normal and
pathologic images of esophageal endoscopy”,
GI endoscopy, Medicine Publishing House,
pp. 28-5, 52-80.
3. Nguyen Thi Thu Huong (2012), Study the
endoscopic features of esophageal varix and
the bleeding complication in decompensated
cirrhosis, Thesis of specialty level 2, Hue
Medicine and Pharmacy University.
4. Vu Van Khien, Vu Truong Khanh, Nguyen
Manh Hung et Al. (2012), “The efficacy of
urgent hemostasis and ablation of varix in
cirrhotic patients.
5. Hoang Trong Thang, Phan Trung Tien (2008),
“Study the platelet count and spleen diameter
in cirrhotic pts to predict the presence of
esophageal varix”, Vietnamese Hepatology
Journal, (8), pp. 28-33.
6. Devrajani B.R., et al (2009), “Variceal
Bleeding and its Dependence on Portal Vein
Size in Liver Cirrhotic Patients”, World
Journal of Medical Sciences, 4(1), pp. 50-53.
7. Magalhaes T., et al (2011),“Prognostic factors
of mortality in esophageal variceal bleeding”,
19th United European Gastroenterology Week,
pp. 22-26.
8. Sanyal A.J. (2010), “Prediction of variceal
hemorrhage in patients with cirrhosis”,
Uptodate. Com, July 16th.
9. Xu Liang, Ji Feng, et al (2011), “Risk factors
for predicting early variceal rebleeding
after endoscopic variceal ligation”, World J
Gastroenterol, 17(28), pp. 3347-3352.