Original
article
Evaporation
and
surface
conductance
of
three
temperate
forests
in
the
Netherlands
A.
Johannes
Dolman
Eduardus
J.
Moors,
Jan
A.
Elbers,
Wim
Snijders
DLO
Winand
Staring
Centre,
PO
Box
125,
Wageningen,
the
Netherlands
(Received
12
March
1997;
accepted
17
September
1997)
Abstract -
This
paper
shows
the
behaviour
of
evaporation
and
surface
conductance
for
three
dif-
ferent
forests
in
the
Netherlands:
a
pine,
larch
and
poplar
forest.
Maximum
evaporation
rates
of
the
forests
are
similar
and
approach
the
equilibrium
evaporation
rates
for
large
extended
sur-
faces.
There
is
a
tight
relationship
between
available
energy
and
evaporation
for
poplars,
less
so
for
pine
and
larch.
Average
evaporation
declines
in
the
order:
poplar,
larch,
pine
forest.
Observed
maximum
conductances
follow
this
trend
with
the
poplar
having
the
highest
conductance
of
55
mm
s
-1
,
the
larch
intermediate
with 31
mm
s
-1
and
pine
the
lowest
28
mm
s
-1
.
Stomatal
control
was
most
strong
in
the
pine
forest
and
less strong
in
the
poplar
forest.
The
conductance
of
all
three
forests
follows
a
strong
near-linear
decrease
with
humidity
deficit
until
8-10
g
kg-1
,
with
a
slowly
reducing
conductance
afterwards.
For
pine
and
larch
the
surface
conductance
reaches
the
50
%
reduction
value
already
at
solar
radiation
levels
of
150
W
m
-2
,
while
poplar
shows
a
much
less
rapid
increase.
The
maximum
conductance
found
here
for
pine
corresponds
well
with
pre-
viously
published
values
for
the
same
species.
The
value
for
the
larch
and
poplar
stand
are
high
compared
to
other
published
results.
This
may
be
due
to
the
relatively
long
sampling
period
of the
present
study,
which
increases
the
likelihood
of
obtaining
rare
high
values.
The
results
also
sug-
gest
that
at
the
local
to
regional
scale
large
differences
may
be
found
in
forest
water
use.
For
pre-
dicting
water
yield
of forests
at
this
scale,
the
local
variation
in
water
use
and
stomatal
control
will
have
to
be
taken
into
account.
(©
Inra/Elsevier,
Paris.)
surface
conductance
/ stomatal
conductance
/
evaporation
/
forest
stand
/
scaling
Résumé -
Évapotranspiration
et
conductance
de
couvert
de
trois
forêts
tempérées
aux
Pays-Bas.
Cet
article
analyse
l’évapotranspiration
et la
conductance
du
couvert
pour
la
vapeur
d’eau
de
trois
peuplements
forestiers
aux
Pays-Bas :
pin,
mélèze
et
peuplier.
Les
taux
maximaux
d’éva-
poration
sont
du
même
ordre
de
grandeur
et
étaient
proches
de
l’évaporation
d’équilibre
pour
des
surfaces
importantes.
Il
existe
une
relation
étroite
entre
l’énergie
disponible
et
l’évapotranspira-
tion
pour
le
peuplier,
et
moins
forte
pour
le
pin
ou
le
mélèze.
L’évapotranspiration
moyenne
des
peuplements
est
la
plus
élevée
pour
le
peuplier
et la
plus
faible
pour
les
pins.
Les
conductances
maximales
de
couvert
sont
rangées
dans
le
même
ordre :
celle
du
peuplier
montre
la
plus
forte
valeur,
55
mm
s
-1
,
celle
du
mélèze
une
valeur
intermédiaire,
31
mm
s
-1
,
et
celle
du
pin
est
la
plus
faible,
28
mm
s
-1
.
Le
contrôle
stomatique
est
le
plus
fort
chez
le
pin
et
le
plus
faible
chez
le
*
Correspondence
and
reprints
peuplier.
La
conductance
des
trois
peuplements
montre
une
forte
décroissance
linéaire
avec
le
défi-
cit
de
saturation
de
l’air
jusqu’à
environ
8
à
10
g kg
-1
,
puis
une
décroissance
plus
lente
au-delà.
Pour
le
pin
et
le
mélèze
la
conductance
stomatique
atteint
50
%
de
son
maximum
pour
un
rayon-
nement
global
de
150
W
m
-2
,
alors
que
le
peuplier
montre
une
augmentation
moins
rapide.
Les
conductances
maximales
chez
le
pin
trouvées
ici
correspondent
bien
aux
valeurs
publiées.
Celles
du
mélèze
et
du
peuplier
sont
élevées
par
rapport
aux
données
de
la
littérature.
Cela
est
peut-être
dû
à
la longue
durée
de
la
période
de
mesure
de
cette
étude,
ce
qui
augmente
la
probabilité
d’observer
des
valeurs
exceptionnellement
fortes.
Les
résultats
montrent
aussi
que
des
diffé-
rences
importantes
de
consommation
en
eau
par
les
forêts
peuvent
être
mises
en
évidence,
aussi
bien
à
l’échelle
locale
que
régionale.
Pour
la
prévision
du
bilan
d’eau
des
forêts,
il
est
nécessaire
de
prendre
en
compte
les
variations
locales
de
consommation
en
eau
et
de
conductance
stomatique.
(©
Inra/Elsevier,
Paris.)
conductance de
couvert
/ conductance
stomatique
/
evaporation
/
échelle
1.
INTRODUCTION
Despite
considerable
advances
in
our
understanding
of
forest
hydrological
pro-
cesses
[26],
a
number
of
practical
forest
hydrological
problems
do
continue
to
exist
in
the
areas
of
water
and
land
management.
For
instance,
since the
publication
of
a
series
of
model
simulations
of
water
use
of
typical
(model)
forest
stands
for
the
Nether-
lands
[8],
forests
on
the
high
sandy
soils
in
the
Netherlands
have been
seen
as
the
prime
culprits
of
the
increasing
water
consumption
in
these
areas.
This
in
turn,
has
led
to
plans
to
replace
areas
with
dark
coniferous
forests
(Douglas
fir)
with
species
consuming
less
water
such
as
oak and
Scots
pine.
At
the
same
time,
technological
progress
in
fast
response
sonic
anemome-
try,
humidity
and
trace
gas
measurement
(e.g.
[23])
has
made
it
possible
to
rou-
tinely
measure
evaporative
fluxes
of
forests
and
other
vegetation
types
over
prolonged
periods
of
time.
This
has
led
to
an
increase
in
studies
analysing
the
major
vegetational
controls
on
land
surface
atmo-
sphere
interaction
at
canopy
scale
[3].
To
provide
additional
information
to
water
resource
and
land
managers
in
the
Nether-
lands,
an
extensive
project
was
started,
aimed
at
quantifying
the
water
use
of
forests
by
experimental
methods.
This
should
provide
the
observational
basis
against
which
the
initial
modelling
esti-
mates
could
be
tested
and
also
provide
the
basis
to
obtain
parameter
values
for
future
modelling
[7].
Evaporation
can
be
described
by
gra-
dient-diffusion
theory
with
two
conduc-
tances
indicating
the
major
controls
of
water
from
the
vegetation
to
the
atmo-
sphere.
The
physiologically
based
canopy,
or
surface
conductance,
describes
trans-
port
from
the
saturated
leaf
stomatal
sur-
face
to
the
air
just
outside
the
leaf.
The
aerodynamic
conductance
describes
trans-
port
from
the
air
outside
the
leaf
to
the
air
at
a
certain
reference
height
above
the
canopy.
For
forest
the
main
control
of
evaporation
is
through
the
surface
con-
ductance
rather
than
through
the
aerody-
namic
conductance,
which
is
generally
an
order
of
magnitude
larger.
For
vegetation
with
lower
height
and
aerodynamic
rough-
ness,
the
conductances
are
of
similar
mag-
nitude
or
the
surface
conductance
is
the
larger
of
the
two.
The
behaviour
of
surface
conductance
in
evaporation
models
can
be
described
by
expressing
the
actual
conductance
as
a
maximum
conductance
limited
by
a
number
of environmental
factors,
such
as
temperature,
solar
radiation
(or
photo-
synthetically
active
radiation),
atmospheric
humidity
deficit
and
leaf
water
potential
or
soil
moisture
[14,
31].
Although,
the
exact
mathematical
formulations
of
the
func-
tions
differ
among
authors,
the
general
shape
of
these
functions
appears
to
be
broadly
similar
for
various
forests
[16,
30].
In
the
observations
this
maximum
value
is
never
obtained,
as
generally,
always
some
form
of
environmental
stress
is
present.
In
this
paper
the
maximum
con-
ductance
always
refers
to
an
observed
value.
Several
reviews
have
appeared
recently
addressing
the
surprising
lack
of
variation
of
maximum
surface
conductance
amongst
the
major
vegetation
types
of
the
world
[16,
17, 28].
Similarly,
at
the
leaf
level,
Körner
[18]
found
small
variation
amongst
stomatal
conductance
of
vegeta-
tion
types.
The
fact
that
at
the
local
or
regional
scale
large
differences
in
water
use
of
forest
may
exist,
and
that
at
the
global
scale
often
all
the
temperate
forests
may
be
described
by
a
few
parameters,
points
to
an
interesting
scale
problem,
viz.
is
it
possible
to
use
the
global
compila-
tions
of
data,
averaged
for
particular
veg-
etation
types,
to
make
predictions
at
the
local
or
regional
scale.
For
practical
water
management,
it
is
likely
that
the
variation
in
water
use
will
still
be
the
single
most
important
factor
on
which
management
decisions
will
be
based.
The
current
paper
aims
to
analyse
the
differences
and
similarities
in
evaporation
and
surface
conductance
of
three
temper-
ate
forests
in
the
Netherlands.
Evapora-
tion
rates
and
surface
conductances
of
the
forests
will
be
compared
at
both
seasonal
and
diurnal
time
scales
and
functional
dependencies
sought.
It
is
the
purpose
of
this
paper
to
seek
for
generalities
on
which
a
useful
qualitative
comparison
can
be
based,
the
modelling
approach
is
the
sub-
ject
of
another
paper.
2.
SITE
DESCRIPTION
AND
MEASUREMENTS
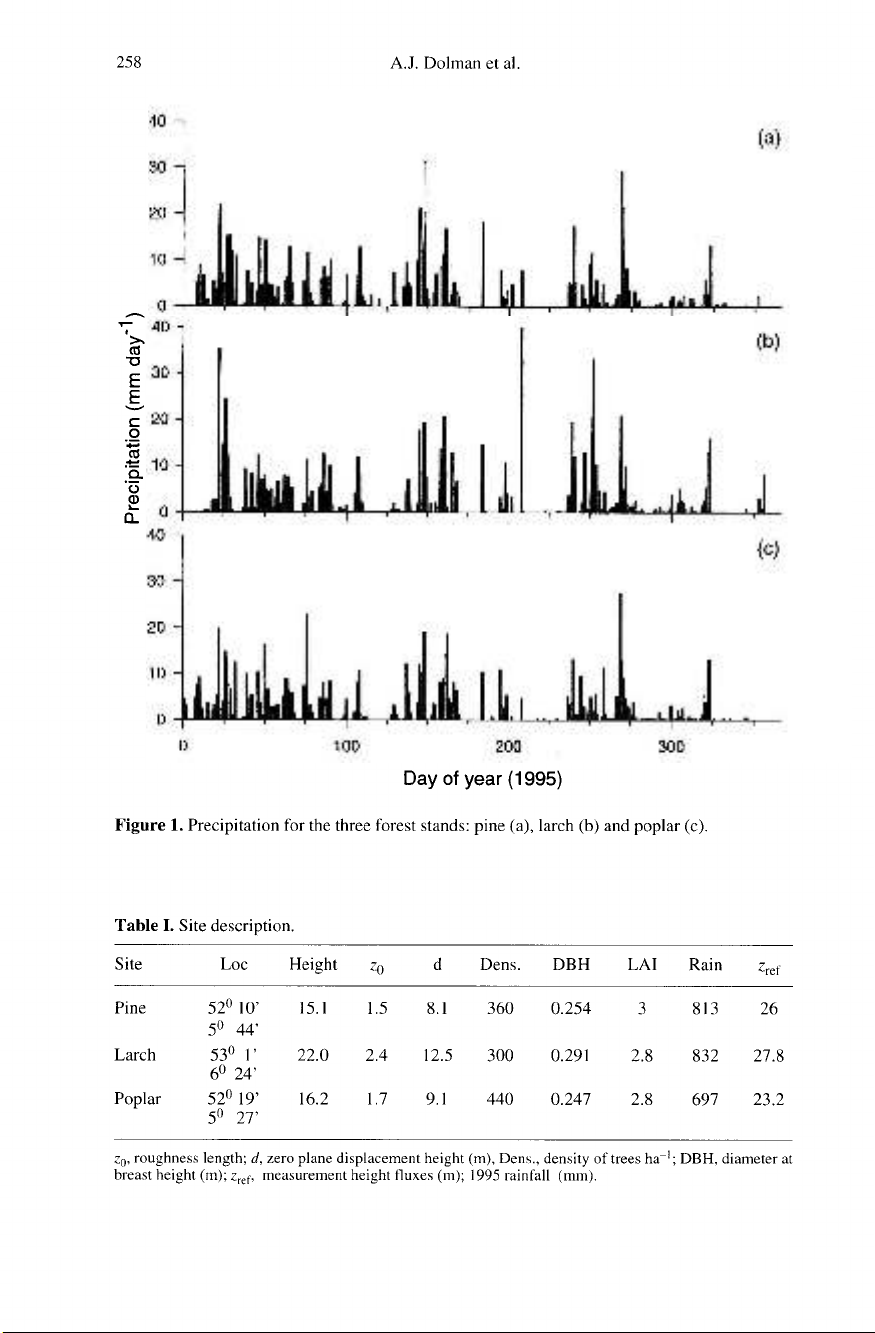
The
sites
are
a
site
of
Scots
pine
on
a
high
sandy
soil
in
the
centre
of
the
Nether-
lands,
a
larch
site
on
a
loamy
soil
in
the
North,
and
a
poplar
site
in
one
of
the
pold-
ers
on
a
heavy
clay
soil
(figure
1).
The
characteristics
of
the
sites
are
given
in
table
I.
The
data
quality
and
methods
are
described
in
Elbers
et
al.
[9]
and
are
only
briefly
summarized
here.
Fluxes
of
latent
and
sensible
heat
and
momentum
were
obtained
by
the
eddy
correlation
method
from
scaffolding
towers
since
early
1995.
Only
data
from
1995
are
shown
in
the
cur-
rent
analysis.
The
system
used
consisted
of
a
3-D
sonic
anemometer
(Solent
1012
R2)
and
a
Krypton
hygrometer
(Campbell,
KH20)
linked
to
a
palm
top
computer
(HP-
200LX)
which
calculated
on-line
vari-
ances
and
co-variances
at
half
hourly
inter-
vals
using
an
moving
average
filter
with
a
time
constant
of
200
s.
An
automatic
weather
station
took
measurements
of
incoming
and
reflected
solar
(Kipp
and
Zonen
CM21)
and
long
wave
(CG1)
radi-
ation,
soil
heat
flux
(TNO-WS
31
and
Hukseflux
SH1),
windspeed
(Vector
A 101 ML),
wind
direction
(W200P)
and
temperature
and
relative
humidity
(Vaisala
HMP35A).
Soil
moisture
was
calculated
from
measurements
of
the
dielectric
con-
stant
of
the
soil
using
frequency
domain
sensors
at
20
Mhz
(IMAG-DLO,
MCM101).
Rainfall
was
measured
above
the
canopy
and
in
the
open
field
with
auto-
mated
tipping
bucket
rain
gauges.
Power
was
supplied
by
a
12
V
battery,
connected
to
a
solar
panel
and
a
wind
generator.
At
all
sites
throughfall
was
measured
by
a
continuously
measuring
throughfall
gauge
and
a
system
of
40
rainfall
gauges
under
the
canopy,
read
weekly.
Surface
conductance
was
obtained
by
inverting
the
Penman-Monteith
equation
[equation
(1)]
using
an
observed r
a
cor-
rected
for
the
difference
in
momentum
and
heat
transport
[33].
The
Penman-Mon-
teith
equation
reads:
where
λE
is
the
latent
heat
flux,
Rn
the
net
radiative
flux,
G
the
soil
heat
flux,
ga
the
aerodynamic
and g
s
the
surface
conduc-
tance,
Δ
the
slope
of
the
saturated
specific
humidity
temperature
curve,
cp
the
spe-
cific
heat
of
air,
p
the
density
of
air,
y the
psychometric
constant
and
δq
the
specific
humidity
deficit.
The
use
of
this
equation
assumes
that
the
source
and
sink
height
of
temperature
and
humidity
are
located
at
the
same
height;
in
the
case
of
an
understorey
the
upper
canopy
and
under
canopy
are
thus
lumped
together
in
a
single
isothermal
layer.
The
surface
conductance
is
in
the
case
of
a
homogeneous
canopy
approxi-
mately
equal
to
the
parallel
sum
of
the
stomatal
conductances
[29].
In
practice
environmental
control
on
canopy
con-
ductance
is
regulated
by
the
behaviour
of
the
guard
cells
in
the
stomata.
At
the
canopy
level
these
controls
are
lumped
together
and
appear
more
smooth
than
when
observed
at
the
leaf
level.
This
explains
the
success
of
canopy
conduc-
tance
models
in
single
leaf
evaporation
models.
3. RESULTS
3.1.
Measurements
and
data
quality
Overall
daily
energy
balance
closure
is
good
[9]
and
is
summarized
in
table
II.
The
recovery
ratios,
defined
as
the
average
energy
balance
closure
for
daylight
hours,
i.e.
the
ratio
of
the
measured
turbulent
fluxes
over
the
sum
of
net
radiation
and
soil
heat
flux,
are
close
to
unity.
Table
II
also
shows
the
difference
in
energy
par-
titioning
between
the
forest
with
the
poplar
stand
converting
most
of
its
available
energy
into
evaporation.
The
reverse
is
true
for the
needle
carrying
forests
which
convert
most
of
their
available
energy
into
sensible
heat.
The
half
hourly
data
used
in this
paper
were
selected
for
dry
days
only
(minimum
2 d
after
the
last
rain),
and
only
those
30
min
values
were
used
for
which
energy
balance
closure
was
better
than
25
%.
The
first
criterion
was
used
to
remove
the
possibility
of
contamination
of
the
transpiration
flux
by
soil
evapora-
tion.
Although
some
soil
evaporation
may
still
occur
after
2
d,
this
is
unlikely
to
be
substantial.
Data
suspicious
of
dew
or
wet
canopy
after
rain
were
also
removed
from
the
analysis.
This
data
screening
resulted
in
a
data
set
which
thus
contained
only
dry
canopy
evaporation
with
minimum
or
no
contamination
by
soil
or
wet
canopy
evaporation.
Note
that
the
word
evapora-


%20--%3e%3cdefs%3e%3cstyle%3e%20.st0%20{%20fill:%20%23fff;%20}%20.st1%20{%20fill:%20%237800fa;%20}%20%3c/style%3e%3c/defs%3e%3cpath%20class='st1'%20d='M117.78,12.18H43.11c2.9,3.47,4.65,7.94,4.65,12.82,0,5.6-2.3,10.66-6.01,14.29h76.02l7.22-13.56-7.22-13.56Z'/%3e%3cg%3e%3cpath%20class='st0'%20d='M53.58,26.17h-.59v-1.46h.59v-4.96h2.83c1.78,0,2.67.94,2.67,2.82v5.76c0,1.87-.89,2.81-2.67,2.81h-2.83v-4.96ZM55.36,21.37v3.34h1.1v1.46h-1.1v3.34h1.01c.61,0,.91-.37.91-1.1v-5.93c0-.74-.3-1.1-.91-1.1h-1.01Z'/%3e%3cpath%20class='st0'%20d='M65.99,31.14h-1.8l-.31-2.07h-2.19l-.31,2.07h-1.64l1.82-11.39h2.62l1.82,11.39ZM65.28,18.04c-.25.46-.51.77-.75.94-.21.15-.47.22-.79.22-.26,0-.57-.07-.92-.22l-.38-.15c-.14-.05-.26-.07-.37-.07-.3,0-.53.18-.71.54l-.91-.68c.25-.46.51-.77.75-.94.21-.14.48-.21.79-.21.26,0,.57.07.92.21l.38.15c.14.05.26.07.37.07.3,0,.53-.18.71-.54l.91.68ZM61.91,27.52h1.73l-.87-5.76-.87,5.76Z'/%3e%3cpath%20class='st0'%20d='M74.53,26.89v1.52c0,1.91-.89,2.86-2.67,2.86s-2.67-.95-2.67-2.86v-5.93c0-1.91.89-2.86,2.67-2.86s2.67.95,2.67,2.86v1.11h-1.69v-1.22c0-.75-.31-1.12-.93-1.12s-.93.37-.93,1.12v6.15c0,.74.31,1.11.93,1.11s.93-.37.93-1.11v-1.63h1.69Z'/%3e%3cpath%20class='st0'%20d='M81.4,31.14h-1.8l-.31-2.07h-2.19l-.31,2.07h-1.64l1.82-11.39h2.62l1.82,11.39ZM75.9,19.2l1.52-1.91h1.71l1.51,1.91h-1.61l-.76-.95-.75.95h-1.61ZM77.32,27.52h1.73l-.87-5.76-.87,5.76ZM83.1,15.99l-1.76,1.91h-1.26l1.17-1.91h1.86Z'/%3e%3cpath%20class='st0'%20d='M84.86,19.75c1.78,0,2.67.94,2.67,2.82v1.48c0,1.87-.89,2.81-2.67,2.81h-.85v4.28h-1.79v-11.39h2.64ZM84.01,21.37v3.86h.85c.58,0,.87-.36.87-1.08v-1.71c0-.71-.29-1.07-.87-1.07h-.85Z'/%3e%3cpath%20class='st0'%20d='M93.51,19.75c1.78,0,2.67.94,2.67,2.82v1.48c0,1.87-.89,2.81-2.67,2.81h-.85v4.28h-1.79v-11.39h2.64ZM92.66,21.37v3.86h.85c.58,0,.87-.36.87-1.08v-1.71c0-.71-.29-1.07-.87-1.07h-.85Z'/%3e%3cpath%20class='st0'%20d='M98.8,31.14h-1.79v-11.39h1.79v4.88h2.03v-4.88h1.83v11.39h-1.83v-4.88h-2.03v4.88Z'/%3e%3cpath%20class='st0'%20d='M105.36,24.55h2.46v1.62h-2.46v3.34h3.09v1.63h-4.88v-11.39h4.88v1.63h-3.09v3.18ZM108.17,17.29l-1.76,1.91h-1.26l1.17-1.91h1.86Z'/%3e%3cpath%20class='st0'%20d='M112.2,19.75c1.78,0,2.67.94,2.67,2.82v1.48c0,1.87-.89,2.81-2.67,2.81h-.85v4.28h-1.79v-11.39h2.64ZM111.35,21.37v3.86h.85c.58,0,.87-.36.87-1.08v-1.71c0-.71-.29-1.07-.87-1.07h-.85Z'/%3e%3c/g%3e%3ccircle%20class='st1'%20cx='25'%20cy='25'%20r='20'/%3e%3cpath%20class='st0'%20d='M32.78,19.27c2.92,0,4.43,2.55,5.28,5.33l.71,2.17c.14.38-.33.75-.71.75h-5.61c.19-.33.24-.71.09-1.08l-.75-2.45c-.43-1.32-.99-2.64-1.79-3.77.75-.57,1.65-.94,2.78-.94h0ZM25,18.38c3.25,0,4.9,2.78,5.89,5.89l.76,2.45c.14.42-.33.8-.8.8h-11.69c-.42,0-.94-.38-.8-.8l.75-2.45c.99-3.11,2.64-5.89,5.89-5.89h0ZM25,11.35c1.74,0,3.11,1.37,3.11,3.11s-1.37,3.11-3.11,3.11-3.11-1.41-3.11-3.11,1.41-3.11,3.11-3.11h0ZM17.27,19.27c1.08,0,1.98.38,2.73.94-.8,1.13-1.37,2.45-1.74,3.77l-.8,2.45c-.14.38-.05.75.09,1.08h-5.56c-.42,0-.9-.38-.75-.75l.71-2.17c.9-2.78,2.41-5.33,5.33-5.33h0ZM17.27,12.91c1.51,0,2.78,1.27,2.78,2.83s-1.27,2.83-2.78,2.83-2.83-1.27-2.83-2.83,1.27-2.83,2.83-2.83h0ZM32.78,12.91c1.56,0,2.78,1.27,2.78,2.83s-1.23,2.83-2.78,2.83-2.83-1.27-2.83-2.83,1.27-2.83,2.83-2.83h0ZM27.07,28.56v.09c0,.57-.24,1.08-.61,1.46h0v.05c-.38.33-.9.57-1.46.57s-1.08-.24-1.46-.61h0c-.38-.38-.61-.9-.61-1.46v-.09h1.41v.09c0,.19.05.38.19.47v.05c.09.09.28.19.47.19s.38-.09.47-.19v-.05c.14-.09.24-.28.24-.47t-.05-.09h1.41ZM30.99,28.56v.09c0,1.65-.66,3.16-1.74,4.24-1.08,1.08-2.59,1.79-4.24,1.79s-3.16-.71-4.24-1.79l-.05-.05c-1.04-1.08-1.7-2.55-1.7-4.2v-.09h1.41v.09c0,1.27.47,2.4,1.27,3.25h.05c.85.85,1.98,1.37,3.25,1.37s2.4-.52,3.25-1.37c.85-.8,1.37-1.98,1.37-3.25v-.09h1.37ZM34.99,28.56v.09c0,2.78-1.13,5.28-2.92,7.07-1.79,1.79-4.29,2.92-7.07,2.92s-5.23-1.13-7.07-2.92c-1.79-1.79-2.92-4.29-2.92-7.07v-.09h1.41v.09c0,2.4.94,4.53,2.5,6.08,1.56,1.56,3.72,2.5,6.08,2.5s4.52-.94,6.08-2.5c1.56-1.56,2.5-3.68,2.5-6.08v-.09h1.41Z'/%3e%3c/svg%3e)