Available online at www.sciencedirect.com
Procedia Engineering 38 ( 2012 ) 3941 – 3950
International Conference on Modelling, Optimization and Computing (ICMOC - 2012) The Optimization of the Electro-Discharge Machining Process Using Response Surface Methodology and Genetic Algorithms R.Rajesha and M. Dev Anandb aAssistant Professor bProfessor & Deputy Director Academic Affairs, Department of Mechanical Engineering, Noorul Islam Centre for Higher Education,Kumaracoil - 629180 Kanyakumari District, Tamilnadu, India
Abstract Electric Discharge Machining (EDM) is a thermo-electric non-traditional machining process in which material removal takes place through the process of controlled spark generation between a pair of electrodes which are submerged in a dielectric medium. Due to the difficulty of EDM, it is very complicated to determine optimal cutting parameters for improving cutting performance. So, optimization of operating parameters is an important action in machining, particularly for unconventional electrical type machining procedures like EDM. A proper selection of machining parameters for the EDM process
Open access under CC BY-NC-ND license.
Since for an arbitrary desired machining time for a particular job, they do not provide the optimal conditions. To solve this task, multiple regression model and modified Genetic Algorithm model are developed as efficient approaches to determine the optimal machining parameters in electric discharge machine. In this paper, working current, working voltage, oil pressure, spark gap Pulse On Time and Pulse Off Time on Material Removal Rate (MRR) and Surface Finish (Ra) has been studied. Empirical models for MRR and Ra have been developed by conducting a designed experiment based on the Grey Relational Analysis. Genetic Algorithm (GA) based multi-objective optimization for maximization of MRR and minimization of Ra has been done by using the developed empirical models. Optimization results have been used for identifying the machining conditions. For verification of the empirical models and the optimization results, focused experiments have been conducted in the rough and finish machining regions. © 2012 Published by Elsevier Ltd. Selection and/or peer-review under responsibility of Noorul Islam Centre for Higher Education Keywords: Electro Discharge Machining, Grey Relational Analysis, Genetic Algorithm, Regression Model, Taguchi Method.
E-mail ID : rajesh200345@yahoo.co.in
Contact No : +91 9488882073
Open access under CC BY-NC-ND license.
1877-7058 © 2012 Published by Elsevier Ltd. doi: 10.1016/j.proeng.2012.06.451
R. Rajesh and M. Dev Anand / Procedia Engineering 38 ( 2012 ) 3941 – 3950
3942
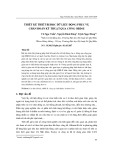
1. INTRODUCTION Electric Discharge Machining (EDM) is now a well known process particularly used in precise machining for complex shaped work pieces, as an alternative to more traditional approaches. EDM is a thermal erosion process in which an electrically generated spark vaporizes electrically conductive material. EDM is one of the most extensively used non-conventional material removal processes [2]. Both electrode (tool) and workpiece must be electrically conductive [3]. The spark occurs in a gap filled with dielectric solution between the tool and workpiece. The process removes metal via electrical and thermal energy, having no mechanical contact with the workpiece [4]. Its unique feature of using thermal energy is to machine electrically conductive parts regardless of their hardness; its distinctive advantage is in the manufacture of mould, die, automotive, aerospace and other applications. In addition, EDM does not make direct contact between the electrode and the workpiece, eliminating mechanical stresses, chatter and vibration problems during machining [2]. Today, an electrode is as small as 0.1mm can be used to make hole into curved surface s at steep angles without drill [2]. The spark is generated due to a gap between the workpiece and a tool. The smaller the spark gap better the accuracy and the slower the MRR [1]. Figure 1 shows the classification of the spark erosion machining processes [5].
Figure 1: Classification of the Spark Erosion Machining Processes.
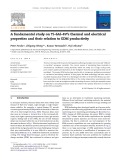
2. LITERATURE SURVEY Different researchers did various investigations about EDM. The results were summarizes as follows: Ho and Newman (2003) [2] studied the research work carried out from the inception to the development of die-sinking EDM. They reported on the EDM arch related to improving performance measures, optimizing the process variables, monitoring and control the sparking processes, simplifying the electrode design and manufacture. Figure 2 presents the classification of the various research areas and possible future research directions. Margaret (2004) [4] showed the analysis of the various inputs into EDM and the resulting outputs into the environment. A simplified model is used to analyze the process; the main categories of flow in the
R. Rajesh and M. Dev Anand / Procedia Engineering 38 ( 2012 ) 3941 – 3950
3943
model are material and energy flow. It was concluded that the materials which were machined by EDM have no effect on the environment.
Figure 2: Classification of Major EDM Research Areas.
3. EXPERIMENT BASED ON THE TAGUCHI METHOD The working ranges of the parameters for subsequent design of experiment, based on 32 Orthogonal Array (OA) design have been selected. In the present experimental study, Working Voltage, Working Current, Oil Pressure, Pulse On Time, Pulse Off Time and Spark Gap have been considered as process variables. MRR is calculated by measuring the time of machining. It is calculated by using the formula
MRR=
Where,
D - Diameter of the Hole d - Diameter of the Electrode 3.1. Technical Data
Type : PSR-35 Supply Voltage : 415 V, 3 Ph.,50 Hz Taps : 380 V, 415 V, 440 V Power factor : 0.8 approx Height : 2075mm Width : 1230mm Depth : 1035mm Net Weight : 800Kg (Approx)
3.2. Co-ordinate Table : 500*300mm Mounting Surface (l*b) Maximum Work Piece Height : 175mm
R. Rajesh and M. Dev Anand / Procedia Engineering 38 ( 2012 ) 3941 – 3950
3944
Maximum work Piece Weight : 175kg Longitudinal Travel (X-axis) : 280mm Transverse Travel (Y-axis) : 200mm L.C. of hand Wheel Graduations with Vernier scale : 0.005mm Width of Work Tank Depth of Work Tank Height of Work Tank Internal : 725mm Internal : 415mm : 315mm 3.3. Electrode
Material : Electrolytic Copper (Graphite Grade EDM 1) Size : A cylindrical Shape with 10mm Diameter Dielectric Fluid Clean Kerosene
Figure 3: Experimental Setup. Composition of Al Alloy with Grade HE9
Element 6063 Si Fe Cu Mn Mg Zn Ti Cr Al % Present 0.2 to 0.6 0.35 Max 0.1 Max 0.1 Max 0.45 to 0.9 0.1 Max 0.1 Max 0.1 Max Balance
R. Rajesh and M. Dev Anand / Procedia Engineering 38 ( 2012 ) 3941 – 3950
3945
4. GREY RELATIONAL ANALYSIS Grey Relational Analyses are applied to determine the suitable selection of machining parameters for Electrical Discharge Machining (EDM) process. The Grey theory can provide a solution of a system in which the model is unsure or the information is incomplete. Besides, it provides an efficient solution to the uncertainty, multi-input and discrete data problem. According to the Taguchi quality design concept, a L32 mixed- orthogonal-array table was chosen for the experiments. With both Grey relational analysis and statistical method, it is found that the table-feed rate has a significant influence on the machining speed, whilst the gap width and the surface roughness are mainly influenced by pulse-on time. Moreover, the optimal machining parameters setting for maximum machining speed and minimum surface roughness (or a desired surface roughness) can be obtained. The relationship between various factors mentioned in the prev incomplete and uncertain information. Their analysis by standard statistical procedure may not be acceptable or reliable without large data sets. In this work, Grey Relational Analysis (GRA) has been used to convert the multi-response optimization model into a single response grey relational grade. Instead of using experimental values directly in multiple regression model and GA, grades are used to study about multi-response characteristics. 4.1. Steps in GRA: The following steps to be followed while applying grey relational analysis to find the Grey relational coefficients and the grey relational grade: (a) Normalizing the experimental results of MRR and surface roughness to avoid the effect of adopting different units to reduce the variability. (1) Zij=
(2) Zij=
(b) Performing the grey relational generating and calculating the grey. Co-efficient for the normalized values yield. (3)
Where,
j=1, 2...n; k=1, 2...m, n is the number of experimental data items and m is the number of responses. y0(k) is the reference sequence (yo(k)=1, k=1, 2...m); yj(k) is the specific
comparison sequence. - ce between y0(k) and yj(k). -
R. Rajesh and M. Dev Anand / Procedia Engineering 38 ( 2012 ) 3941 – 3950
3946
-
value may adjusted based on the practical needs of the system). (c) Calculating the grey relational grade by averaging the grey relational coefficient yields: (4)
j is the grey relational grade for the jth experiment and k is the number of Where performance characteristics. Equation (1) is used to normalize the experimental value
characteristic of the original sequence, then the original sequence is normalized using Equation (2), i.e., surface roughness is normalized using this equation. Using Equation (3), we calculate the grey relational coefficient for MRR and SR as Shown in Table 2. Also the grey relational grade is computed as per Equation (4). 5. MATHEMATICAL MODELLING 5.1 MULTIPLE REGRESSION MODEL Multiple regression methods are used to analyze data from unplanned experiments, such as might arise from observation of uncontrolled phenomena or historical data. Regression methods are also very useful in designed experiments where something has
relationship between several independent or predictor variables and a dependent or criterion variable. The following models have been developed to analyze the process variable in EDM process. Model I: Linear model excluding interaction terms. This model is a linear multiple regression model without considering interaction terms. A multiple regression model using independent variables C, V, F and G and dependent variable grade can be represented as
Where, b0, b1, b2, b3 and b4 are the regression coefficients to be estimated.
A - Working Voltage B - Working Current C - Oil Pressure D - The regression model developed using MINITAB software based on the data in Table 3 as: Grade=0.445+0.00257A+0.0007B+0.00699C-0.00238D-0.0125E+0.061F The other equations which relate the material removal rate and surface roughness are given below. MRR = 4.00-0.0003A+ 0.0429B+0.0401C+0.0118D-0.319E- 1.28 F SR = 3.88- 0.0033A+ 0.0307B - 0.0093C + 0.0170D- 0.102E- 0.689F Where, Pulse on Time E - Pulse Off Time F - Spark Gap
R. Rajesh and M. Dev Anand / Procedia Engineering 38 ( 2012 ) 3941 – 3950
3947
6. SIMULATION Table1: Process Variables and Their Corresponding Responses
Sl. N o. Spark Gap (mm) Surface Roughness ((cid:151)m) Pulse On Time (sec) Pulse Off Time (sec) Material Removal Rate (mg/min)
Worki ng Voltag e (V) 75 65 60 55 65 75 55 60 60 55 75 65 55 60 65 75 75 65 60 55 65 75 55 60 60 55 75 65 55 60 65 75 Oil Pressu re (kg/cm 2) 1 3 5 7 1 3 5 7 1 3 5 7 1 3 5 7 1 3 5 7 1 3 5 7 1 3 5 7 1 3 5 7 Worki ng Curren t (A) 5 5 5 5 10 10 10 10 15 15 15 15 20 20 20 20 5 5 5 5 10 10 10 10 15 15 15 15 20 20 20 20 15 25 35 45 15 25 35 45 25 15 45 35 25 15 45 35 45 35 25 15 45 35 25 15 35 45 15 25 35 45 15 25 9 9 9 9 9 9 9 9 9 9 9 9 9 9 9 9 5 5 5 5 5 5 5 5 5 5 5 5 5 5 5 5 0.1 0.2 0.3 0.4 0.2 0.1 0.4 0.3 0.4 0.3 0.2 0.1 0.3 0.4 0.1 0.2 0.4 0.3 0.2 0.1 0.3 0.4 0.1 0.2 0.1 0.2 0.3 0.4 0.2 0.3 0.1 0.4 1.134 1.400 1.458 1.377 1.571 1.620 1.701 1.766 1.895 1.863 1. 936 1.976 2.187 2.284 2.576 2.511 2.786 3.052 2.349 2.608 3.050 3.013 3.645 4.098 3.726 3.208 2.414 3.515 3.402 3.304 0.438 5.135 2.5 2.6 3.3 3.1 3.5 3.2 3.0 2.8 3.5 3.5 2.8 3.8 3.8 4.2 4.0 4.3 4.4 4.6 3.2 4.0 3.9 3.8 3.8 4.2 4.1 4.2 2.3 3.8 4 4.2 2.2 4.8
Grade
Normalized Values for 0.1481 0.2048 0.2172 0.1999 Normalized Values for SR 0.88 0.84 0.58 0.65 GRC Values for MRR 0.3698 0.3860 0.3899 0.3845 GRC Values for 0.8061 0.7576 0.5434 0.5882 0.5879 0.5718 0.4667 0.4863 1. 2. 3. 4. 5. 6. 7. 8. 9. 10 11 12 13 14 15 16 17 18 19 20 21 22 23 24 25 26 27 28 29 30 31 32 Table2: Grey Relational Grade Sl. No. 1. 2. 3. 4.
R. Rajesh and M. Dev Anand / Procedia Engineering 38 ( 2012 ) 3941 – 3950
3948
0.2412 0.2516 0.2689 0.2827 0.3102 0.3034 0.3189 0.3274 0.3724 0.3930 0.4552 0.4413 0.4998 0.5565 0.4068 0.4619 0.5561 0.5482 0.6828 0.7792 0.7000 0.5897 0.4207 0.6550 0.6310 0.6101 0 1 0.50 0.62 0.69 0.77 0.50 0.50 0.38 0.38 0.38 0.23 0.31 0.20 0.15 0.10 0.62 0.31 0.35 0.38 0.38 0.23 0.27 0.23 1 0.38 0.31 0.23 1 0 0.3972 0.4005 0.4061 0.4107 0.4202 0.4178 0.4233 0.4264 0.4434 0.4517 0.4786 0.4723 0.4999 0.5299 0.4574 0.4816 0.5297 0.5253 0.6118 0.6937 0.6250 0.5493 0.4632 0.5917 0.5754 0.5619 0.3333 1 0.5000 0.5681 0.6173 0.6849 0.5000 0.5000 0.4462 0.4462 0.4462 0.3937 0.4202 0.3846 0.3703 0.3571 0.5682 0.4202 0.4348 0.4462 0.4462 0.3937 0.4065 0.3937 1 0.4462 0.4202 0.3937 1 0.3333 0.4486 0.4843 0.5117 0.5478 0.4601 0.4589 0.4348 0.4363 0.4448 0.4227 0.4494 0.4285 0.4351 0.4435 0.5128 0.4509 0.4822 0.4857 0.5290 0.5437 0.5157 0.4715 0.7316 0.5189 0.4978 0.4778 0.6667 0.6667 5. 6. 7. 8. 9. 10. 11. 12. 13. 14. 15. 16. 17. 18. 19. 20. 21. 22. 23. 24. 25. 26. 27. 28. 29. 30. 31. 32.
Table3: Process Variables and Their Limits
Values in Coded Form Working Voltage (V) Working Current (A) Oil Pressure (Kg/cm²) Pulse ON Time (sec) Spark Gap (mm)
1 2 3 4 75 65 60 55 5 10 15 20 Pulse OFF Time (sec) 9 5 - - 0.1 0.2 0.3 0.4 1 3 5 7 15 25 35 45
Table 4: Orthogonal Array of 32 Experiments and Corresponding Ra Values
Sl. No. Spark Gap Working Voltage (V) Working Current (A) Oil Pressure (kg/cm2) Surface Roughness ((cid:151)m)
1 2 3 4 2 1 1 1 1 2 1 2 3 4 1 1 2 3 4 2 2.5 2.6 3.3 3.1 3.5 Pulse On Time (sec) 1 2 3 4 1 Pulse Off Time (sec) 9 9 9 9 9 1. 2. 3. 4. 5.
R. Rajesh and M. Dev Anand / Procedia Engineering 38 ( 2012 ) 3941 – 3950
3949
2 3 4 2 1 4 3 2 1 4 3 4 3 2 1 4 3 2 1 3 4 1 2 3 4 1 2 2 2 2 3 3 3 3 4 4 4 4 1 1 1 1 2 2 2 2 3 3 3 3 4 4 4 4 1 4 3 4 3 2 1 3 4 1 2 4 3 2 1 3 4 1 2 1 2 3 4 2 3 1 4 1 4 3 3 4 1 2 4 3 2 1 1 2 3 4 2 1 4 3 3 4 1 2 4 3 2 1 9 9 9 9 9 9 9 9 9 9 9 5 5 5 5 5 5 5 5 5 5 5 5 5 5 5 5 2 3 4 1 2 3 4 1 2 3 4 1 2 3 4 1 2 3 4 1 2 3 4 1 2 3 4 3.2 3.0 2.8 3.5 3.5 3.8 3.8 3.8 4.2 4.0 4.3 4.4 4.6 3.2 4.0 3.9 3.8 3.8 4.2 4.1 4.2 2.3 3.8 4 4.2 2.2 4.8
6. 7. 8. 9. 10. 11. 12. 13. 14. 15. 16. 17. 18. 19. 20. 21. 22. 23. 24. 25. 26. 27. 28. 29. 30. 31. 32. 7. GENETIC ALGORITHM The genetic algorithm is a probabilistic search algorithm that iteratively transforms a set (called a population) of mathematical objects (typically fixed-length binary character strings), each with an associated fitness value, into a new population of offspring objects, details are in [5]. Experimental value and Predicted value are analyzed by Genetic Algorithm through Crossover technique and the optimized value are given in the table. Result Obtained in Genetic Algorithm
Spark Gap (mm) Worki ng Voltage (V) Pulse ON Time (sec) Pulse OFF Time (sec) Material Removal Rate (mg/min) Surface Roughne ss ((cid:151)m)
Worki ng Curren t (A) 3 1 1 4 Oil Pressu re (Kg/cm ²) 1 2 6 2 78 57 65 76 1 2 7 6 8 8 8 7 0.35 0.17 0.20 0.30 1.161 1.360 1.532 1.683 2.686 2.842 2.914 2.952
R. Rajesh and M. Dev Anand / Procedia Engineering 38 ( 2012 ) 3941 – 3950
3950
1 1 to 35 Amps Oil Pressure 40 to 80 V Working Current
0.04 to 1 to 9 sec Spark Gap 1 to 100 sec Pulse OFF Time
8. RESULT AND DISCUSSION The particles considered for optimization are working voltage, working current, oil pressure, pulse on time, pulse off time, spark gap. Here the objective function is to minimize the Surface Roughness (Ra) and increase the material removal rate. The boundary conditions for the decision variables working voltage ,working current , oil pressure, pulse on time , pulse off time, spark gap are as follows: Working Voltage to 15 kg/cm Pulse ON Time 0.5 9. CONCLUSION This paper presents a new approach to the machining problems based on the Genetic Algorithm. A practical method of optimizing cutting parameters for EDM based on multiple regression models and GA are presented in this paper. Current, Voltage, Flow Rate, Pulse ON, Pulse OFF and Gap have been considered as machining parameters. Metal removal rate and surface roughness have been obtained as responses from the EDM process. Metal removal rate and surface roughness are combined to have a single objective as grey relational grade by the application of grey relational analysis. Linear regression model have been developed to map the relationship between machining parameters and output responses. Finally the optimal conditions obtained by GA as. i.e., current at 3 A, voltage at 78 V, gap at 0.35, flow rate at 1, pulse ON as 1 and pulse OFF as 8 for maximizing MRR and minimize the surface roughness simultaneously among the experimental data. The most influencing factor obtained by the response table is the working current for the EDM process. 10. References 1) Ho, K., H., and Newman, S., T., State of the Art Electrical Discharge Machining (EDM), International Journal of Machine Tools and Manufacture, Volume 43, pp. 1287-1300, 2003.
![PFR96/PFR96P: Tư vấn chọn mua [nếu là sản phẩm] / Hướng dẫn sử dụng [nếu là hướng dẫn] chi tiết](https://cdn.tailieu.vn/images/document/thumbnail/2017/20170331/mrcuongchip/135x160/7801490925524.jpg)


![Cẩm nang Gia công kim loại Việt Nam [mới nhất]](https://cdn.tailieu.vn/images/document/thumbnail/2026/20260513/baobinh_011/135x160/7971778670576.jpg)


![Giáo trình Hàn ống nâng cao (Nghề Hàn - CĐ) Trường Cao đẳng nghề Hải Dương [Mới nhất]](https://cdn.tailieu.vn/images/document/thumbnail/2025/20251212/laphong0906/135x160/47521779076565.jpg)


%20--%3e%3cdefs%3e%3cstyle%3e%20.st0%20{%20fill:%20%23fff;%20}%20.st1%20{%20fill:%20%237800fa;%20}%20%3c/style%3e%3c/defs%3e%3cpath%20class='st1'%20d='M117.78,12.18H43.11c2.9,3.47,4.65,7.94,4.65,12.82,0,5.6-2.3,10.66-6.01,14.29h76.02l7.22-13.56-7.22-13.56Z'/%3e%3cg%3e%3cpath%20class='st0'%20d='M53.58,26.17h-.59v-1.46h.59v-4.96h2.83c1.78,0,2.67.94,2.67,2.82v5.76c0,1.87-.89,2.81-2.67,2.81h-2.83v-4.96ZM55.36,21.37v3.34h1.1v1.46h-1.1v3.34h1.01c.61,0,.91-.37.91-1.1v-5.93c0-.74-.3-1.1-.91-1.1h-1.01Z'/%3e%3cpath%20class='st0'%20d='M65.99,31.14h-1.8l-.31-2.07h-2.19l-.31,2.07h-1.64l1.82-11.39h2.62l1.82,11.39ZM65.28,18.04c-.25.46-.51.77-.75.94-.21.15-.47.22-.79.22-.26,0-.57-.07-.92-.22l-.38-.15c-.14-.05-.26-.07-.37-.07-.3,0-.53.18-.71.54l-.91-.68c.25-.46.51-.77.75-.94.21-.14.48-.21.79-.21.26,0,.57.07.92.21l.38.15c.14.05.26.07.37.07.3,0,.53-.18.71-.54l.91.68ZM61.91,27.52h1.73l-.87-5.76-.87,5.76Z'/%3e%3cpath%20class='st0'%20d='M74.53,26.89v1.52c0,1.91-.89,2.86-2.67,2.86s-2.67-.95-2.67-2.86v-5.93c0-1.91.89-2.86,2.67-2.86s2.67.95,2.67,2.86v1.11h-1.69v-1.22c0-.75-.31-1.12-.93-1.12s-.93.37-.93,1.12v6.15c0,.74.31,1.11.93,1.11s.93-.37.93-1.11v-1.63h1.69Z'/%3e%3cpath%20class='st0'%20d='M81.4,31.14h-1.8l-.31-2.07h-2.19l-.31,2.07h-1.64l1.82-11.39h2.62l1.82,11.39ZM75.9,19.2l1.52-1.91h1.71l1.51,1.91h-1.61l-.76-.95-.75.95h-1.61ZM77.32,27.52h1.73l-.87-5.76-.87,5.76ZM83.1,15.99l-1.76,1.91h-1.26l1.17-1.91h1.86Z'/%3e%3cpath%20class='st0'%20d='M84.86,19.75c1.78,0,2.67.94,2.67,2.82v1.48c0,1.87-.89,2.81-2.67,2.81h-.85v4.28h-1.79v-11.39h2.64ZM84.01,21.37v3.86h.85c.58,0,.87-.36.87-1.08v-1.71c0-.71-.29-1.07-.87-1.07h-.85Z'/%3e%3cpath%20class='st0'%20d='M93.51,19.75c1.78,0,2.67.94,2.67,2.82v1.48c0,1.87-.89,2.81-2.67,2.81h-.85v4.28h-1.79v-11.39h2.64ZM92.66,21.37v3.86h.85c.58,0,.87-.36.87-1.08v-1.71c0-.71-.29-1.07-.87-1.07h-.85Z'/%3e%3cpath%20class='st0'%20d='M98.8,31.14h-1.79v-11.39h1.79v4.88h2.03v-4.88h1.83v11.39h-1.83v-4.88h-2.03v4.88Z'/%3e%3cpath%20class='st0'%20d='M105.36,24.55h2.46v1.62h-2.46v3.34h3.09v1.63h-4.88v-11.39h4.88v1.63h-3.09v3.18ZM108.17,17.29l-1.76,1.91h-1.26l1.17-1.91h1.86Z'/%3e%3cpath%20class='st0'%20d='M112.2,19.75c1.78,0,2.67.94,2.67,2.82v1.48c0,1.87-.89,2.81-2.67,2.81h-.85v4.28h-1.79v-11.39h2.64ZM111.35,21.37v3.86h.85c.58,0,.87-.36.87-1.08v-1.71c0-.71-.29-1.07-.87-1.07h-.85Z'/%3e%3c/g%3e%3ccircle%20class='st1'%20cx='25'%20cy='25'%20r='20'/%3e%3cpath%20class='st0'%20d='M32.78,19.27c2.92,0,4.43,2.55,5.28,5.33l.71,2.17c.14.38-.33.75-.71.75h-5.61c.19-.33.24-.71.09-1.08l-.75-2.45c-.43-1.32-.99-2.64-1.79-3.77.75-.57,1.65-.94,2.78-.94h0ZM25,18.38c3.25,0,4.9,2.78,5.89,5.89l.76,2.45c.14.42-.33.8-.8.8h-11.69c-.42,0-.94-.38-.8-.8l.75-2.45c.99-3.11,2.64-5.89,5.89-5.89h0ZM25,11.35c1.74,0,3.11,1.37,3.11,3.11s-1.37,3.11-3.11,3.11-3.11-1.41-3.11-3.11,1.41-3.11,3.11-3.11h0ZM17.27,19.27c1.08,0,1.98.38,2.73.94-.8,1.13-1.37,2.45-1.74,3.77l-.8,2.45c-.14.38-.05.75.09,1.08h-5.56c-.42,0-.9-.38-.75-.75l.71-2.17c.9-2.78,2.41-5.33,5.33-5.33h0ZM17.27,12.91c1.51,0,2.78,1.27,2.78,2.83s-1.27,2.83-2.78,2.83-2.83-1.27-2.83-2.83,1.27-2.83,2.83-2.83h0ZM32.78,12.91c1.56,0,2.78,1.27,2.78,2.83s-1.23,2.83-2.78,2.83-2.83-1.27-2.83-2.83,1.27-2.83,2.83-2.83h0ZM27.07,28.56v.09c0,.57-.24,1.08-.61,1.46h0v.05c-.38.33-.9.57-1.46.57s-1.08-.24-1.46-.61h0c-.38-.38-.61-.9-.61-1.46v-.09h1.41v.09c0,.19.05.38.19.47v.05c.09.09.28.19.47.19s.38-.09.47-.19v-.05c.14-.09.24-.28.24-.47t-.05-.09h1.41ZM30.99,28.56v.09c0,1.65-.66,3.16-1.74,4.24-1.08,1.08-2.59,1.79-4.24,1.79s-3.16-.71-4.24-1.79l-.05-.05c-1.04-1.08-1.7-2.55-1.7-4.2v-.09h1.41v.09c0,1.27.47,2.4,1.27,3.25h.05c.85.85,1.98,1.37,3.25,1.37s2.4-.52,3.25-1.37c.85-.8,1.37-1.98,1.37-3.25v-.09h1.37ZM34.99,28.56v.09c0,2.78-1.13,5.28-2.92,7.07-1.79,1.79-4.29,2.92-7.07,2.92s-5.23-1.13-7.07-2.92c-1.79-1.79-2.92-4.29-2.92-7.07v-.09h1.41v.09c0,2.4.94,4.53,2.5,6.08,1.56,1.56,3.72,2.5,6.08,2.5s4.52-.94,6.08-2.5c1.56-1.56,2.5-3.68,2.5-6.08v-.09h1.41Z'/%3e%3c/svg%3e)