
RESEARCH Open Access
Bringing order to protein disorder through
comparative genomics and genetic interactions
Jeremy Bellay
1†
, Sangjo Han
2,3†
, Magali Michaut
2,3†
, TaeHyung Kim
2,3
, Michael Costanzo
2,3
, Brenda J Andrews
2,3,4
,
Charles Boone
2,3,4
, Gary D Bader
2,3,4,5
, Chad L Myers
1*
and Philip M Kim
2,3,4,5*
Abstract
Background: Intrinsically disordered regions are widespread, especially in proteomes of higher eukaryotes.
Recently, protein disorder has been associated with a wide variety of cellular processes and has been implicated in
several human diseases. Despite its apparent functional importance, the sheer range of different roles played by
protein disorder often makes its exact contribution difficult to interpret.
Results: We attempt to better understand the different roles of disorder using a novel analysis that leverages both
comparative genomics and genetic interactions. Strikingly, we find that disorder can be partitioned into three
biologically distinct phenomena: regions where disorder is conserved but with quickly evolving amino acid
sequences (flexible disorder); regions of conserved disorder with also highly conserved amino acid sequences
(constrained disorder); and, lastly, non-conserved disorder. Flexible disorder bears many of the characteristics
commonly attributed to disorder and is associated with signaling pathways and multi-functionality. Conversely,
constrained disorder has markedly different functional attributes and is involved in RNA binding and protein
chaperones. Finally, non-conserved disorder lacks clear functional hallmarks based on our analysis.
Conclusions: Our new perspective on protein disorder clarifies a variety of previous results by putting them into a
systematic framework. Moreover, the clear and distinct functional association of flexible and constrained disorder
will allow for new approaches and more specific algorithms for disorder detection in a functional context. Finally,
in flexible disordered regions, we demonstrate clear evolutionary selection of protein disorder with little selection
on primary structure, which has important implications for sequence-based studies of protein structure and
evolution.
Background
Many proteins include extended regions that do not fold
into a native fixed conformation. These are referred to
as being intrinsically unstructured or disordered. A pos-
sible utility of such regions was first suggested over 70
years ago by Linus Pauling, who speculated that their
flexibility aids in antibody creation [1]. Recent advances
in computational prediction of disordered regions in
amino acid sequences have greatly expanded our aware-
ness of the widespread occurrence of disordered regions
and the number of proteins whose structure is
dominated by such regions (intrinsically disordered pro-
teins or IDPs). Interestingly, protein disorder is more
prevalent in complex organisms, accounting for 33% of
the residues in the human proteome, but only a few per-
cent of residues in Escherichia coli, suggesting it may
play a major role in the evolution of complexity [2].
Protein disorder is a diverse and complex phenom-
enon. On a biophysical level, there exists a continuum
of structure and disorder in the proteome. At one
extreme, there are proteins that are almost entirely
unstructured and nativelyformacoil;somemayfold
upon binding a ligand, and thereby undergoing a disor-
der to structure transition. Other proteins that are
structurally more constrained, but still considered disor-
dered, adopt a molten globule conformation [3]. Highly
structured proteins, which conform to the classical
model of protein structure, occupy the other extreme
* Correspondence: cmyers@cs.umn.edu; pm.kim@utoronto.ca
†Contributed equally
1
Department of Computer Science and Engineering, University of Minnesota,
200 Union Street SE, Minneapolis, MN 55455, USA
2
The Donnelly Centre, University of Toronto, 160 College Street, Toronto, ON
M5S 3E1, Canada
Full list of author information is available at the end of the article
Bellay et al.Genome Biology 2011, 12:R14
http://genomebiology.com/2011/12/2/R14
© 2011 Bellay et al.; licensee BioMed Central Ltd. This is an open access article distributed under the terms of the Creative Commons
Attribution License (http://creativecommons.org/licenses/by/2.0), which permits unrestricted use, distribution, and reproduction in
any medium, provided the original work is properly cited.

on this spectrum, but even they often possess locally dis-
ordered regions [3]. On a functional level, there are
numerous and varied roles with which IDPs have been
associated, including signaling, cellular regulation,
nuclear localization, chaperone activity, RNA and DNA
binding, protein binding and dosage sensitivity [4,5], anti-
body creation [6], and splicing [7]. Also, IDPs have been
implicated in a variety of diseases, including cancer [8],
and neurodegenerative and cardiovascular diseases [6].
While the importance and widespread occurrence of
IDPs is undisputed, a mechanistic understanding of the
specific structural and functional roles of disorder is still
lacking. Here, we systematically analyze and structure
the different functions of disorder through the use of
genetic interactions (GIs) and comparative genomics.
We use two different, but related, concepts to partition
disordered regions into three categories. Our analysis
partitions what is currently only generally characterized
as ‘disorder’into several fundamentally different phe-
nomena with distinct properties and functions.
Results
Genetic interaction hubs tend to have more disordered
residues
Despite the apparent importance of disorder in mediat-
ing important protein functions [4], our knowledge is
still limited in terms of its specific functional roles. The
yeast GI network offers a new opportunity for global
insights into the role of disorder in protein function [9].
Briefly, GIs are defined as pairs of genes whose com-
bined mutation or deletion leads to an unexpected dou-
ble mutant phenotype. Here we limit our attention to
negative interactions; these are interactions in which the
double mutant is significantly less fit than would be pre-
dicted by the fitnesses of thesinglemutants.Interest-
ingly, it has been observed that the number of GIs of a
gene (GI degree) is correlated with the percentage of
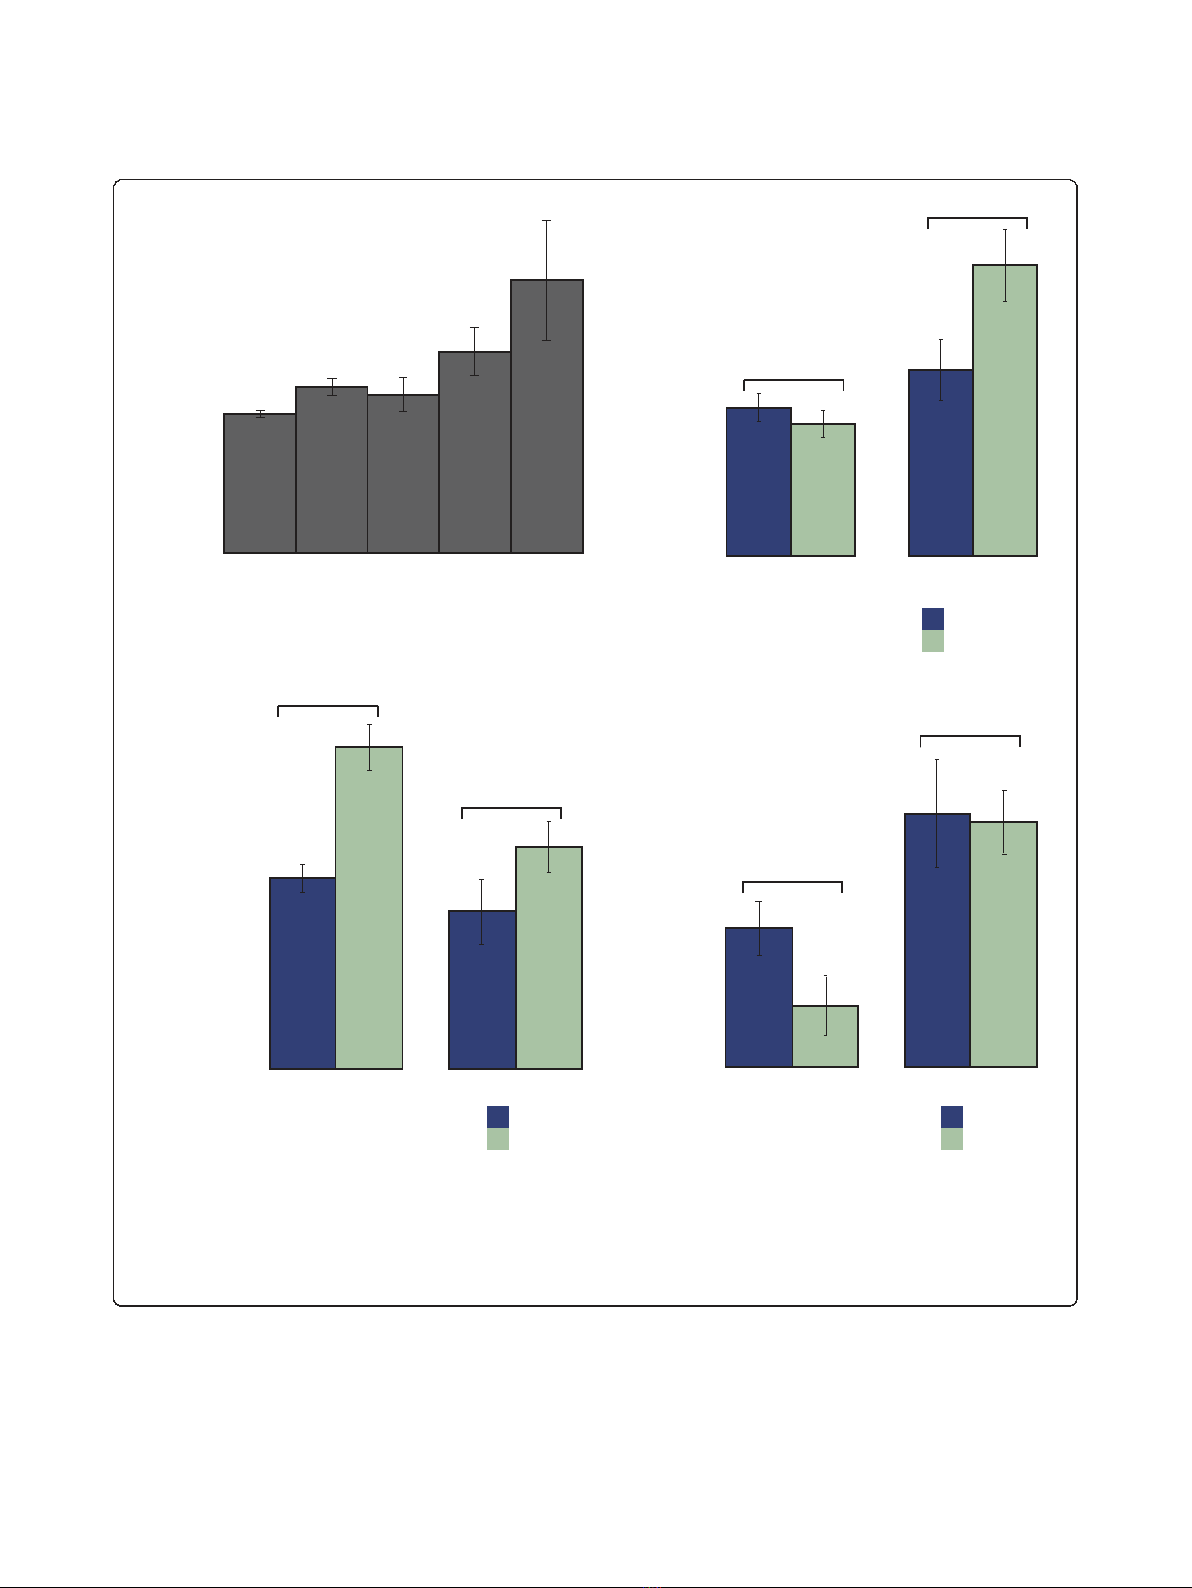
disordered regions in the gene product [9] (Figure 1a).
GI degree is also correlated with different measures of
multi-functionality (number of gene ontology (GO)
annotations, phenotypic capacitance [10] and chemical-
genetic sensitivity [11]), suggesting that the presence of
disordered regions may underlie the highly pleiotropic
roles of some proteins.
The relationship between disorder and multi-function-
ality appears to depend on whether a gene is a hub in
the GI network (that is, the gene is associated with a
large number of GIs). Specifically, within the set of the
GI hubs (> 90 percentile in GI degree), disorder of the
gene product is a strong predictor of multi-functionality
(r = 0.22, P<10
-12
;Figure1b),suggestingitisableto
distinguish highly functionally versatile GI hubs from
genes with more limited functional roles that simply
exhibit a large number of GIs. However, this trend is
absent on the set of non-GI hubs (< 50 percentile in GI
degree) where there is no significant correlation between
the amount of disorder and the number of annotated
functions (r = -0.02, P> 0.3). This stark difference sug-
gests that disorder plays a highly functional role on the
set of proteins that have many GIs while disorder out-
side these genes is either less functional or simply of a
markedly different nature. A similar distinction can be
observed for protein-protein interactions: disorder is sig-
nificantly correlated with protein-protein interaction
degree on GI hubs (r = 0.16, P<3×10
-3
;FigureS1in
Additional file 1) while no such correlation holds on
non-GI hubs (r = -0.01, P> 0.5). Thus, the GI network
appears to provide a clear means of defining a set of
proteins where the disorder plays a key functional role.
Despite their seeming functional importance, disor-
dered regions of proteins have previously been asso-
ciated with swiftly evolving, less conserved sequences,
presumably because of lower structural constraint [12].
We were intrigued by this property because, in general,
GI hubs exhibit significantly lower rates of evolution
(for example, measured by the dN/dS ratio) and tend to
be conserved more broadly across species [9]. Indeed,
we found that even among GI hubs, disordered proteins
have significantly elevated rates of evolution. This trend
is consistent outside the hubs as well (Figure 1c). How-
ever, disordered GI hubs are just as conserved phylogen-
etically as measured by their appearance across the yeast
clade (Figure 1d). Thus, while the amino acid sequences
tend to evolve faster for disordered GI hubs, they appear
to be as phylogenetically constrained at the gene level as
other GI hubs. Interestingly, outside of GI hubs, this is
not true: non-GI hubs that are disordered tend to be
less conserved across the yeast clade compared to their
structured counterparts (Figure 1d). These observations
relating disordered proteins to the GI network raise an
interesting paradox. While the presence of disordered
regions appears to be directly connected to their impor-
tance in the genetic network, there appears to be little
evolutionary sequence constraint on these regions.
Many disordered residues are conserved across species
The counter-intuitive evolutionary pressure on disor-
dered proteins motivated us to undertake a comparative
analysis of disordered regions across the yeast clade. We
hypothesized that functionally important disordered
regions, such as those present in GI hubs, would be
conserved as disorder across species (that is, also disor-
dered, even if the underlying amino acid sequence was
different) independent of rate of evolution. We therefore
assessed the conservation of disorder on the residue
level, which was also recently addressed by Chen et al.
[13,14]. Specifically, we predicted which residues were
disordered for all Saccharomyces cerevisiae genes and
Bellay et al.Genome Biology 2011, 12:R14
http://genomebiology.com/2011/12/2/R14
Page 2 of 15
their orthologs in the 23 species of the yeast clade using
DISOPRED2 [2], an algorithm that has been shown to
predict disordered regions reliably [15]. For each disor-
dered residue, we defined a measure of conserved disor-
der as the percentage of orthologs in which that residue
is disordered as well (Figure 2). We operationally define
conserved disordered residues as those with greater than
50% of disorder conservation.
Consistent with the general observations by Chen and
co-workers [13,14], we found that there is a surprisingly
0
0.05
0.1
0.15
0.2
0.25
0.3
0.35
0.4
0-49 50-99 100-149 150-199 200-250
Genetic interaction degree
Mean proportion of disordered residues
Non-hubs Hubs
p<10
-
3
(a) (b)
(c) (d)
0
0.02
0.04
0.06
0.08
0.1
0.12
0.14
0.16
0.18
Non-hubs Hubs
Non-hubs Hubs
Mean dN/dS
p<10-3
p<10-30
p>.2
p<10-4
p>.4
0
1
2
3
4
16
17
18
19
20
21
22
Mean phylogenetic persistence
Structured proteins
Disordered proteins
Structured proteins
Disordered proteins
Structured proteins
Disordered proteins
ytilanoitcnuf-itlum naeM
Figure 1 Genetic interactions distinguish different roles of disorder.(a) Percentage of disordered residues of yeast proteins by their
number of GIs. (b) Multi-functionality (see Materials and methods) for disordered and structured GI hubs and non-hubs. Hubs are genes in the
top 90th percentile (above 90 interactions) of GIs while non-hubs are in the bottom 50th percentile (below 15 interactions). (c) Evolutionary
constraint on sequence (dN/dS ratio) on hubs and non-hubs. In both cases disordered proteins have a significantly higher dN/dS than structured
proteins. (d) Evolutionary constraint measured by the presence of orthologs in other yeast species (phylogenetic persistence). While disordered
non-hubs are less conserved than structured non-hubs, the disordered hubs are as conserved as structured hubs. P-values were computed with
a Wilcoxon test, and error bars represent boot-strapped 95% confidence intervals.
Bellay et al.Genome Biology 2011, 12:R14
http://genomebiology.com/2011/12/2/R14
Page 3 of 15
high rate of conservation of disordered regions: over
50% of disordered regions are conserved through 90% of
the orthologs considered. Notably, disorder is conserved
in many regions even where the specific amino acids are
not conserved in the same regions, which explains the
elevated dN/dS that has been previously associated with
disorder [12] (Figure 2). However, consistent with the
stability of disorder across the yeast clade, we find that
changes of amino acids in disordered regions are biased
towards hydrophilic residues associated with disordered
regions and away from hydrophobic residues (Figure S2
in Additional file 1). This result suggests that, despite a
high evolutionary rate at the sequence level, there is
substantial evolutionary pressure to keep these regions
disordered.
Disorder can be systematically classified
Regions in which disorder is highly conserved across the
yeast clade exhibit a wide range of amino acid conserva-
tion rates (Figure 3). We reasoned that the degree of
constraint on the precise underlying sequence (as
opposed to the more general property of disorder)
might highlight distinct subclasses of functional disor-
der. To test this hypothesis, we divided conserved
Orthologous
AA Sequence
alignment
Disorder residues
(*) overlaid on
the above alignmen
t
A-score
D-score
High ( 5 )
A-scored residue
High ( 5 )
D-scored residue Low ( < 5 )
A-scored residue
Low ( > 0 & < 5 )
D-scored residue
Flexible disorder (residue)
Co nstraine d disorder (residue)
Non -conserved disorder (residue)
}
}
Orth seq 1
Orth seq 10
Orth seq 1
Orth seq 23
Orth seq 10
Orth seq 23
... ... ... ...
Define three distinct types of disorder residues across species
constrained non conserved flexible
Conservation in disorder (D) Conservation in AA (A)
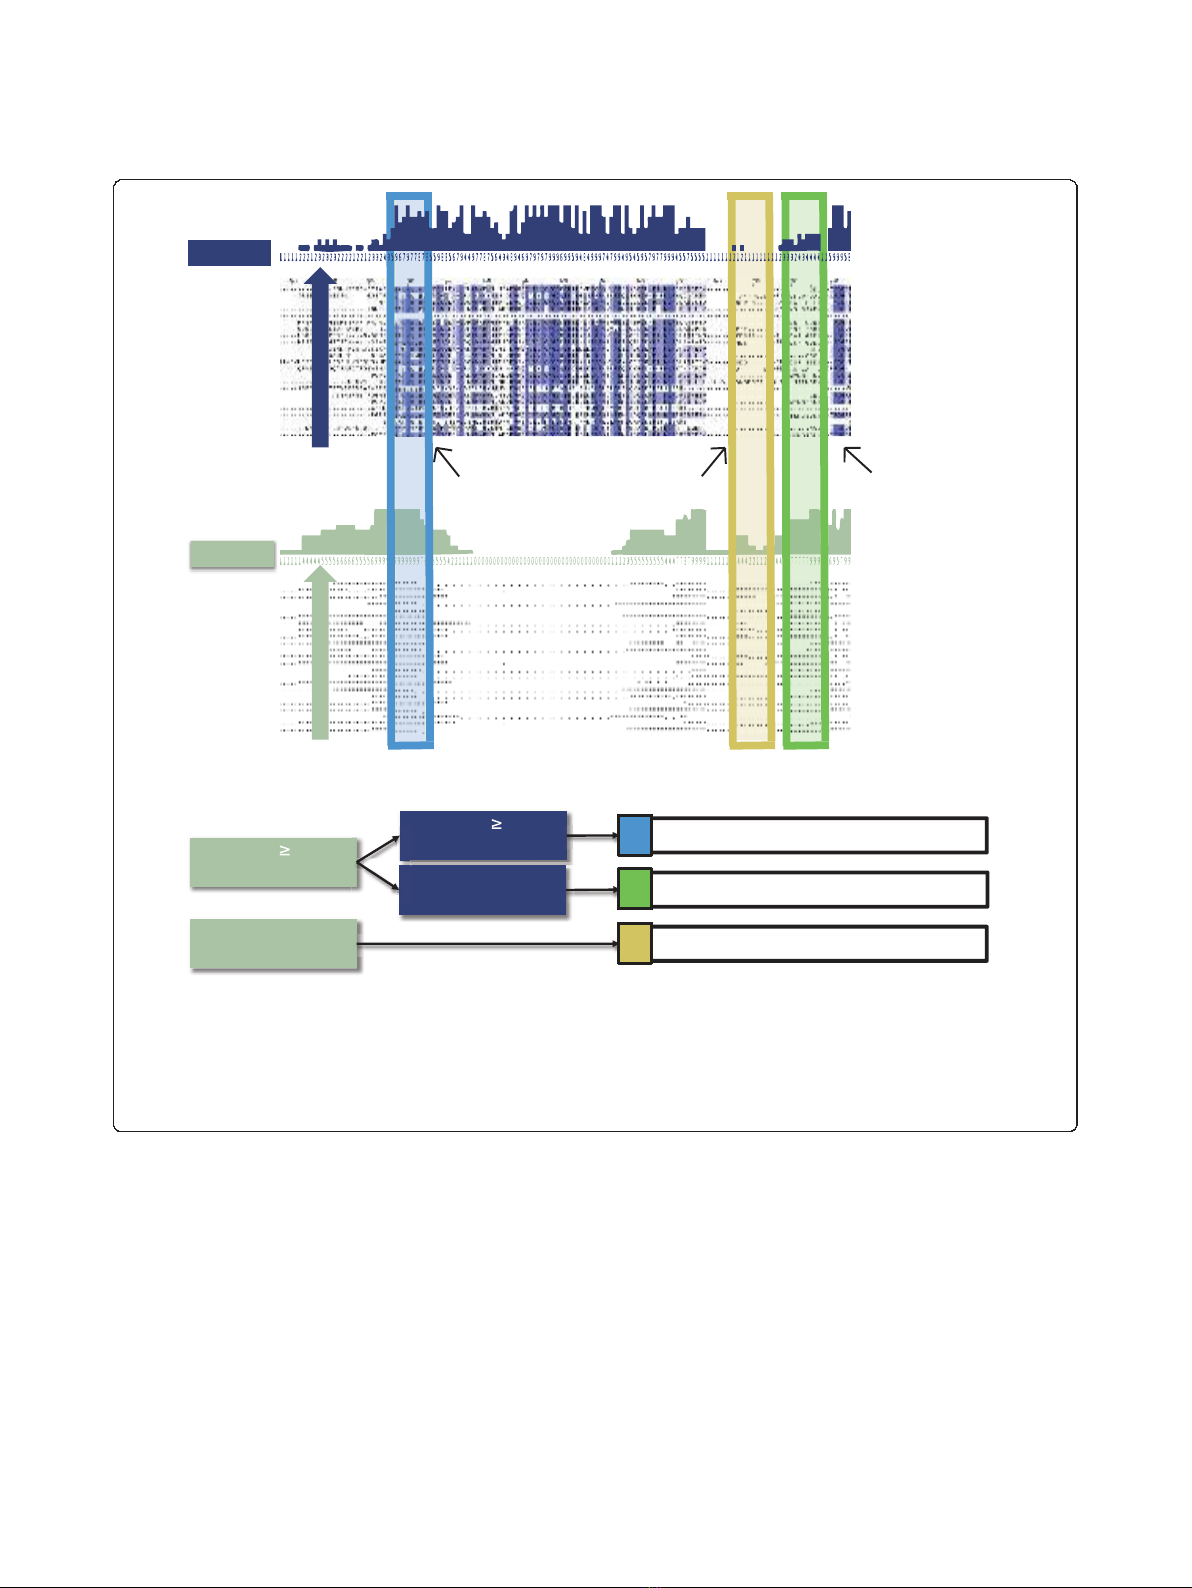
Figure 2 Two forms of conservation on disorder. Schematic of computing disorder conservation and amino acid (AA) sequence conservation.
After alignment, the percentage of sequences in which a residue is disordered is computed. Similarly, we compute the percentage of sequences
in which the amino acid itself is conserved. A residue is considered to be conserved disorder if the property of disorder is conserved in ≥50%
of species and sequentially conserved if the amino acid is conserved in ≥50% of species. Disordered residues in which both sequence and
disorder are conserved are referred to as constrained disorder. Disordered residues in which disorder is conserved but not the amino acid
sequence are referred to as flexible disorder. Residues which are disordered in S. Cerevisiae but not cases of conserved disorder are referred to as
non-conserved disorder.
Bellay et al.Genome Biology 2011, 12:R14
http://genomebiology.com/2011/12/2/R14
Page 4 of 15
disordered regions into those where the underlying
amino acid sequence is also conserved (’constrained dis-
order’), and the regions where there appears to be selec-
tion on the structural property of disorder itself rather
than the specific sequence (’flexible disorder’; Materials
and methods; Figure 2). Disordered residues that were
not conserved across the yeast clade were considered as
a separate, third class (’non-conserved disorder’;Figure
S3 in Additional file 1). It is important to note that
these results do not depend on the disorder predictor
algorithm and core results were qualitatively replicated
using DisEMBL [16] instead of DISOPRED2 (Figure S4
in Additional file 1). Furthermore, the three classes also
appear to be robust to various perturbations of the par-
ticular parameter choices of the method (Figures S5, S6,
S7, and S8 in Additional file 1). In addition, flexible dis-
order was more robust to random simulated mutations
(Figure S9 in Additional file 1), which is notable given
the general fragility of disorder to mutation reported by
[17].
The three classes of disorder exhibit widely different
properties (Figure 2b). First, while disorder is generally
thought to be important in proteins with regulatory and
signaling functions, we find that this is true only for
AA conservation score
Disorder conservation score
123456789
0.00 0.05 0.10 0.15 0.20
0123456789
0.0 0.1 0.2 0.3 0.4 0.5
(b)(c)
(
a
)
0
1
2
3
4
5
6
7
8
9
123456789
AA Conservation
AA and disorder conservation
Disorder Conservation
0.01
0.02
>0.03
0
Residue density
Residue density
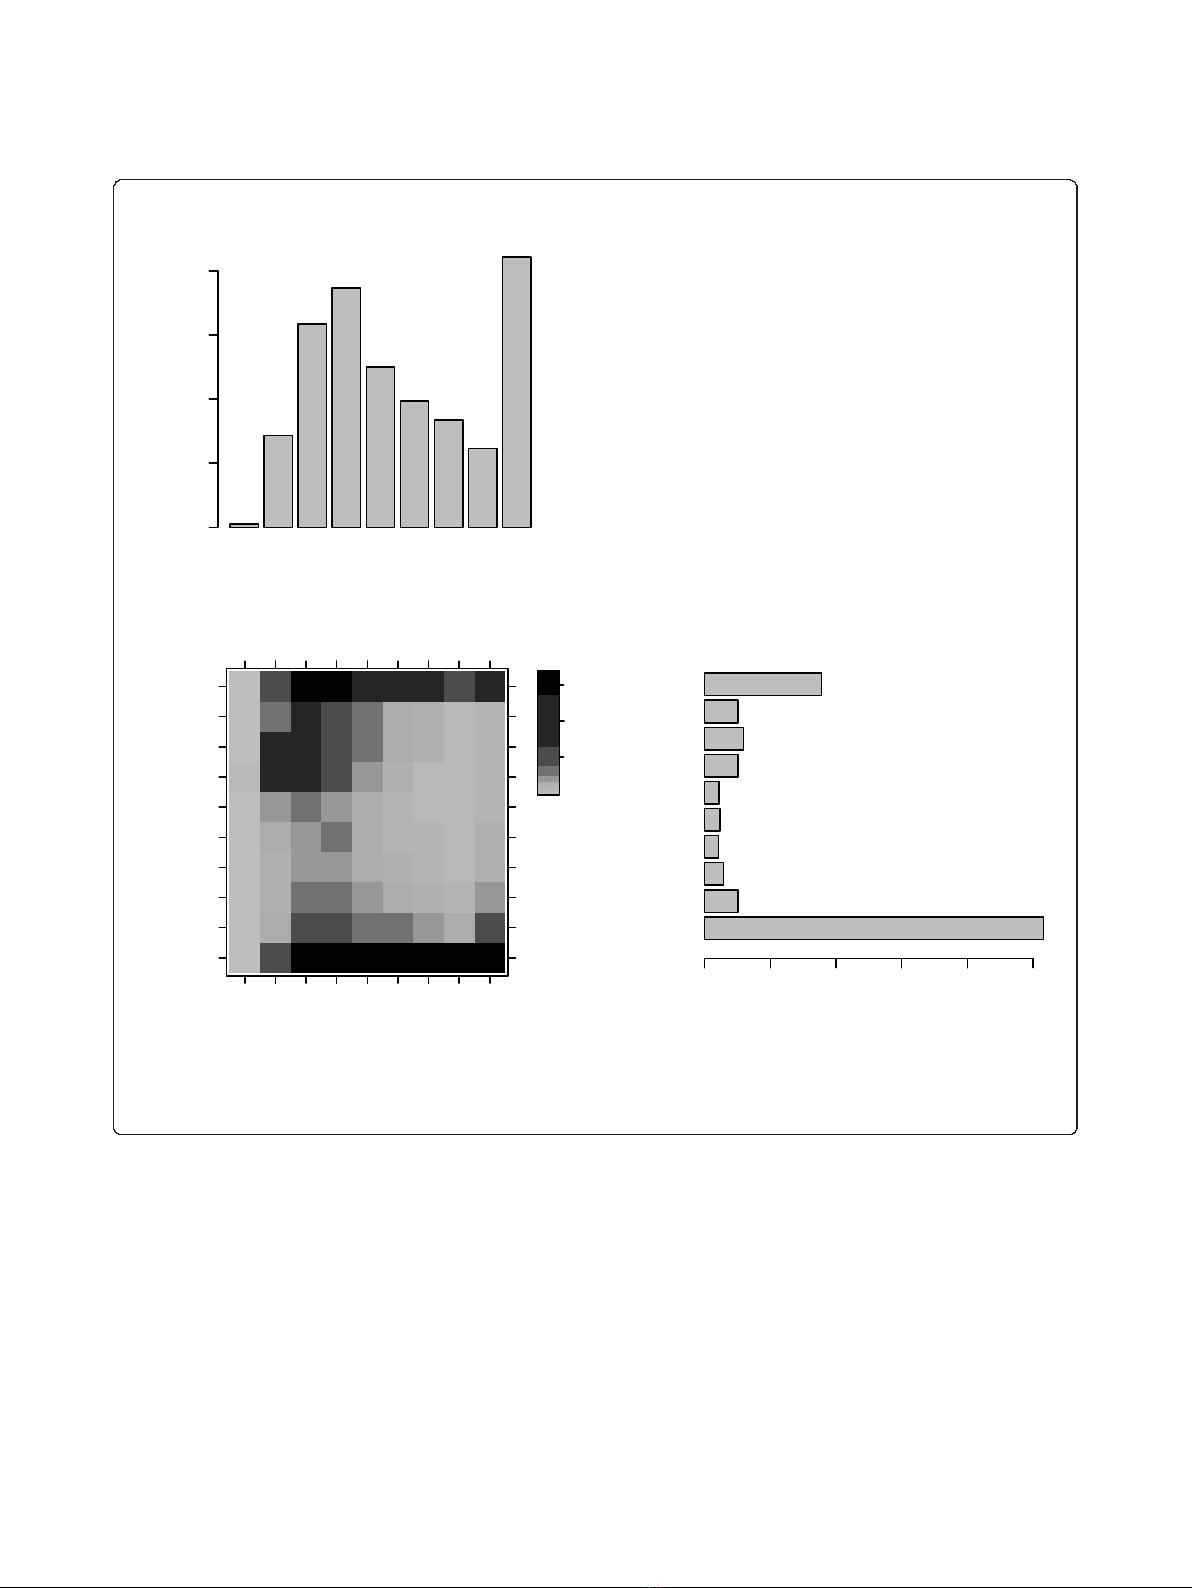
Figure 3 Densities of disorder- and amino acid-conserved residues by their scores. Densities of disorder and amino acid conservation
scores across all alignments of approximately 5,000 orthologous groups from 23 yeast species. (a) Histogram of the amino acid (AA)
conservation scores. (b) Histogram of disorder conservation scores. (c) Two-dimensional histogram of both amino acid and disorder conservation
scores.
Bellay et al.Genome Biology 2011, 12:R14
http://genomebiology.com/2011/12/2/R14
Page 5 of 15


![Báo cáo seminar chuyên ngành Công nghệ hóa học và thực phẩm [Mới nhất]](https://cdn.tailieu.vn/images/document/thumbnail/2025/20250711/hienkelvinzoi@gmail.com/135x160/47051752458701.jpg)


%20--%3e%3cdefs%3e%3cstyle%3e%20.st0%20{%20fill:%20%23fff;%20}%20.st1%20{%20fill:%20%237800fa;%20}%20%3c/style%3e%3c/defs%3e%3cpath%20class='st1'%20d='M117.78,12.18H43.11c2.9,3.47,4.65,7.94,4.65,12.82,0,5.6-2.3,10.66-6.01,14.29h76.02l7.22-13.56-7.22-13.56Z'/%3e%3cg%3e%3cpath%20class='st0'%20d='M53.58,26.17h-.59v-1.46h.59v-4.96h2.83c1.78,0,2.67.94,2.67,2.82v5.76c0,1.87-.89,2.81-2.67,2.81h-2.83v-4.96ZM55.36,21.37v3.34h1.1v1.46h-1.1v3.34h1.01c.61,0,.91-.37.91-1.1v-5.93c0-.74-.3-1.1-.91-1.1h-1.01Z'/%3e%3cpath%20class='st0'%20d='M65.99,31.14h-1.8l-.31-2.07h-2.19l-.31,2.07h-1.64l1.82-11.39h2.62l1.82,11.39ZM65.28,18.04c-.25.46-.51.77-.75.94-.21.15-.47.22-.79.22-.26,0-.57-.07-.92-.22l-.38-.15c-.14-.05-.26-.07-.37-.07-.3,0-.53.18-.71.54l-.91-.68c.25-.46.51-.77.75-.94.21-.14.48-.21.79-.21.26,0,.57.07.92.21l.38.15c.14.05.26.07.37.07.3,0,.53-.18.71-.54l.91.68ZM61.91,27.52h1.73l-.87-5.76-.87,5.76Z'/%3e%3cpath%20class='st0'%20d='M74.53,26.89v1.52c0,1.91-.89,2.86-2.67,2.86s-2.67-.95-2.67-2.86v-5.93c0-1.91.89-2.86,2.67-2.86s2.67.95,2.67,2.86v1.11h-1.69v-1.22c0-.75-.31-1.12-.93-1.12s-.93.37-.93,1.12v6.15c0,.74.31,1.11.93,1.11s.93-.37.93-1.11v-1.63h1.69Z'/%3e%3cpath%20class='st0'%20d='M81.4,31.14h-1.8l-.31-2.07h-2.19l-.31,2.07h-1.64l1.82-11.39h2.62l1.82,11.39ZM75.9,19.2l1.52-1.91h1.71l1.51,1.91h-1.61l-.76-.95-.75.95h-1.61ZM77.32,27.52h1.73l-.87-5.76-.87,5.76ZM83.1,15.99l-1.76,1.91h-1.26l1.17-1.91h1.86Z'/%3e%3cpath%20class='st0'%20d='M84.86,19.75c1.78,0,2.67.94,2.67,2.82v1.48c0,1.87-.89,2.81-2.67,2.81h-.85v4.28h-1.79v-11.39h2.64ZM84.01,21.37v3.86h.85c.58,0,.87-.36.87-1.08v-1.71c0-.71-.29-1.07-.87-1.07h-.85Z'/%3e%3cpath%20class='st0'%20d='M93.51,19.75c1.78,0,2.67.94,2.67,2.82v1.48c0,1.87-.89,2.81-2.67,2.81h-.85v4.28h-1.79v-11.39h2.64ZM92.66,21.37v3.86h.85c.58,0,.87-.36.87-1.08v-1.71c0-.71-.29-1.07-.87-1.07h-.85Z'/%3e%3cpath%20class='st0'%20d='M98.8,31.14h-1.79v-11.39h1.79v4.88h2.03v-4.88h1.83v11.39h-1.83v-4.88h-2.03v4.88Z'/%3e%3cpath%20class='st0'%20d='M105.36,24.55h2.46v1.62h-2.46v3.34h3.09v1.63h-4.88v-11.39h4.88v1.63h-3.09v3.18ZM108.17,17.29l-1.76,1.91h-1.26l1.17-1.91h1.86Z'/%3e%3cpath%20class='st0'%20d='M112.2,19.75c1.78,0,2.67.94,2.67,2.82v1.48c0,1.87-.89,2.81-2.67,2.81h-.85v4.28h-1.79v-11.39h2.64ZM111.35,21.37v3.86h.85c.58,0,.87-.36.87-1.08v-1.71c0-.71-.29-1.07-.87-1.07h-.85Z'/%3e%3c/g%3e%3ccircle%20class='st1'%20cx='25'%20cy='25'%20r='20'/%3e%3cpath%20class='st0'%20d='M32.78,19.27c2.92,0,4.43,2.55,5.28,5.33l.71,2.17c.14.38-.33.75-.71.75h-5.61c.19-.33.24-.71.09-1.08l-.75-2.45c-.43-1.32-.99-2.64-1.79-3.77.75-.57,1.65-.94,2.78-.94h0ZM25,18.38c3.25,0,4.9,2.78,5.89,5.89l.76,2.45c.14.42-.33.8-.8.8h-11.69c-.42,0-.94-.38-.8-.8l.75-2.45c.99-3.11,2.64-5.89,5.89-5.89h0ZM25,11.35c1.74,0,3.11,1.37,3.11,3.11s-1.37,3.11-3.11,3.11-3.11-1.41-3.11-3.11,1.41-3.11,3.11-3.11h0ZM17.27,19.27c1.08,0,1.98.38,2.73.94-.8,1.13-1.37,2.45-1.74,3.77l-.8,2.45c-.14.38-.05.75.09,1.08h-5.56c-.42,0-.9-.38-.75-.75l.71-2.17c.9-2.78,2.41-5.33,5.33-5.33h0ZM17.27,12.91c1.51,0,2.78,1.27,2.78,2.83s-1.27,2.83-2.78,2.83-2.83-1.27-2.83-2.83,1.27-2.83,2.83-2.83h0ZM32.78,12.91c1.56,0,2.78,1.27,2.78,2.83s-1.23,2.83-2.78,2.83-2.83-1.27-2.83-2.83,1.27-2.83,2.83-2.83h0ZM27.07,28.56v.09c0,.57-.24,1.08-.61,1.46h0v.05c-.38.33-.9.57-1.46.57s-1.08-.24-1.46-.61h0c-.38-.38-.61-.9-.61-1.46v-.09h1.41v.09c0,.19.05.38.19.47v.05c.09.09.28.19.47.19s.38-.09.47-.19v-.05c.14-.09.24-.28.24-.47t-.05-.09h1.41ZM30.99,28.56v.09c0,1.65-.66,3.16-1.74,4.24-1.08,1.08-2.59,1.79-4.24,1.79s-3.16-.71-4.24-1.79l-.05-.05c-1.04-1.08-1.7-2.55-1.7-4.2v-.09h1.41v.09c0,1.27.47,2.4,1.27,3.25h.05c.85.85,1.98,1.37,3.25,1.37s2.4-.52,3.25-1.37c.85-.8,1.37-1.98,1.37-3.25v-.09h1.37ZM34.99,28.56v.09c0,2.78-1.13,5.28-2.92,7.07-1.79,1.79-4.29,2.92-7.07,2.92s-5.23-1.13-7.07-2.92c-1.79-1.79-2.92-4.29-2.92-7.07v-.09h1.41v.09c0,2.4.94,4.53,2.5,6.08,1.56,1.56,3.72,2.5,6.08,2.5s4.52-.94,6.08-2.5c1.56-1.56,2.5-3.68,2.5-6.08v-.09h1.41Z'/%3e%3c/svg%3e)