Spectroscopic characterization of a higher plant heme oxygenase isoform-1 from Glycine max (soybean) ) coordination structure of the heme complex and catabolism of heme Tomohiko Gohya1, Xuhong Zhang2, Tadashi Yoshida2 and Catharina T. Migita1
1 Department of Biological Chemistry, Faculty of Agriculture, Yamaguchi University, Japan 2 Department of Biochemistry, Yamagata University School of Medicine, Japan
Keywords ferredoxin; heme catabolism; heme complex; higher-plant heme oxygenase; spectroscopic characterization
Correspondence C. T. Migita, Department of Biological Chemistry, Faculty of Agriculture, Yamaguchi University, 1677-1 Yoshida, Yamaguchi 753-8515, Japan Fax ⁄ Tel: +81 83 9335863 E-mail: ctmigita@yamaguchi-u.ac.jp T. Yoshida, Department of Biochemistry, Yamagata University School of Medicine, Iidanishi 2-2-2, Yamagata 990-9585, Japan Fax: +81 23 6285225 Tel: +81 23 6285222 E-mail: tyoshida@med.id.yamagata-u.ac.jp
(Received 9 August 2006, revised 1 October 2006, accepted 9 October 2006)
doi:10.1111/j.1742-4658.2006.05531.x
Heme oxygenase converts heme into biliverdin, CO, and free iron. In plants, as well as in cyanobacteria, heme oxygenase plays a particular role in the biosynthesis of photoreceptive pigments, such as phytochromobilins and phycobilins, supplying biliverdin IXa as a direct synthetic resource. In this study, a higher plant heme oxygenase, GmHO-1, of Glycine max (soy- bean), was prepared to evaluate the molecular features of its heme com- plex, the enzymatic activity, and the mechanism of heme conversion. The similarity in the amino acid sequence between GmHO-1 and heme oxygen- ases from other biological species is low, and GmHO-1 binds heme with 1 : 1 stoichiometry at His30; this position does not correspond to the prox- imal histidine of other heme oxygenases in their sequence alignments. The heme bound to GmHO-1, in the ferric high-spin state, exhibits an acid– base transition and is converted to biliverdin IXa in the presence of NADPH ⁄ ferredoxin reductase ⁄ ferredoxin, or ascorbate. During the heme conversion, an intermediate with an absorption maximum different from that of typical verdoheme–heme oxygenase or CO–verdoheme–heme oxyge- nase complexes was observed and was extracted as a bis-imidazole com- plex; it was identified as verdoheme. A myoglobin mutant, H64L, with high CO affinity trapped CO produced during the heme degradation. Thus, the mechanism of heme degradation by GmHO-1 appears to be similar to that of known heme oxygenases, despite the low sequence homology. The heme conversion by GmHO-1 is as fast as that by SynHO-1 in the presence of NADPH ⁄ ferredoxin reductase ⁄ ferredoxin, thereby suggesting that the latter is the physiologic electron-donating system.
trons supplied by NADPH. Studies on the structure and function of HO have been conducted mostly in mammalian enzymes, as HO was first identified in mammals [1–3]. During the last decade, the HO genes
Heme oxygenase (HO, EC 1.14.99.3) catalyzes the con- version of heme to biliverdin IXa, CO and free iron through successive reduction and oxygenation reac- tions in the presence of molecular oxygen and elec-
FEBS Journal 273 (2006) 5384–5399 ª 2006 The Authors Journal compilation ª 2006 FEBS
5384
Abbreviations AtHO-1, heme oxygenase isoform 1 of Arabidopsis thaliana; BVR, biliverdin reductase; CPR, cytochrome P450 reductase; Fd, plant ferredoxin; FNR, ferredoxin:NADP+ reductase; GmHO-1, heme oxygenase isoform 1 of Glycine max; heme, iron protoporphyrin IX, either ferrous or ferric forms; hemin, ferric protoporphyrin IX; HO, heme oxygenase; hydroxyheme, iron meso-hydroxyl protoporphyrin IX; KPB, potassium phosphate buffer; rHO-1, heme oxygenase isoform 1 of Rattus norvegicus; SynHO-1, heme oxygenase isoform 1 of Synechocystis sp. PCC 6803.
T. Gohya et al. Heme catabolism by soybean heme oxygenase-1
have been identified in a wide range of biological species, especially in pathogenic bacteria, and some of them have been expressed and characterized [4–6]. Higher-plant HOs, however, have not been investi- gated on a molecular basis by applying multiple spect- roscopic methods to the purified protein, and are now the least studied HOs.
cell damage [11]. More recently, the PsHO1 gene of pea was expressed, and the HO activity of the protein product was examined [12]. These studies have shown that the obtained proteins bind heme to generate a 1 : 1 complex, and CO and biliverdin IXa are gener- ated through heme catabolism, thereby confirming HO activity. However, characterization of the heme com- plexes on a molecular basis and determination of the kinetics of heme catabolism have not been performed yet.
HO in plants is one of the plastid enzymes partici- pating in phytochromobilin synthesis. This enzyme catalyzes the cleavage of heme into biliverdin IXa, which is then reduced and isomerized to form (3E)- phytochromobilin, a chromophore of the photorecep- tor protein of the phytochrome family, which plays critical roles in mediating photomorphogenesis, by sensing far-red and red light [7]. HO genes of higher plants have been identified in a few moss plants, several angiosperms (tobacco, tomato, pea, soybean, rice plant, sorghum, Arabidopsis thaliana), and a gym- nosperm (loblolly pine) [8]. So far, the HY1 gene and the HO3 and HO4 genes of Arabidopsis have been expressed in Escherichia coli, and Cd-induced expres- sion of HO-1 in soybean leaves has also been reported [8–11]. In the latter study, it was suggested that plant HOs also play a role in protection against oxidative
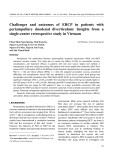
The amino acid sequences reported for higher-plant HOs are highly homologous to each other; for example, soybean (Glycine max) HO isoform-1 (GmHO-1) has 71.7% homology to A. thaliana HO-1 (AtHO-1), and HOs from other plant species have similar levels of homology. On the contrary, the homology in amino acid sequences between plant HOs and HOs from other biological species is quite low, e.g. 21% to cyanobacte- rial HO-1 (Synechocystis sp. PCC 6803) (SynHO-1), 22% to rat HO-1 (rHO-1), 23% to corynebacterial HmuO, or 21% to neisserial HemO. Comparison of the sequence alignment reveals that the catalytically pivotal residues, Gly139 and Asp140, of human HO-1 (and also rHO-1) are replaced by Ala and His, respectively,
FEBS Journal 273 (2006) 5384–5399 ª 2006 The Authors Journal compilation ª 2006 FEBS
5385
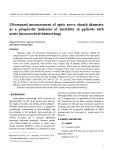
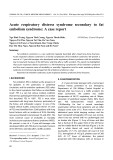
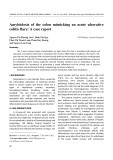
Fig. 1. Amino acid sequence of GmHO-1 as compared with the sequences of Arabidopsis, Synechocystis and rat HO-1s. The lightly shaded letters indicate residues with sequence identity, and heavily shaded histidine residues are proximal heme ligands. Bars below the alignments show a-helical parts (A(cid:2)H) in the crystal structures of heme–SynHO-1 and heme–rHO-1 and those presumed for heme–GmHO-1.
T. Gohya et al. Heme catabolism by soybean heme oxygenase-1
Results
Expression and purification of GmHO-1
in GmHO-1 (Fig. 1), although the residues comprising the distal F-helix part are relatively well conserved in the whole sequence of GmHO-1. In mammalian HO-1, Gly139 directly contacts with heme, and Asp140 is known to be a key residue for enzymatic activity [3,13]. In addition, the proximal residue for the substrate heme binding, His25 in rHO-1 (also in human HO-1), is replaced by Lys, and only one His in the correspond- ing distal A-helix part occupies a position 13 residues away from the N-terminus. Moreover, the Arg183 resi- due of mammalian HO-1, which participates in a-meso- specific heme decomposition, is not conserved (Leu in GmHO-1) [14]. Thus, our first concern in examining plant HOs is to determine whether the plant HO lack- ing the residues critical for HO activity catalyzes heme degradation in a similar fashion to the mammalian enzymes.
shows
full
By culturing the cells at two temperatures, first at 37 (cid:2)C and then at 25 (cid:2)C, we avoided the accumulation of inclusion bodies of GmHO-1. The harvested cells were brown in color, unlike the cells expressing rHO-1 or SynHO-1, which were greenish due to the accumu- lated biliverdin; nevertheless, the E. coli cells expressed active GmHO-1, as will be described later. It has been reported that the E. coli cells expressing the HY1 gene encoding AtHO-1 have a yellowish-brown tinge [9]. We purified the GmHO-1 from the soluble fraction by ammonium sulfate fractionation and subsequent col- umn chromatography on Sephadex G-75 and DE-52. The ammonium sulfate fraction and active G-75 frac- tions were tinged with yellow. We do not know the nature of this yellow substance(s) at present. The final preparation after chromatography on a DE-52 column was clear and colorless, and gave a single band of 26 kDa with about 97% purity on SDS ⁄ PAGE, the size expected from the deduced GmHO-1 amino acid sequence (26.1 kDa). About 100 mg of protein was obtained from 1 L of culture.
Spectroscopic features of the heme–GmHO-1 complex
ferric,
in the
The next concern is to establish the mechanism of electron transfer from NADPH to GmHO-1. Muramoto et al. reported that the AtHO-1 reaction required addi- tional reductant besides ferredoxin reductase (FNR; ferredoxin:NADP+ reductase; EC 1.27.1.2) ⁄ ferredoxin (Fd) and NADPH [9]. On the other hand, we have clarified that cyanobacterial SynHO-1 (and also HO-2) activity when coupled with NADPH ⁄ FNR ⁄ Fd, without a secondary reductant, which had been suggested to be necessary for the HO activity of cyanobacterial proteins [15–17]. Then, we wanted to determine whether the NADPH ⁄ FNR ⁄ Fd reducing system works fully in the heme conversion into biliverdin by GmHO-1 as in the SynHO-1 reaction.
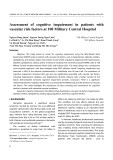
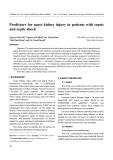
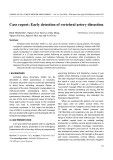
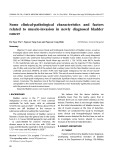
The optical absorption spectra of the heme–GmHO-1 complex ferrous, CO-bound and O2-bound forms are typical of heme proteins and similar to those of the SynHO-1 or rHO-1 complexes (Fig. 2). The stoichiometry of the heme binding was confirmed to be 1 : 1 by the titration plots shown in the inset. The optical absorption data for heme– GmHO-1, together with those of SynHO-1 and rHO-1, are summarized in Table 1. The absorption maxima of the O2-bound and CO-bound forms of heme–GmHO-1 are slightly red-shifted compared with those of heme– SynHO-1 and heme–rHO-1.
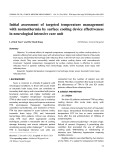
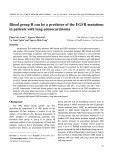
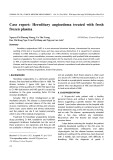
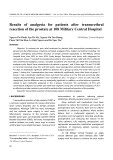
The EPR spectrum of heme–GmHO-1 at pH 7.0 shows the heme mostly in the rhombic ferric high-spin state, with gx ¼ 5.95, gy ¼ 5.68 and gz ¼ 2.00 (Fig. 3A). Here, anisotropy of the gxy component is apparently larger than that of heme–rHO-1, as shown in the partly expanded spectra (a-1 in Fig. 3), indicating that in-plane anisotropy of heme is relatively large. In addition, small amounts of low-spin species are also observed in the neutral solution, as distinctly seen in the partly expan- ded spectrum (a-2 in Fig. 3). The EPR spectrum of the 15NO-bound GmHO-1 (nitrosylheme GmHO-1) is characteristic of six-coordinate heme proteins with the
To investigate these phenomena, we purified the recombinant mature form of GmHO-1 protein, exclu- ding the plastid transit peptides, based on the reported amino acid sequence [8] by constructing a bacterial expression system. Spectroscopic analyses of the molecular features of the heme–GmHO-1 complex and of the mechanism of heme degradation were per- formed, and the results were compared with those for the heme complexes of SynHO-1 and rHO-1. We found that, in spite of the low homology of the amino acid sequence with those of known HOs, the heme– GmHO-1 complex has similar spectroscopic character- istics to those of the heme complexes of cyanobacterial, mammalian or bacterial HOs [15,18,19]. GmHO-1 con- verts combined heme into biliverdin IXa, retaining a-regiospecificity, and releasing CO and free iron, in the presence of oxygen and NADPH ⁄ FNR ⁄ Fd, with- out requiring additional reducing agents, albeit the coordination structure of the verdoheme intermediate is apparently different from that of the known verdo- heme–HO complexes.
FEBS Journal 273 (2006) 5384–5399 ª 2006 The Authors Journal compilation ª 2006 FEBS
5386
T. Gohya et al. Heme catabolism by soybean heme oxygenase-1
Fig. 2. Absorption spectra of the various forms of heme–GmHO-1. Spectra are of the ferric (red), ferrous (blue), ferrous–CO (black) Inset: titration plots of GmHO-1 and ferrous–oxy (green) forms. (4.8 nmol) with hemin (0.4 mM), monitored by the increase in absorbance at 405 nm. The pink off-line dots indicate the results for the titration without protein.
Table 1. Optical absorption data of the heme–HO-1 complexes.
Protein
GmHO-1 kmax (nm) SynHO-1 kmax (nm) rHO-1 kmax (nm)
Soret Visible Soret Visible Soret Visible Types of heme
500, 631
554 540, 575 535, 568 540, 575 405 )1Æcm)1) 127 428 415 420 414 8.2 500, 630 402 128 557 427 541, 578 410 539, 569 427 539, 577 427 8.9 498, 631 404 140 555 431 537, 574 410 536, 566 419 537, 575 414 7.6 Ferric e (mM Ferrous Oxy CO-bound Alkaline pKa
(A).
Fig. 3. EPR spectra of the ferric heme–GmHO-1 (A, B) and nitro- sylheme–HO (C–E) complexes. EPR conditions were: microwave frequency, 9.35 GHz; microwave power, 1 mW for (A) and (B) and 0.2 mW for (C)–(E); field modulation frequencies, 100 kHz; field modulation amplitude, 10 G for (A) and (B) and 2 G for (C)–(E); sig- nal acquisition temperature, 8 K for (A) and (B) and 25 K for (C)–(E). (A) The ferric heme complex of GmHO-1 at pH 7.0 (0.1 M, KPB). a-1, Expansion of the gxy region of (A) (solid line) and of the corres- ponding part of the spectrum of ferric heme–rHO-1 (dotted line). (B) The ferric the higher-field region of a-2, Expansion of heme–GmHO-1 complex at pH 8.7 (50 mM, Tris ⁄ HCl). (C–E) The 15N-nitrosylheme complexes of GmHO-1, SynHO-1, and rHO-1, respectively.
nitrogenous proximal indicating hyperfine ligand, splitting due to a 14N nucleus (nuclear spin 1, giving the triplet splitting) in addition to a 15N nucleus (nuclear spin 1 ⁄ 2, giving the doublet splitting) at the g2 compo- nent (Fig. 3C). This strongly suggests coordination of a histidinyl residue to the proximal site of the heme. The spectral features of 15NO-heme–GmHO-1 are somewhat different from those of the nitrosylheme complexes of SynHO-1 (Fig. 3D) and rHO-1 (Fig. 3E), whereas those of the latter two are very alike. The EPR parameters of the nitrosylheme–HO complexes as well as those of the low-spin heme–HO complexes are listed in Table 2.
depending on pH, between acidic (pH 6.5) and alka- line (pH 10.5) conditions. The absorption maxima of the alkaline form are listed in Table 1. The pKa value of this acid–base transition was estimated to be 8.2 by the method described in Experimental procedures.
Acid–base transition of heme–GmHO-1
The features of the optical absorption spectrum of the ferric heme–GmHO-1 complex reversibly change,
Such an acid–base transition of heme–GmHO-1 was also observed by EPR. The EPR spectrum of heme– GmHO-1 at pH 8.7 exhibited a small high-spin signal at gxy (cid:2) 6 and prominent peaks of the low-spin heme
FEBS Journal 273 (2006) 5384–5399 ª 2006 The Authors Journal compilation ª 2006 FEBS
5387
T. Gohya et al. Heme catabolism by soybean heme oxygenase-1
Table 2. EPR parameters of the low-spin and 15NO-bound forms of heme–HO-1 complexes.
Protein
GmHO-1 SynHO-1 rHO-1
Alkaline Neutral Alkaline-1 Alkaline-2 Alkaline
Low spin
2.63 2.21 1.82 2.86 2.29 1.59 2.78 2.14 1.74 2.68 2.20 1.80 2.67 2.21 1.79 g1 g2 g3 15NO 27 31 26
7.6 2.09 2.01 1.96 7.1 2.08 2.00 1.96 7.5 2.08 2.01 1.97 a (15N), G a (14N), G g1 g2 g3
in Fig. 3A,
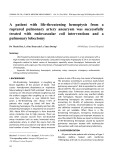
Fig. 4. EPR spectra of (A) ferric heme and (B) 15N-nitrosylheme complexes of the H30G mutant of GmHO-1. EPR conditions were the same as those described in Fig. 3.
at the lower magnetic fields (Fig. 3B). The g-values of this low-spin species were the same as those of the low-spin species observed at neutral pH (denoted as gak expanded lower-field spectrum). Accordingly, this species was determined to be the alkaline form of heme–GmHO-1, which coordinates a hydroxyl anion at the distal site of heme. Another low-spin species, denoted as g* in Fig. 3A, seems to be a denatured form of heme–GmHO-1, because similar low-spin species were sometimes observed for other heme–HO complexes (data not shown).
Single species of the alkaline form were observed for heme–GmHO-1, the same as for rHO-1, but distinct from SynHO-1, which exhibits two kinds of alkaline forms (Table 2). The anisotropy in g-values, gak 1 –gak 3 , of the alkaline form of heme–GmHO-1 is somewhat smaller than that of the other two HO complexes. This might indicate that the axial ligand field is relatively strong in GmHO-1, due to steric control imposed by the distal helix, in accord with the observation that the in-plane anisotropy is large in the ferric state of heme.
Determination of the proximal ligand
15NO coordination without
the
but the optical spectrum of the heme–H30G complex exhibited an asymmetrically broadened Soret band with the blue-shifted maximum at around 390 nm, compared with the Soret-band features of the wild-type complex, and no other characteristic bands at the vis- ible region (data not shown). Such features of the spec- trum are commonly seen in the heme complexes of HO mutants lacking the proximal His [20,21]. The heme–H30G complex did not decompose the bound heme enzymatically in the presence of either ascorbate or NADPH ⁄ FNR ⁄ Fd (data not shown). EPR meas- urements on the heme–H30G complex provided critical evidence for the lack of coordination of a protein resi- due at the proximal site, yielding the deformed spec- trum of high-spin heme (Fig. 4A), which means that the heme is in the multiple configuration in the heme pocket, and the spectrum of nitrosylheme is typical of sixth ligand the (Fig. 4B). Accordingly, it has been established that the proximal ligand of heme–GmHO-1 is His30.
Exogenous ligand binding
the heme pocket
Based on the EPR results for nitrosylheme–GmHO-1, candidates for the proximal ligand of heme were searched for in the amino acid sequence of GmHO-1, around the position corresponding to the proximal His of other HOs (Fig. 1). His30 was found to be only nitrogenous ligand capable of coordinating to the fer- ric heme, so the GmHO-1 mutant H30G was prepared, and the optical absorption and EPR spectra of its heme complex were determined. The H30G mutant also accommodated heme with 1 : 1 stoichiometry, like other HO mutants that lack the proximal histidine,
To investigate the nature of in GmHO-1, the apparent equilibrium constant for bind- imidazole and azide, to ing of nitrogenous ligands, heme–GmHO-1 was evaluated. As imidazole was added to the solution of heme–GmHO-1, the Soret
FEBS Journal 273 (2006) 5384–5399 ª 2006 The Authors Journal compilation ª 2006 FEBS
5388
T. Gohya et al. Heme catabolism by soybean heme oxygenase-1
Table 3. Equilibrium constants for imidazole and azide ion binding to the heme–HO-1 complexes. Numbers in parentheses indicate relative values normalized to the values of GmHO-1.
exhibit
Protein
GmHO-1 SynHO-1 rHO-1
)1) M
)1)
210 (6) 35 (1) 43 (1) 17 (0.4) 1400 (40) 200 (4.7) Kimidazole (M Kazide (· 102
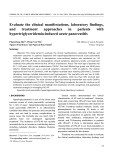
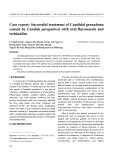
ferric heme, oxyheme and verdoheme intermediate complexes of HO and free biliverdin, products of the HO reaction, all characteristic absorption bands (Scheme 1). As shown in Fig. 5A, addition of ascorbate to the solution of heme–GmHO-1 initiates the reaction, as revealed by gradual diminution of the Soret band. After several minutes, a broad band appears at around 660–675 nm; this increases in inten- sity with time, indicating the formation of biliverdin. In this case, neither bands of the oxy form (at 541 and 578 nm) nor bands of verdoheme and CO–verdoheme (at (cid:2) 690 and at (cid:2) 640 nm, respectively) are observed, implying that the first step of heme conversion is rate- limiting. The apparent initial rate of heme degradation by GmHO-1 is about three times higher than that of degradation by SynHO-1, but nearly four times lower than that of degradation by rHO-1 in the presence of 1200 equivalents of ascorbate (Table 4).
band maximum of the complex shifted from 405 to 410 nm and decreased in intensity, without showing a distinct isosbestic point. At the same time, the heights of the absorption peaks in the visible region (500 and 630 nm) also decreased, and then new peaks appeared at 531 and 568 nm with increasing intensity, indica- imidazole-bound heme–GmHO-1 ting formation of (data not shown). The association constant was esti- mated on the basis of the changes in absorbance at 402 nm (imidazole-free form) and at 422 nm (imidaz- ole-bound form) in the difference spectra of imidaz- ole-free minus imidazole-titrated forms, as described in Experimental procedures. In the same way, azide binding to heme–GmHO-1 was also examined. In this case, a clear isosbestic point was observed at 412 nm, the azide-free between the Soret band maxima of form at 405 nm and of the azide-bound form at 421 nm, so the relative amounts of the nonbound and azide-bound forms were estimated directly from the these maxima (data not values of absorbance at shown). The estimated association constants for imi- dazole and azide binding to heme–GmHO-1 are sum- marized and compared with those for heme–SynHO-1 and heme–rHO-1 in Table 3.
Heme degradation by GmHO-1
To establish the physiologic electron-donating system in the higher-plant HO reaction, the heme–GmHO-1 reaction was carried out in the presence of NADPH coupled with FNR ⁄ Fd (Fig. 5B). After addition of NADPH, the Soret band maximum of heme–GmHO-1 immediately shifted from 405 to 415 nm, and at the same time, distinct absorption bands of oxyheme appeared at 540 and 579 nm. Then, a broad band appeared at around 660 nm, and was maximal 9–12 min after initiation of the reaction. The spectral features of the final reaction mixture were analogous, but not iden- tical, to those of the ascorbate reaction, which was mainly due to free biliverdin, probably because of the overlapping of absorption bands of the intermediate complexes. Product analysis by HPLC revealed that only the a-isomer of biliverdin IX was produced in both the NADPH ⁄ FNR ⁄ Fd-supported and ascorbate-assis- ted GmHO-1 reactions (data not shown). Catalase did not affect the heme–GmHO-1 reaction in the presence of either ascorbate or NADPH ⁄ FNR ⁄ Fd. The apparent initial heme degradation rate in the presence of
Heme degradation by HOs can be monitored through the changes in optical absorption spectra, because
FEBS Journal 273 (2006) 5384–5399 ª 2006 The Authors Journal compilation ª 2006 FEBS
5389
Scheme 1. Pathways of heme degradation by heme oxygenase (HO), elucidated for the mammalian HO-1. Most HOs other than those of mammalian origin are also known to cleave heme at the a-meso position selectively to produce biliverdin IXa.
T. Gohya et al. Heme catabolism by soybean heme oxygenase-1
Table 4. Apparent rates of initial heme degradation (v) by GmHO-1, SynHO-1 and rHO-1 in the presence of ascorbate, NADPH ⁄ FNR ⁄ Fd (for GmHO-1 and SynHO-1), and NADPH ⁄ CPR (for rHO-1). The con- centration of reactants in 0.1 M KPB (pH 7.0) are: sodium ascor- bate, 6 mM; heme–HO, 5 lM; Fd, 1 lM; FNR, 0.22 lM; CPR, 0.25 lM; and NADPH of indicated equivalent.
Protein
GmHO-1 v (lMÆmin)1) SynHO-1 v (lMÆmin)1) rHO-1 v (lMÆmin)1)
Ascorbate (1200 eq.) NADPH (4 eq.) NADPH (8 eq.) 0.17 0.26 0.41 0.051 0.35 0.39 0.63 0.52 –
Bilirubin assay of the heme oxygenase activity of GmHO-1
In mammalian HO reactions, the end-product, biliver- din IXa, is further reduced to bilirubin by NADPH: biliverdin reductase (BVR; EC 1.3.1.24). To estimate the yield of free biliverdin produced by the GmHO-1 reaction, the bilirubin assay was carried out by use of rat BVR. The overall yields of bilirubin after the heme conversion followed by biliverdin reduction under dif- ferent conditions were estimated and compared with the bilirubin yields for SynHO-1 or rHO-1 reactions under comparable conditions (Table 5). Bilirubin yields were somewhat low for GmHO-1 and SynHO-1, but were comparable ((cid:2) 50%) for the three HOs when des- ferrioxamine, a chelating agent of Fe3+, was applied to assist the extraction of Fe3+ from the ferric biliverdin– HO complexes. Interestingly, when an excess amount of ascorbate was used as a reducing agent, the bilirubin yield in the GmHO-1 reaction was as high as 47%.
Detection of CO liberation and identification of reaction intermediates
Plausible verdoheme and CO–verdoheme intermediates were not detected in the course of heme degradation
Table 5. Bilirubin yields (%) in the heme conversion by HO coupled with the biliverdin conversion by BVR. Fig. 5. Heme conversion by GmHO-1. (A) Spectra were recorded at the indicated time after addition of ascorbate (6 mM) to the solution of heme–GmHO-1 (5 lM in 0.1 M KPB, pH 7.0). (B) Spectra were recorded at the indicated times after addition of NADPH (40 lM) to the solution of heme–GmHO-1 (5 lM; 0.1 M KPB, pH 7.0), FNR (0.22 lM), and Fd (1 lM). Proteins
GmHO-1 SynHO-1 rHO-1
28 28 44
50 42 47
a Additional NADPH and BVR were supplied 45 min after the first addition of NADPH (4 eq.). b Desferrioxamine and BVR were sup- plied 20 min and 30 min after addition of NADPH, respectively.
NADPH (4 eq.) + NADPH (8 eq.) ⁄ BVRa NADPH (20 eq.) + desferrioxamine (1.1 mg) + BVRb Ascorbate (2400 eq.) 47 – –
NADPH ⁄ FNR ⁄ Fd of GmHO-1 was also compared with that of SynHO-1 under similar conditions, as well as that of rHO-1 in the presence of NADPH ⁄ cyto- chrome P450 reductase (CPR; NADPH:cytochrome P450 reductase; EC 1.6.2.4) (Table 4). This result sug- gests that the GmHO-1 reaction occurs as fast as the SynHO-1 reaction, supported by the NADPH ⁄ FNR ⁄ Fd reducing system, and as fast as the rHO-1 reaction sup- ported by the NADPH ⁄ CPR reducing system under similar conditions.
FEBS Journal 273 (2006) 5384–5399 ª 2006 The Authors Journal compilation ª 2006 FEBS
5390
T. Gohya et al. Heme catabolism by soybean heme oxygenase-1
Fig. 6. Detection of CO produced during the GmHO-1 reaction by the H64L mutant of myoglobin (A, B) and detection of CO–verdoheme pro- duced in the GmHO-1 reaction under CO (C, D). (A) Difference spectra of optical absorption spectra obtained for the reaction of heme– GmHO-1 (5 lM) in the presence of H64L (4 lM) minus those for the reaction of H64L (4 lM) alone, after addition of ascorbate (6 mM) at appropriate times. (B) Difference spectra obtained for the reactions described in (A), except that NADPH (10 lM), FNR (0.22 lM) and Fd (1 lM) were used in place of ascorbate. (C) Spectra obtained for the reaction of heme–GmHO-1 (5 lM) with ascorbate (6 mM). (D) Spectra obtained for the reaction of heme–GmHO-1 (5 lM) with FNR (0.22 lM), Fd (1 lM), and NADPH (40 lM). All solutions were in 0.1 M KPB (pH 7.0).
GmHO-1 in the presence of either ascorbate (Fig. 6A) or NADPH ⁄ FNR ⁄ Fd (Fig. 6B).
by GmHO-1 by optical absorption spectrometry (Fig. 5). To ascertain the liberation of CO, this reac- tion was performed in the presence of H64L, a myo- globin mutant with 40 times greater affinity for CO than the wild type [22]. As shown in Fig. 6A,B, the difference spectra, the spectra obtained in the presence minus those obtained in the absence of H64L, show an absorption peak at 423 nm, which is known to be spe- cific for the CO-bound form of myoglobin, thereby proving liberation of CO in the heme conversion by
Next, to determine whether verdoheme is produced in the GmHO-1 reaction, this reaction was performed under a CO atmosphere. The high partial pressure of CO should enhance coordination of CO to the verdo- heme if it is produced. As shown in Fig. 6C, when ascorbate was added to the heme–GmHO-1 solution presaturated with CO in a sealed cuvette, the Soret band maximum shifted from 405 to 420 nm, and peaks
FEBS Journal 273 (2006) 5384–5399 ª 2006 The Authors Journal compilation ª 2006 FEBS
5391
T. Gohya et al. Heme catabolism by soybean heme oxygenase-1
and instead,
Fig. 7. Heme degradation by GmHO-1 in the presence of H2O2. Spectra were recorded at the indicated times after addition of H2O2 (40 lM in N2-saturated 0.1 M KPB) to the heme–GmHO-1 solution (5 lM in N2-saturated 0.1 M KPB).
concomitantly appeared at 539 and 571 nm, indicating formation of the CO-combined heme–GmHO-1 com- plex (Table 1). Injection of oxygen gas into this cuvette decreased the Soret band so that it almost vanished an absorption peak 30 min, after appeared at 637 nm, suggesting the formation of CO–verdoheme. The 637 nm band disappeared gradu- ally and was replaced by a new broad band with a identical to the maximum at approximately 675 nm, absorption band of free biliverdin. The heme–GmHO-1 reaction under a CO atmosphere was also carried out with the NADPH ⁄ FNR ⁄ Fd reducing system (Fig. 6D). the 637 nm band was not In this case, however, observed, but a broad band with a maximum at around 657 nm appeared. Therefore, in the presence of ascor- bate (Fig. 6C), verdoheme is probably produced, but in the presence of NADPH ⁄ FNR ⁄ Fd, formation of the verdoheme intermediate is still unclear because the 657 nm band is different from that of the well-known verdoheme or CO–verdoheme bands at 688 and 637 nm, respectively [23].
appeared
region
visible
the
in
Heme degradation by HO is driven by hydrogen peroxide, which substitutes for molecular oxygen and probvides electrons to convert heme into verdoheme [24]. Therefore, heme–GmHO-1 was reacted with H2O2 to ascertain whether verdoheme was actually produced. Soon after addition of H2O2 to the heme– GmHO-1 solution, the Soret band intensity diminished to nearly one-third and a relatively strong broad (kmax ¼ band 660 nm) (Fig. 7). This 660 nm band is very similar to that observed in heme degradation by GmHO-1 in the presence of NADPH ⁄ FNR ⁄ Fd (Figs 5B and 6D), sug- gesting that the same intermediate, namely the 660 nm species, is accumulated.
Fig. 8. Optical absorption spectra of the intermediates of heme– HO reactions. (A) Obtained from the reaction mixture of heme– GmHO-1 with H2O2 (6 eq. of the heme) under anaerobic condi- tions. (B–D) Acetone extracts containing excess imidazole from the reaction mixtures of the heme–HO-1 complexes with H2O2 (6 eq.) in anaerobic conditions.
the acetone extracts (Fig. 8C,D) showed spectra of similar features, indicating a common chromophore. In conclusion, it has been confirmed that the 660 nm
To isolate and identify the 660 nm species, the heme– GmHO-1 reaction was carried out with six equivalents of H2O2 under anaerobic conditions, to avoid the degra- dation or successive conversion of the intermediate by oxygen. The green pigment was extracted from the reac- tion product with acetone containing imidazole. The spectrum of the extract is shown in Fig. 8B, exhibiting peaks at 404, 534, 636 and 684 nm; the latter two differ from the 660 nm band of the protein complex (Fig. 8A). When the solution of the extract was exposed to CO, the 684 nm band gradually shifted to 636 nm. The reported band maxima of bis-imidazole-coordinated verdoheme are 400, 536 and 685 nm [23], so the spectra shown in Fig. 8B are considered to be a mixture of a CO-coordi- nated monoimidazole complex and a bis-imidazole com- plex of verdoheme. Using the same methods, extracts of the H2O2 reaction intermediates of heme–SynHO-1 and heme–rHO-1 were obtained. The optical absorption
FEBS Journal 273 (2006) 5384–5399 ª 2006 The Authors Journal compilation ª 2006 FEBS
5392
T. Gohya et al. Heme catabolism by soybean heme oxygenase-1
species produced in the course of heme degradation by GmHO-1 is verdoheme.
Discussion
Homology and heme binding
interacts with respective Asp residues molecule (Asp140 of rHO-1 and Asp131 of Syn HO-1) in the distal helix through hydrogen-bonding networks via water molecules in crystals [25,27]. Unfortunately, the resolution of the reported crystal structures of heme– SynHO-1 and rHO-1 is not sufficiently high to allow accurate quantitative comparison of the length of the hydrogen-bonding network, so the reason for such a large difference in pKa values is unclear. In GmHO-1, the corresponding residue to the Asp is His150, which is also competent as a partner of the indirect hydrogen bonding with the heme-bound water. This difference in the hydrogen-bonding counterpart would also affect the pKa value.
ligand of
Estimation of the secondary structure of GmHO-1 sug- gests that, in spite of low homology in the amino acid sequence, GmHO-1 protein should consist of eight a-helices common to other HOs whose crystal struc- tures are known [3,25–29] (Fig. 1). A recent modeling study on pea HO-1 also suggested a similar structure [12]. In GmHO-1, however, a critical residue for HO activity, the proximal His, which fixes heme to the heme pocket of the enzyme and participates in the is not at the position in which activation of heme, it is present in SynHO-1 (His17) or rHO-1 (His25). Instead, there is only one His (His30) in the predic- ted proximal A-helix region (Fig. 1). Experiments on heme binding to GmHO-1 have demonstrated 1 : 1 stoichiometry, and the result of EPR investigations of nitrosylheme–GmHO-1 indicate a nitrogenous proxi- mal the heme, whereas the heme–H30G complex shows neither a proximal protein ligand (Fig. 4) nor HO activity. These findings have firmly established that His30 of GmHO-1 is the proximal heme ligand.
The EPR parameters of the nitrosylheme–HO com- plexes also give useful information on the heme pocket structure. As shown in Table 2, the hyperfine splitting constants of the 15N nucleus of the distal NO and of the 14N nucleus of the proximal His of the GmHO-1 complex are closer to those of the rHO-1 complex than to those of the SynHO-1 complex. Thus, Fe–N(O) r-bonding in heme–GmHO-1 might be comparably strong to that in heme–rHO-1 [15]. The strength of the Fe–N(His) bonding in the GmHO-1 and in rHO-1 complexes also appears to be the same, thereby imply- ing that the imidazole part of His30 is neutral and probably forms a hydrogen bond with Gln34, such that His25 of rHO-1 is stabilized by the hydrogen bonding with Glu29.
Coordination structure of heme–GmHO-1
Characterization of the heme pocket of GmHO-1 by exogenous ligand binding
The optical absorption data for the GmHO-1 complex in ferric, ferrous, oxy and CO-bound forms of heme show that the coordination structure of the heme is generally like that of SynHO-1 or rHO-1 (Fig. 2 and Table 1). The EPR spectrum of the ferric resting form of heme–GmHO-1, however, shows that the rhombic anisotropy is relatively large and close to that in the ferric a-hydroxyheme complex of rHO-1 [30]. This means that the ligand field on the heme plane is relat- ively anisotropic in GmHO-1. For this reason, it is possible that the surrounding helices exert a greater anisotropic ligand field effect on the heme plane than the corresponding residues in SynHO-1 and rHO-1, the amino acid sequences of which are considerably different from that of GmHO-1.
The observed acid–base transition strongly suggests that the sixth, distal ligand of heme is a water mole- cule, and the heme-bound water is supposed to be con- nected to dissociable distal residue(s) through direct or indirect hydrogen bonding. The estimated pKa value of 8.2 is between the values of heme–rHO-1 (7.6) and heme–SynHO-1 (8.9); in the latter two, the distal water
Azide, like imidazole, is a ligand with both r-donor and p-donor characteristics, but is a relatively stron- ger p-donor for stabilization of the higher oxidation states of metal ions. In agreement with this, the bind- ing constants for the binding of azide to ferric heme– HOs are one to two orders larger than those for imidazole (Table 3). Comparison of the Kazide values shows that heme–GmHO-1 and heme–SynHO-1 have smaller values suggesting weak than heme–rHO-1, relevance of the similarity in the amino acid sequences of distal helices. This difference does not necessarily mean that the ferric character of the former two is less than that of the latter, because polarity of the heme milieu as well as the steric conditions of the distal heme pocket could also affect Kazide. Polar resi- dues might either stabilize the azide coordinated to heme or facilitate the access of anionic azide to the heme, and conversely, the steric effect of the distal residues might reduce the accessibility of azide. The amino acid residues comprising the presumed distal
FEBS Journal 273 (2006) 5384–5399 ª 2006 The Authors Journal compilation ª 2006 FEBS
5393
T. Gohya et al. Heme catabolism by soybean heme oxygenase-1
version of heme–GmHO-1 to verdoheme–GmHO-1, as is the case for other heme–HO complexes (Fig. 7) [24]. Consequently, GmHO-1 has been established to be an HO that site-specifically oxygenates and cleaves heme into biliverdin IXa, CO and free iron in a manner sim- ilar to mammalian HO enzymes (Scheme 1).
helix of GmHO-1 include several hydrophobic amino acids, and the distal side of the heme pocket of Syn- HO-1 has been reported to be less polar in total than that of rHO-1 [27]. Thus, the less polar characteristics of the heme pocket of GmHO-1 might be associated with the smaller values of Kazide for GmHO-1 and SynHO-1, and with the ferric character of the heme.
the approach of
The Kimidazole values of the three kinds of heme– HO-1 complexes are very different, and that of heme– rHO-1 is strikingly large. The Kimidazole might reflect the magnitude of the vacancy in the distal side or the steric hindrance at the opening of heme pockets, due imidazole molecules, to the relatively large size of although flexibility of the distal pocket would also affect it. Comparison of the opening side of heme pockets in crystal structures shows that Ile137 of SynHO-1 droops over the heme distal site, whereas the corresponding Val146 of rHO-1 is located relatively high above the distal side of heme (as is also true in human HO-1) [3,25,27]. The difference in Kimidazole between heme–SynHO-1 and heme–rHO-1 may be attributable to this structural difference. As shown in Fig. 1, the presumed A-helix of GmHO-1 is 3–4 turns longer than the A-helices of SynHO-1 and rHO-1. Fur- thermore, the assumed F-helix, corresponding to the distal helices of SynHO-1 and rHO-1, is also relatively long, suggesting a unique structure of the opening of the heme pocket of GmHO-1. Such a structure might inhibit imidazole to the heme in GmHO-1, explaining the smallest Kimidazole value.
The initial heme degradation rate of GmHO-1, indi- cated in Table 4, is comparable to that of SynHO-1 in the presence of NADPH, FNR, and Fd, and also to that of rHO-1 in the presence of NADPH and CPR. Here, NADPH ⁄ CPR has been established to be the physiologic electron-donating system for mammalian HO. The yield of ferric biliverdin in the heme–GmHO- 1 reaction in the presence of NADPH ⁄ FNR ⁄ Fd is inferred to be also comparable to that in the heme– rHO-1 reaction, because chelating of the ferric iron the GmHO-1 and enhances the bilirubin yield of SynHO-1 reactions to a similar level as that with the rHO-1 reaction (Table 5). The lower yield of bilirubin in the GmHO-1 and SynHO-1 reactions in the pres- ence of NADPH ⁄ FNR ⁄ Fd probably occurs due to reduction of ferric biliverdin to yield ferrous ion being less efficient with the limited number of electrons sup- plied from NADPH. Accordingly, it can be concluded that GmHO-1 is fully active when electrons are sup- plied successively from NADPH by way of FNR and Fd to the combined heme in the presence of molecular oxygen. This finding is inconsistent with previous reports that cyanobacterial or plant HO reactions require an additional reducing agent such as ascorbate [9,12,17].
Mechanism of heme degradation by GmHO-1
characteristic
the
Although some of the details are still unknown, the degradation of heme by HO follows the mechanism shown in Scheme 1. Heme catabolism by mammalian HO proceeds sequentially by way of oxyheme, hydroxyheme, verdoheme and ferric biliverdin, and the presence of each intermediate is monitored by respect- ive specific absorption bands. Heme catabolism by HOs of mammals, pathogenic bacteria, cyanobacteria and probably insects is considered to have a similar absorption mechanism, because bands of verdoheme and CO–verdoheme are observed or CO produced is detected [1,5,15,16,31,32].
In heme degradation by GmHO-1, it has been con- firmed that the final product is biliverdin IXa in the presence of either ascorbate or NADPH ⁄ FNR ⁄ Fd. The oxyheme is apparently observed in the time-dependent spectra in Fig. 5B, and CO excision from heme has the intermediate with been verified. Furthermore, kmax ¼ 660 nm has been confirmed to be verdoheme (Figs 6 and 8). Hydrogen peroxide also drives the con-
heme–HO-1
ferric
We propose that the NADPH ⁄ FNR ⁄ Fd reducing system could be the native electron-donating partner in the GmHO-1 reaction in plastids, as well as in the SynHO-1 reaction in the cytosol. Although ascorbate, which is abundant in plant tissues (repor- ted to be present at 1–20 mm [33]), probably contri- butes to some extent to the efficient reduction of the ferric ion and extraction of biliverdin from the ferric biliverdin–enzyme complex, it is unlikely that ascor- bate initiates the heme–GmHO-1 reaction as a physi- ologic electron donor. Kinetic experiments show that the first step of heme degradation by GmHO-1 and SynHO-1 is obviously slower than that by rHO-1 in the presence of ascorbate (Table 4). This means that the first reduction of the ferric heme is harder to achieve in the GmHO-1 and SynHO-1 reactions than in the rHO-1 reaction (Scheme 1), and that the first step of heme conversion is rate-limiting in the ascor- bate-supported GmHO-1 reaction (Fig. 5A). Even for mammalian HO-1, the reducing ability of ascorbate is known to be thermodynamically insufficient to (E¢Asc ¼ + 80 mV vs. reduce
FEBS Journal 273 (2006) 5384–5399 ª 2006 The Authors Journal compilation ª 2006 FEBS
5394
T. Gohya et al. Heme catabolism by soybean heme oxygenase-1
Eheme–human HO-1 ¼ ) 65 mV, at pH 7.4 and 25 (cid:2)C) [34]. We consider that this high resistance to the reduction of heme is disadvantageous to the plant HOs if they utilize ascorbate as the reducing agent for HO reactions.
Low CO affinity of heme–GmHO-1
to Ser250 without the N-terminal transit region and with unique sites for the restriction enzymes NdeI, BstEII, BglII, EagI, NcoI and HindIII. First, a 50-bp double-stranded synthetic oligonucleotide with unique sites for the afore- mentioned restriction enzymes was ligated between the NdeI and HindIII sites of a T7-promotor-based bacterial expres- sion vector pMW172, to make a plasmid tentatively referred to as pMW-A. Ten oligonucleotides and their complements, 44–91 nucleotides in length, were synthesized to construct a 681-bp synthetic gene coding for the mature- type GmHO-1 from the ATG initiation codon to the TAA stop codon. Each nucleotide was phosphorylated with T4 polynucleotide kinase, and then annealed with its comple- ment to make a double-stranded DNA, e.g. Oligo I to Oligo X. Oligo I was designed so that the 5¢-end could be ligated to the NdeI site, whereas its 3¢ cohesive end was complementary to the 5¢-end of Oligo II. The 3¢-end of Oligo II could be ligated to the BstEII site. Similarly, the 5¢-ends of Oligos III, V, VII and IX were designed to ligate to the BstEII, BglII, EagI and NcoI sites, respectively, and their 3¢-ends had sequences for ligation to the 5¢-ends of Oligo IV, VI, VIII and X. The 3¢-end of Oligo X had a sequence designed to ligate to the HindIII site. To complete the GmHO-1 expression vector pMWGmHO-1, double- stranded Oligo I to Oligo X were ligated step by step into the restriction enzyme sites of pMW-A.
To construct an expression plasmid for the H30G mutant of GmHO-1, PCR was used according to the method of Nelson and Long [36].
The nucleotide sequence was determined with an Applied Biosystems (Foster City, CA, USA) 373A DNA sequencer.
Expression of GmHO-1 and purification
cultures were
It has been reported that heme catabolism by mamma- lian HOs under a CO atmosphere stops at the CO– verdoheme stage, due to the high affinity of CO for the verdoheme [35]. In contrast to this, in the NADPH ⁄ FNR ⁄ Fd-assisted heme–GmHO-1 reaction performed under a CO atmosphere, CO-bound verdo- heme was not detected (Fig. 6D), and in the ascorbate- supported reaction, CO–verdoheme was observed only momentarily (Fig. 6C). Thus, the affinity of verdoh- eme–GmHO-1 for CO appears to be very low. The optical absorption spectrum of verdoheme–GmHO-1 is unique, having a broad absorption band with a maxi- mum at 660 nm (Fig. 7), not at the 686 nm of verdoh- eme–rHO-1 [23]. Therefore, the electronic state of the verdoheme and accordingly the axial coordination structure of verdoheme in GmHO-1 seem to be unu- sual. A resonance Raman study on verdoheme–rHO-1 suggested that verdoheme is in the six-coordinate state with the proposed ligand of hydroxide or water [23], so that the sixth ligand of verdoheme–GmHO-1 might be different from that of known HO complexes of verdoheme. The stronger distal coordination should result in weaker affinity of CO for verdoheme. In the ascorbate-supported reaction, such distal coordination onto verdoheme is not discernible, and instead, in transient CO coordination is a CO atmosphere, observed. This is probably because the verdoheme is accumulated less, due to the limitation on verdoheme generation imposed by the first step of heme conver- sion. Furthermore, a large excess of ascorbate might be advantageous for verdoheme degradation, by redu- cing verdoheme accumulation. To address coordina- tion of the distal ligand onto verdoheme–GmHO-1, site-directed mutations of possible distal residues are being studied.
A 5 mL inoculum in LB medium (+ 50 lgÆmL)1 ampicil- lin ⁄ 0.1% glucose) was prepared from a plate of trans- formed E. coli BL21 (DE3) cells carrying pMWGmHO-1. Five-hundred-milliliter inoculated with 200 lL of the inoculum and grown in LB medium (+ 200 lgÆmL)1 ampicillin) at 37 (cid:2)C until the A600 nm reached 0.8–1.0. The cells were grown for an additional 24 h at 25 (cid:2)C, harvested by centrifugation at 5000 g for 10 min using a Kubota RA-3 rotor (Tokyo, Japan), and stored at ) 80 (cid:2)C prior to use. The typical yield of cells from a 500 mL culture was 1.7 g.
Experimental procedures
Construction of expression vector pMWGm HO-1
GmHO-1 expression vector pMWGmHO-1 was constructed in the same way as pMWSynHO-1 or pMWSynHO2, described previously [14,15]. According to the reported amino acid sequence of GmHO-1 [8], we designed a nucleo- tide sequence encoding a mature-type enzyme from Ser26
The E. coli cells (10 g), resuspended in 90 mL of 50 mm (pH 7.4, + 2 mm EDTA), were lysed Tris ⁄ HCl buffer [2 mg lysozymeÆ(g cells))1] with stirring at 4 (cid:2)C for 30 min. After sonication (Branson 450 Sonifire, Danbury, CT, USA) and centrifugation at 100 000 g for 1 h using a Hitachi RP50T rotor (Tokyo, Japan), the resulting superna- tant was covered with a 60–90% ammonium sulfate frac- tion and centrifuged at 12 000 g for 15 min using a Kubota RA-3 rotor. The subsequent precipitates, containing the GmHO-1 protein, were dissolved in 20 mm potassium
FEBS Journal 273 (2006) 5384–5399 ª 2006 The Authors Journal compilation ª 2006 FEBS
5395
form with NADPH (1 eq.) ⁄ FNR ⁄ Fd and exposing the reduced complex to small amount of oxygen gas.
The pH titration was performed using 1 m Tris ⁄ HCl for pH 6.5–8.3 and 1 m NaOH solution for buffer pH 8.3–11.4; aliquots were added to heme–GmHO-1 (8 lm) in 18 mm KPB (pH 6.00), and the pKa value was estimated according to the published method [14].
phosphate buffer (KPB) (pH 7.4) and applied to a Sepha- dex G-75 column (3.6 · 50 cm), pre-equilibrated with the same buffer. The protein fractions eluted in the KPB, with an intense 26 kDa band on SDS ⁄ PAGE, were collected and directly loaded onto a column of DE-52 (2.6 · 28 cm). The column was washed with 50 mL of 20 mm KPB (pH 7.4) ⁄ 50 mm KCl, and the protein was eluted with 400 mL of 20 mm KPB (pH 7.4), using a linear gradient of 50–250 mm KCl. Only fractions with a single band at 26 kDa on SDS ⁄ PAGE were collected.
T. Gohya et al. Heme catabolism by soybean heme oxygenase-1
Other proteins
The following proteins were expressed in E. coli and purified to apparent homogeneity on SDS ⁄ PAGE accord- ing to the methods described in each reference: SynHO-1 [15], a truncated form of rat HO-1 [37], H64L mutant of [39], maize myoglobin [38], maize ferredoxin type III FNR [40], a truncated form of human CPR [41], and rat BVR [42].
Heme binding and preparation of heme–GmHO-1
the
Azide binding was carried out by addition of azide solu- tions (0.1 or 1 m) to 2 mL of heme–GmHO-1 solution (5 lm), followed by incubation for 10–15 min on ice after each addition. Optical absorption spectra were recorded after each addition of azide, and the absorbance values at 405 and 419 nm were monitored to estimate the mole frac- tions of azide-free and azide-bound forms of the complex, respectively. Then both mole fractions were plotted against the concentration of azide of each solution. The intersection point corresponding to the mole fraction of 0.5 of the respective forms gives the amount of azide necessary to attain the equilibrium, thereby giving the equilibrium con- stant for azide binding, Kazide. Imidazole binding was also performed in a similar way with the use of 5 m or 10 m imi- dazole stock solutions. Kimidazole was estimated on the basis of the mole fractions of imidazole-free and imidazole-bound forms, which were estimated from the values of absorbance at 402 and 420 nm, respectively, in the difference spectra of imidazole-free minus imidazole bound forms.
EPR spectra were recorded on a Bruker (Karlsruhe, Germany) E500 spectrophotometer, operating at 9.35– 9.55 GHz, and at 6–8 K for ferric heme complexes or 20– 20 K for nitrosylheme complexes, with an Oxford liquid helium cryostat (ESR900) (Oxford, UK). The 15NO-bound form of heme–GmHO-1 was prepared by adding dithionite to the solution of heme–GmHO-1 containing Na15NO2 in an EPR tube made of extra-pure synthetic quartz.
Heme conversion and kinetic measurements
To determine stoichiometry of heme binding to GmHO-1, 24 lL of a 200 lm protein solution (0.1 m KPB, pH 7.0) was titrated with each 2 lL of a 400 lm hemin solution, prepared by diluting 2 mm alkaline solution (NaOH, 10 mm) in 0.1 m KPB (pH 7.0). Absorbance at 405 nm was recorded for each addition of the hemin solu- tion to construct titration curves vs. the volume of added hemin solution. Separately, the absorbance at 405 nm of each free hemin solution was measured, and these were plotted together with that of the corresponding hemin– protein solutions. The equivalent was determined at an inflection point of the titration curve. Reconstitution of heme–GmHO-1 was carried out by adding a small excess of hemin to the protein solution, and then removing the excess hemin with a Sephadex G-25 column pre-equilibrated with 0.1 m KPB (pH 7.0).
Optical absorption and EPR spectroscopy
and A404,
for for
Protein solutions were in 0.1 m KPB (pH 7.0), unless other- wise specified. Heme conversion reactions in the presence of sodium ascorbate were started by adding appropriate amounts of sodium ascorbate solution (1 m) to the heme– GmHO-1 solution (5 lm). When NADPH ⁄ FNR ⁄ Fd was used as a reducing system, the reaction was started by addi- tion of a given amount of NADPH (5–15 mm in 0.1 m KPB, pH 7.0) to the solution of heme–GmHO-1 (5 lm), Fd (1 lm), and FNR (0.22 lm), or to the solution of rHO-1 (5 lm) and CPR (0.22 lm). Optical absorption spectra of the reaction mixtures were recorded between 240 and 900 nm at appropriate time intervals until the HO reaction was completed. The initial rate of heme degradation was estimated from the decreasing rate of the Soret band (A405, e ¼ 127 mm)1Æcm)1 for heme–GmHO-1, A402, e ¼ 128 mm)1Æcm)1 e ¼ heme–SynHO-1, 140 mm)1Æcm)1 the molar heme–rHO-1, where
All of the optical absorption spectra were recorded on a Shimadzu (Tokyo, Japan) UV-2200 spectrophotometer at 25 (cid:2)C. Protein solutions were in 0.1 m KPB (pH 7.0), unless otherwise specified. The ferrous form of heme–GmHO-1 was obtained by the addition of an appropriate amount of anaerobic dithionite solution (1 m) to heme–GmHO-1 (5 lm) in a UV cell (Aldrich, St Louis, MO, USA) with a screwtop open-cap tube furnished with a rubber septum, under anaerobic condition. The CO-bound form was prepared by exposing the ferrous form to gaseous CO introduced into the anaerobic cuvette. The oxy form of heme–GmHO-1 was obtained by reduction of the ferric
FEBS Journal 273 (2006) 5384–5399 ª 2006 The Authors Journal compilation ª 2006 FEBS
5396
analysis of reaction products was performed as previously described [32]. Homology calculations were executed on genetyx-mac network version 14.0.3.
T. Gohya et al. Heme catabolism by soybean heme oxygenase-1
Acknowledgements
absorption coefficients were all determined by the pyridine hemochrome method, using A557, e ¼ 34.4 mm)1Æcm)1). Heme conversion by GmHO-1 in a CO atmosphere was carried out in the aforementioned anaerobic UV cell. The reaction was initiated by the addition of O2 (1 mL) with a syringe.
Bilirubin assay
This work was supported in part by grants-in-aid from the Ministry of Education, Science, Culture and Sports, Japan (18570140 for CTM and 16580108 for TY).
The bacterial expression vector pMW172 was a gift from Dr K. Nagai, MRC Laboratory of Molecular Biology, Cambridge, UK. The expression plasmid for the myoglobin mutant H64L was a gift from Professor J. S. Olson, Rice University. E. coli expression plas- mids for maize FNR and maize Fd III were gifts from Professor T. Hase, Osaka University. The cDNA of human CPR was a gift from Dr F. Gonzalez, NIH.
References
Heme degradation by GmHO-1 or SynHO-1 (each 5 lm in 0.1 m KPB, pH 7.0) was conducted in the presence of NADPH ⁄ FNR ⁄ Fd (20 lm, 0.22 lm, 1 lm, respectively), and after the reaction was complete (approximately 45 min after initiation of the reactions), BVR (1 lm) and additional NADPH (40 lm) were supplied. In the rHO-1 (5 lm) reac- tion, CPR (0.2 lm) was used in place of FNR ⁄ Fd. In the ascorbate-supported reactions, the heme–enzyme solution containing BVR (1 lm) and NADPH (40 lm) was reacted with ascorbate (12 mm). The end of each reaction was con- firmed by the complete disappearance of the Soret band, and the quantity of bilirubin was determined from the A468 with e468 ¼ 55 mm)1Æcm)1 [43].
Detection of CO
1 Tenhunen R, Marver HS & Schmid R (1969) Micro- somal heme oxygenase. J Biol Chem 244, 6388–6394. 2 Yoshida T & Kikuchi G (1978) Features of the reaction of heme degradation catalyzed by the reconstitution microsomal heme oxygenase system. J Biol Chem 253, 4230–4236.
3 Schuller DJ, Wilks A, Ortiz de Montellano PR &
Poulos TL (1999) Crystal structure of human heme oxygenase-1. Nat Struct Biol 6, 860–867.
To each solution of heme–GmHO-1 (5 lm) and FNR ⁄ Fd (0.22 and 1 lm, respectively) or heme–GmHO-1 (5 lm) alone, H64L (4 lm) was added, and the heme conversion reaction was initiated by the addition of NADPH (10 lm) or ascorbate (6 mm), respectively. Optical absorption spec- tra of the reaction mixtures were recorded at appropriate time intervals. As a control experiment, the reaction of H64L with NADPH ⁄ FNR ⁄ Fd or ascorbate was carried out, and the difference spectra, in the presence minus in the absence of heme–GmHO-1, were obtained.
4 Schmitt MP (1997) Utilization of host iron sources by Corynebacterium diphtheriae: identification of a gene whose product is homologous to eukaryotic heme oxygenases and is required for acquisition of iron from heme and hemoglobin. J Bacteriol 179, 838–845.
Extraction of the 660 nm intermediate
5 Zhu W, Wilks A & Stojiljkovic I (2000) Degradation of heme in Gram-negative bacteria: the product of the hemO gene of neisseriae is a heme oxygenase. J Bacteriol 182, 6783–6790.
6 Ratliff M, Zhu W, Deshmukh R, Wilks A & Stojiljko- vic I (2001) Homologues of neisserial heme oxygenase in Gram-negative bacteria: degradation of heme by the product of pigA gene of Pseudomonas aeruginosa. J Bacteriol 183, 6394–6403.
7 Smith H (2000) Phytochromes and light signal percep- tion by plants ) an emerging synthesis. Nature 407, 585–590.
Anaerobic H2O2 solution (480 lm) was injected into 2 mL of a nitrogen-saturated solution of heme–GmHO-1 ((cid:2) 80 lm in 0.1 m KPB, pH 7.0) in a capped UV cell filled with nitrogen gas. Immediately, the color of the solution turned to green, indicating formation of the 660 nm species. Then, a concen- trated imidazole ⁄ acetone solution was added to the cell (1 : 1 v ⁄ v), and the mixture was incubated for 30 min on ice to complete the protein precipitation. The supernatant of the solution was transferred to an eppendorf tube, followed by spinning down precipitates, and used for the optical absorp- tion measurements.
Other procedures
8 Davis SJ, Bhoo SH, Durski AM, Walker JM & Viersta RD (2001) The heme-oxygenase family required for phytochrome chromophore biosynthesis is necessary for proper photomorphogenesis in higher plants. Plant Physiol 126, 656–669.
9 Muramoto T, Tsurui N, Terry MJ, Yokota A & Kohchi T
The secondary structure of GmHO-1 was obtained by use of nps@(Network Protein Sequence Analysis). HPLC
(2002) Expression and biochemical properties of a
FEBS Journal 273 (2006) 5384–5399 ª 2006 The Authors Journal compilation ª 2006 FEBS
5397
ferredoxin-dependent heme oxygenase required for phytochrome chromophore synthesis. Plant Physiol 140, 1958–1966.
acid substitution at position E7 (residue 64) on the kinetics of ligand binding to sperm whale myoglobin. J Biol Chem 265, 3168–3176.
23 Takahashi S, Mansfield Matera KM, Fujii H, Zhou H,
10 Emborg TJ, Walker JM, Noh B & Vierstra RD (2006) Multiple heme oxygenase family members contribute to the biosynthesis of the phytochrome chromophore in Arabidopsis. Plant Physiol 140, 856–868.
Ishikawa K, Yoshida T, Ikeda-Saito M & Rousseau DL (1997) Resonance Raman spectroscopic characterization of a-hydroxyheme and verdoheme complexes of heme oxygenase. Biochemistry 36, 1402–1410.
24 Wilks A & Ortiz de Montellano PR (1993) Rat liver heme oxygenase. J Biol Chem 268, 22357–22362. 25 Sugishima M, Omata Y, Kakuta Y, Sakamoto H,
11 Noriega GO, Balestrasse KB, Batlle A & Tomaro ML (2004) Heme oxygenase exerts a protective role against oxidative stress in soybean leaves. Biochem Biophys Res Commun 323, 1003–1008.
12 Linley PJ, Landsberger M, Kohchi T, Cooper JB &
Noguchi M & Fukuyama K (2000) Crystal structure of rat heme oxygenase-1 in complex with heme. FEBS Lett 471, 61–66.
26 Schuller DJ, Zhu W, Stojiljkovic I, Wilks A & Poulos
Terry MJ (2006) The molecular basis of heme oxygenase deficiency in the pcd1 mutant of pea. FEBS J 273, 2594–2606.
TL (2001) Crystal structure of heme oxygenase from the Gram-negative pathogen Neisseria meningitidis and a comparison with mammalian heme oxygenase-1. Biochemistry 40, 11552–11558.
13 Fujii H, Zhang X, Tomita T, Ikeda-Saito M & Yoshida T (2001) Role for highly conserved carboxylate, aspar- tate 140, in oxygen activation and heme degradation by heme oxygenase-1. J Am Chem Soc 123, 6475–6484.
27 Sugishima M, Migita CT, Zhang X, Yoshida T &
14 Zhou H, Migita CT, Sato M, Sun D, Zhang X,
Fukuyama K (2004) Crystal structure of heme oxyge- nase-1 from cyanobacterium Synechocystis sp. PCC 6803 in complex with heme. Eur J Biochem 271, 4517– 4525.
Ikeda-Saito M, Fujii H, Yoshida T (2000) Participation of carboxylate amino acid side chain in regiospecific oxidation of heme by heme oxygenase. J Am Chem Soc 122, 8311–8312.
28 Sugishima M, Hagiwara Y, Zhang X, Yoshida T,
15 Migita CT, Zhang X & Yoshida T (2003) Expression and characterization of cyanobacterium heme oxyge- nase, a key enzyme in the phycobilin synthesis. Eur J Biochem 270, 687–698.
Migita CT & Fukuyama K (2005) Crystal structure of dimeric heme oxygenase-2 from Synechocystis sp. PCC 6803 in complex with heme. Biochemistry 44, 4257– 4266.
16 Zhang X, Migita CT, Sato M, Sasahara M & Yoshida T
(2005) Protein expressed by the ho2 gene of the cyanobac- terium Synechocystis sp. PCC 6803 is a true heme oxyge- nase. FEBS J 272, 1012–1022.
17 Rhie G & Beale SI (1995) Phycobilin biosynthesis:
29 Hirotsu S, Chu GC, Unno M, Lee D, Yoshida T, Park S, Shiro Y & Ikeda-Saito M (2004) The crystal struc- tures of the ferric and ferrous forms of the heme com- plex of HmuO, a heme oxygenase of Corynebacterium diphtheriae. J Biol Chem 279, 11937–11947.
30 Mansfield Matera K, Takahashi H, Fujii H, Zhou H,
reductant requirements and product identification for heme oxygenase from Cyanidium caldarium. Arch Bio- chem Biophys 320, 182–194.
18 Takahashi S, Wang J, Rousseau DL, Ishikawa K,
Ishikawa K, Yoshimura T, Rousseau DL, Yoshida T & Ikeda-Saito M (1996) Oxygen and one reducing equiva- lent are both required for the conversion of a-hydroxy- heme to verdoheme in heme oxygenase. J Biol Chem 271, 6618–6624.
Yoshida T, Host JR, Ikeda-Saito M (1994) Heme–heme oxygenase complex. J Biol Chem 269, 1010–1014. 19 Chu GC, Tomita T, So¨ nnichsen FD, Yoshida T &
31 Wilks A & Schmitt MP (1998) Expression and
Ikeda-Saito M (1999) The heme complex of Hmu O, a bacterial heme degradation enzyme from Corynebacter- ium diphtheriae. J Biol Chem 274, 24490–24496.
characterization of a heme oxygenase (Hmu O) from Corynebacterium diphtheriae. J Biol Chem 273, 837–841.
20 Ito-Maki M, Ishikawa K, Mansfield Matera K, Sato M, Ikeda-Saito M, Yoshida T (1995) Demonstration that histidine 25, but not 132, is the axial heme ligand in rat heme oxygenase-1. Arch Biochem Biophys 317, 253–258.
32 Zhang X, Sato M, Sasahara M, Migita CT & Yoshida T (2004) Unique features of recombinant heme oxyge- nase of Drosophila melanogaster compared with those of other heme oxygenases studied. Eur J Biochem 271, 1714–1724.
33 Conklin PL, Gatzek S, Wheeler GL, Dowdle J,
21 Chu GC, Katakura K, Tomita T, Zhang X, Sun D, Sato M, Sasahara M, Kayama T, Ikeda-Saito M & Yoshida T (2000) Histidine 20, the crucial proximal axial heme ligand of bacterial heme oxygenase Hmu O from Corynebacterium diphtheriae. J Biol Chem 275, 17494–17500.
Raymond MJ, Rolinski S, Isupov M, Littlechild JA & Smirnoff N (2006) Arabidopsis thaliana VTC4 encodes L-galactose-1-P phosphatase, a plant ascorbic acid biosynthetic enzyme. J Biol Chem 281, 15662–15670.
22 Rohlfs RJ, Mathews AJ, Carver TE, Olson JS, Springer BA, Egeberg KD, Sligar SG (1990) The effects of amino
FEBS Journal 273 (2006) 5384–5399 ª 2006 The Authors Journal compilation ª 2006 FEBS
5398
T. Gohya et al. Heme catabolism by soybean heme oxygenase-1
39 Hase T, Mizutani S & Mukohata Y (1991) Expression of maize ferredoxin cDNA in Escherichia coli. Plant Physiol 97, 1495–1401.
34 Liu Y, Moe¨ nne-Loccoz P, Hildebrand DP, Wilks A, Loehr TM, Mauk AG & Ortiz de Montellano PR (1999) Replacement of the histidine iron ligand by a cysteine or tyrosine converts heme oxygenase to an oxidase. Biochemistry 38, 3733–3743.
40 Onda Y, Matsumura T, Kimara-Ariga Y, Sakakibara T, Sugiyama T & Hase T (2000) Differential interaction of maize root ferredoxin:NADP+ oxidoreductase with photosynthetic and non-photosynthetic ferredoxin isoproteins. Plant Physiol 123, 1037–1045.
35 Yoshida T, Noguchi M & Kikuchi G (1982) The step of carbon monoxide liberation in the sequence of heme degradation catalyzed by the reconstituted microsomal heme oxygenase system. J Biol Chem 257, 9345–9348. 36 Nelson RM & Long GL (1989) A general method of site-specific mutagenesis using a modification of the Thermus aquaticus polymerase chain reaction. Anal Bio- chem 190, 147–151.
41 Yamano S, Aoyama T, McBride OW, Hardwick JP, Gelboin HV & Gonzalez F (1989) Human NADPH- P450 oxidoreductase: complementary DNA cloning, sequence and vaccinia virus-mediated expression and localization of the CYPOR gene to chromosome 7. Mol Pharmacol 36, 83–88.
42 Kikuchi A, Park SY, Miyatake H, Sun D, Sato M,
37 Ishikawa K, Sato M, Ito M & Yoshida T (1992) Impor- tance of histidine residue 25 of rat heme oxygenase for its catalytic activity. Biochem Biophys Res Commun 182, 981–986.
Yoshida T & Shiro Y& (2001) Crystal structure of rat biliverdin reductase. Nat Struct Biol 8, 221–225.
38 Springer BA & Sligar SG (1987) High-level expression
43 Yoshida T & Kikuchi G (1978) Purification and proper- ties of heme oxygenase from pig spleen microsomes. J Biol Chem 253, 4224–4229.
of sperm whale myoglobin in Escherichia coli. Proc Natl Acad Sci USA 84, 8961–8965.
FEBS Journal 273 (2006) 5384–5399 ª 2006 The Authors Journal compilation ª 2006 FEBS
5399
T. Gohya et al. Heme catabolism by soybean heme oxygenase-1