Original
article
The
study
of
tree
fine
root
distribution
and
dynamics
using
a
combined
trench
and
observation
window
method
M. Bédéneau
D.
Auclair
INRA,
Station
de
Sylviculture,
Centre
de
Recherches
d’Orl6ans,
Ardon,
F
45160
Olivet,
France
(received
5
février
1988,
accepted
6
d6cembre
1988)
Summary —
Root
distribution
and
growth
were
studied
in
a
natural
oak-birch
coppice,
by
combining
the
trench
and
observation
window
methods.
Root
weight
was
estimated
while
digging
the
trench,
showing
that
90
percent
of
dry
weight
is
situated
in
the
upper
50
centimetres
of
soil.
Root
position
was
analyzed,
using
variograms :
a
cluster
effect
was
observed,
around
50
cm
for
old
roots
and
20
cm
for
new
roots.
Oak
and
birch
appeared
to
have
different
seasonal
root
elongation
patterns.
The
results
are
discussed
in
relation
to
the
methods
employed.
Tree -
root -
distribution -
profile -
spatial
distribution -
coppice -
birch -
oak
Résumé —
Etude
de
la
distribution
et
de
la
dynamique
des
fines
racines
combinant
les
tech-
niques
de
tranchée
et
de
fenêtre
d’observation
en
forêt.
Différentes
méthodes
ont
été
utilisées
pour
observer
in
situ
et
caractériser
le
système
racinaire
d’arbres
forestiers
dans
un
taillis
mélangé
de
chênes
et
de
bouleaux.
La
biomasse
racinaire,
estimée
au
moment
du
creusement
de
la
tran-
chée,
se
trouve
localisée
en
grande
partie
(90%)
dans
/
es
50
centimètres
supérieurs.
La
position
des
racines,
étudiée
à l’aide
de
variogrammes,
montre
des
phénomènes
d’agrégation
de
l’ordre
de
50
cm
pour
les
vieilles
racines
et
de
20
cm
pour
les
racines
jeunes.
Chêne
et
bouleau
présentent
des
vagues
de
croissance
racinaire
différentes.
Ces
résultats
sont
discutés
en
fonction
des
tech-
niques
utilisées.
Arbre -
racine -
distribution -
profil -
distribution
spatiale -
taillis -
Betula -
Quercus
Introduction
The
great
majority
of
studies
concerning
forest
tree
root
systems
has
been
carried
out
on
artificially
cultivated
young
plants.
Only
a
few
studies
have
dealt
with
adult
forest
trees,
mainly
due
to
the
conside-
rable
technical
problems
involved
(B6hm,
1979).
However,
young
seedlings
and
plantlets
have
different
growth
patterns
from
adult
trees.
Isolated
plants
in
pots,
or
in
artificial
observation
chambers,
also
differ
from
those
growing
in
natural
conditions,
due
to
differences
in
biological
(competition)
and
physical
(light,
water,
soil)
environment.
It
is
therefore
hazardous
to
make
any
gene-
ral
conclusion
from
results
obtained
in
each
laboratory
experiment.
This
may
also
explain
why
the
amount
of
experimental
data
concerning
root
development
of
larger
trees
is
rather
scar-
ce
(Persson,
1983;
Santantonio
and
Her-
mann,
1985;
Ries,
1988).
In
the
present
study,
various
observation
methods
and
techniques
are
discussed.
A
trench
and
an
observation
window
were
tested
in
order
to
estimate
root
distri-
bution
and
growth
in
a
natural
oak-birch
stand
in
central
France,
with
a
view
to
applying
this
method
to
a
coppicing
expe-
riment
(Bedeneau
and
Auclair,
in
prepara-
tion).
Materials
and
Methods
Site
The
experimental
site
was
located
at
the
INRA
experimental
station
20
km
south
of
Orléans,
France
(1.54°
E,
47.52°
N).
The
natural
forest
is
an
ancient
coppice
containing
mostly
Betula
pendula
Roth.,
Quercus
robur
L.
with
a
few
scattered
Castanea
sativa
Mill.
and
Robinia
pseudoacacia
L.
The
root
systems
are
of
un-
known
age;
the
stems
are
25
yrs
old.
The
soil
is
acid,
of
the
brown
crytopodzolic
type
with
a
moderate
humus.
It
has
developed
in
a
terrace
material
consisting
of
homometric
sand,
essentially
quartzic,
unstructured
in
the
upper
40
cm
and
rapidly
becoming
gravelly
and
heterometric.
It
can
be
characterized
as
filtering
well,
with
a
very
low
mineral
reserve.
The
study
plot
was
situated
between
Quer-
cus
and
Betula
stools,
at
least
1
m
away
from
each
stump
in
order
to
minimize
disturbance
of
the
underground
system.
A
trench
4
m
long,
1
m
wide
and
1
m
deep
was
dug
by
hand
(Fig.
1
).
Installation
On
each
side
of
the
trench
4
(1
x
1 )
m
squares
were
bordered
with
a
wooden
frame.
Each
of
these
large
squares
contained
400
(5
x
5)
cm
elementary
squares
which
were
numbered
according
to
their
horizontal
and
vertical
posi-
tion.
Coordinates
were
marked
on
the
separa-
tion
boards.
Transparent
plastic
plates
were
then
fixed
on
the
boards,
to
observe
root
elon-
gation.
Each
(1
x 1 )
m
square
was
covered
with
an
8-cm
thick
polystyrene
sheet
and
a
black
plastic
foil.
The
entire
trench
was
then
covered
with
polystyrene.
This
assembly
maintained
an
adequate
temperature
regulation.
Measurements
Several
types
of
data
were
collected :
1.
Root
weight
was
measured
while
digging
the
trench.
Dead
and
live
roots
were
carefully
and
separately
sampled
in
each
25
cm
soil
hori-
zon.
They
were
then
sorted
into
diameter
classes
(<
1
mm. 1 -2
mm,
>
2
mm),
and
oven-
dried
at
105°C.
2.
Root
position
on
each
side
of
the
trench :
in
each
elementary
(5
x
5)
cm
square,
the
roots
cut
during
the
excavation
were
counted
and
sorted
according
to :
-
age :
new/old
(difference
appreciated
by
the
colour);
-
species :
oak/birch
(difference
assessed
on
the
basis
of
general
appearance,
form,
colour).
For
each
(x,y)
coordinate
the
number
and
quality
of
roots
was
thus
obtained.
This
presen-
tation
allowed
mathematical
calculations
to
be
1 11
1
made
on
the
variable
&dquo;root
density
per
square
centimetre&dquo;.
3.
Elongation :
the
path
followed
by
the
roots
during
growth
was
drawn
on
the
transparent
plastic plates,
using
a
different
colour
for
each
observation
date.
Total
elongation
between
2
observations
was
obtained
by
following
each
coloured
line
with
an
opisometer.
This
type
of
data
was
recorded
at
irregular
intervals,
depen-
ding
on
growth,
between
March
and
December
on
each
(1
x
1 )
m
square
(4
on
the
&dquo;right&dquo;
side,
numbered
1
-
4,
and
4
on
&dquo;left&dquo;
side,
numbered
5-8).
4.
Additional
data :
to
simplify
tedious
elonga-
tion
measurements,
an
attempt
was
made
to
use
infrared
photography
and
video
recording.
These
techniques
did
not
prove
satisfactory,
mostly
due
to
the
outdoor
environmental
condi-
tions.
Results
Root
dry
weight
t
The
mean
root
dry
weight
excavated
per
cubic
metre
was
distributed
by
diameter
classes
as
follows :
-
diameter
<-
1 mm
: 41
g.m-3
-
diameter
from
1
to
2
mm :
67
g.m-3
-
diameter !
2
mm
:
395
g.m-3
-
total
root
weight
: 503
g.m-3
Table
I shows
the
distribution
by
soil
horizon.
It
was
observed
that
the
deeper
horizons
were
not
explored
by
the
roots,
as
>
90
percent
of
the
dry
weight
was
found
in
the
upper
50
cm.
This
result
agrees
with
the
soil
description :
fine
roots
did
not
develop
below
50
cm,
whereas
a
few
coarse
roots
were
observed
at
a
depth
of
75
cm.
Root
distribution
The
root
position
data
collected
on
each
side
of
the
trench
was
grouped
to
form
two
(4
x
1 )
m
grids.
Variograms
were
then
computed
for
each
grid
in
order
to
analyze
the
spatial
distribution
of
the
roots.
The
method
used
here
is
that
of
regio-
nalized
variables
developed by
Matheron
(1965)
for
prospecting
and
evaluating
geo-
logical
deposits.
It
consists
of
the
study
of
variables
F(X)
whose
values
depend
only
on
the
supporting
coordinates
X :
it
has
been
used
for
studying
competition
in
forest
plantations
(Bachacou
and
Decourt,
1976),
animal
population
distribution
(Pont,
1987)
or
soil
physical
variables
(Goulard et al.,
1987).
F(X)
is
considered
as
a
random
intrinsic
function,
thus,
for
any
vector
h,
the
mathe-
matical
expectancy
and
variance
of
the
increment
F(X
+
h) -
F(X)
are
independant
of
X
and
depend
only
on
h.
The
variogram
g(h)
is
half
the
second-
order
moment
of
the
random
function
F(X) :
g(h)
=
1 /2
E
[F(X
+
h) -
F(X)]
2
The
shape
of
the
curve
showing
g
as
a
function
of
h,
in
particular
at
its
origin,
pro-
vides
a
basis
for
describing
the
random
structure
of
the
variable
F :
-
if
g(h)
is
parabolic,
it
shows
a
great
spatial
regularity;
-
if
g(h)
is
linear
the
regularity
is
poorer;
-
if
g(h)
shows
a
discontinuity
at
the
ori-
gin
there
is
a
great
irregularity.
In
the
present
study
the
variable
is
the
number
of
roots
occurring
at
coordinates
(x,y).
A
variogram
can
be
obtained
for
each
root
parameter :
old,
new,
birch,
oak,
on
each
side
of
the
trench
(left,
right).
The
step
of
the
variogram
(h)
is
5
cm.
All
variograms
(Fig.
2)
show
that
the
curve
starts
at
approximately
half
the
line
determined
by
the
&dquo;a
priori
variance&dquo;.
This
indicates
a
cluster
effect,
varying
with
root
type
and
side
of
the
trench
= 50
cm
for
old
roots
and
20
cm
for
new
roots
(value
read
at
the
starting
point
of
the
variogram).
To
have
a
clearer
view
of
this
phenome-
non,
we
computed
a
moving
average
of
each
square
with
the
8
surrounding
squares.
The
smoothed
curves
obtained
(Fig.
3)
outline
the
cluster
points.
This
can
be
clearly
observed
at
approximately
50-cm
intervals,
in
particular
for
old
oak
roots
on
the
left
side
and
at
a
lesser
degree
for
new
roots.
Elongation
Returning
to
each
(1
x
1 )
m
square,
we
measured
the
length
of
all
new
roots
appearing
at
each
observation.
During
one
growing
season
we
thus
obtained
total
root
elongation
per
square,
on
each
side
of
the
trench
(Fig.
4).
On
the
right
side,
root
growth
began
in
March
and
reached
a
peak
in
early
July.
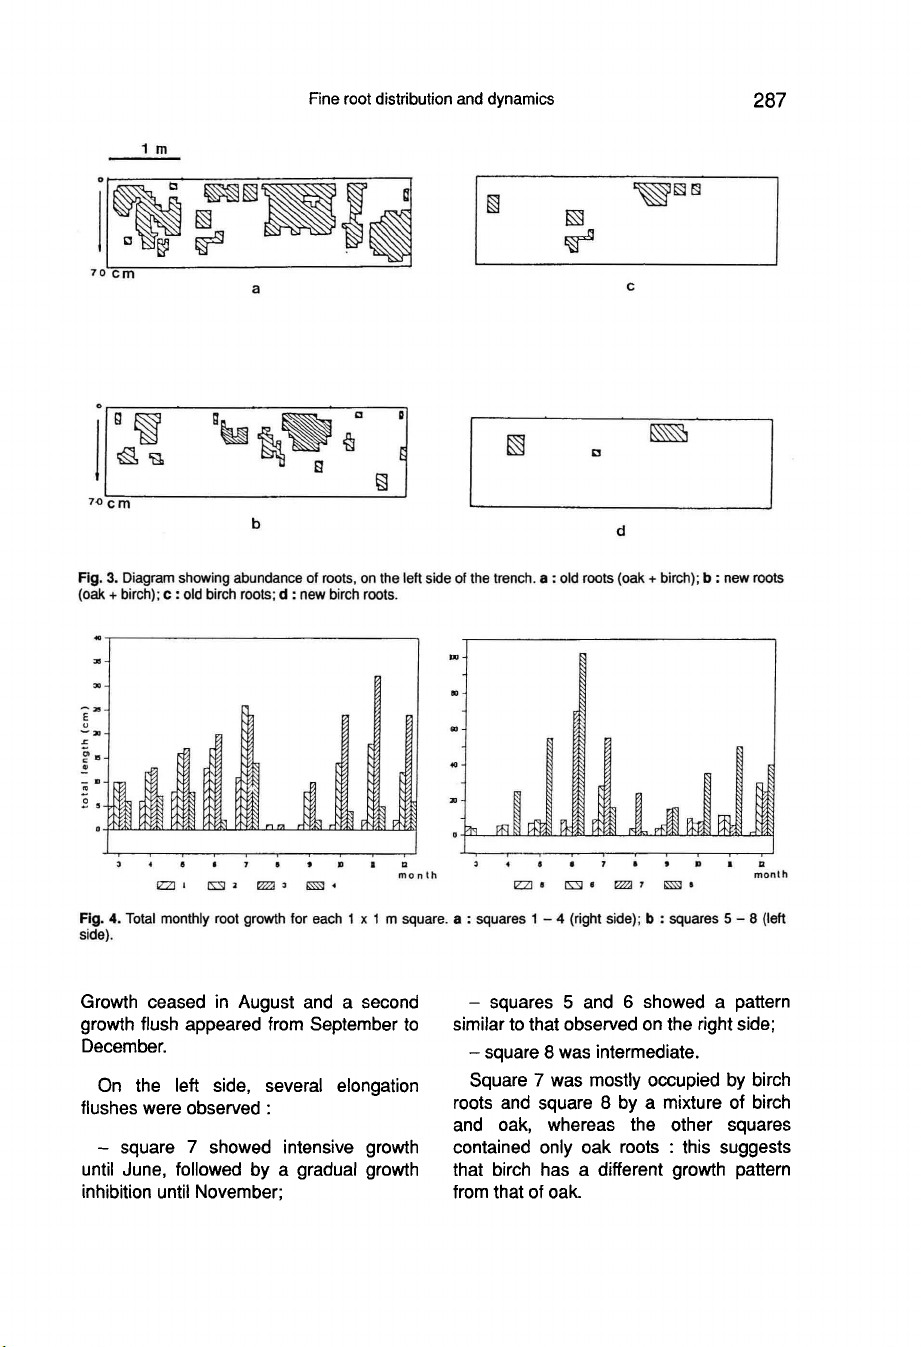
Growth
ceased
in
August
and
a
second
growth
flush
appeared
from
September
to
December.
On
the
left
side,
several
elongation
flushes
were
observed :
-
square
7
showed
intensive
growth
until
June,
followed
by
a
gradual
growth
inhibition
until
November;
-
squares
5
and
6
showed
a
pattern
similar
to
that
observed
on
the
right
side;
-
square
8
was
intermediate.
Square
7
was
mostly
occupied
by
birch
roots
and
square
8
by
a
mixture
of
birch
and
oak,
whereas
the
other
squares
contained
only
oak
roots :
this
suggests
that
birch
has
a
different
growth
pattern
from
that
of
oak.


%20--%3e%3cdefs%3e%3cstyle%3e%20.st0%20{%20fill:%20%23fff;%20}%20.st1%20{%20fill:%20%237800fa;%20}%20%3c/style%3e%3c/defs%3e%3cpath%20class='st1'%20d='M117.78,12.18H43.11c2.9,3.47,4.65,7.94,4.65,12.82,0,5.6-2.3,10.66-6.01,14.29h76.02l7.22-13.56-7.22-13.56Z'/%3e%3cg%3e%3cpath%20class='st0'%20d='M53.58,26.17h-.59v-1.46h.59v-4.96h2.83c1.78,0,2.67.94,2.67,2.82v5.76c0,1.87-.89,2.81-2.67,2.81h-2.83v-4.96ZM55.36,21.37v3.34h1.1v1.46h-1.1v3.34h1.01c.61,0,.91-.37.91-1.1v-5.93c0-.74-.3-1.1-.91-1.1h-1.01Z'/%3e%3cpath%20class='st0'%20d='M65.99,31.14h-1.8l-.31-2.07h-2.19l-.31,2.07h-1.64l1.82-11.39h2.62l1.82,11.39ZM65.28,18.04c-.25.46-.51.77-.75.94-.21.15-.47.22-.79.22-.26,0-.57-.07-.92-.22l-.38-.15c-.14-.05-.26-.07-.37-.07-.3,0-.53.18-.71.54l-.91-.68c.25-.46.51-.77.75-.94.21-.14.48-.21.79-.21.26,0,.57.07.92.21l.38.15c.14.05.26.07.37.07.3,0,.53-.18.71-.54l.91.68ZM61.91,27.52h1.73l-.87-5.76-.87,5.76Z'/%3e%3cpath%20class='st0'%20d='M74.53,26.89v1.52c0,1.91-.89,2.86-2.67,2.86s-2.67-.95-2.67-2.86v-5.93c0-1.91.89-2.86,2.67-2.86s2.67.95,2.67,2.86v1.11h-1.69v-1.22c0-.75-.31-1.12-.93-1.12s-.93.37-.93,1.12v6.15c0,.74.31,1.11.93,1.11s.93-.37.93-1.11v-1.63h1.69Z'/%3e%3cpath%20class='st0'%20d='M81.4,31.14h-1.8l-.31-2.07h-2.19l-.31,2.07h-1.64l1.82-11.39h2.62l1.82,11.39ZM75.9,19.2l1.52-1.91h1.71l1.51,1.91h-1.61l-.76-.95-.75.95h-1.61ZM77.32,27.52h1.73l-.87-5.76-.87,5.76ZM83.1,15.99l-1.76,1.91h-1.26l1.17-1.91h1.86Z'/%3e%3cpath%20class='st0'%20d='M84.86,19.75c1.78,0,2.67.94,2.67,2.82v1.48c0,1.87-.89,2.81-2.67,2.81h-.85v4.28h-1.79v-11.39h2.64ZM84.01,21.37v3.86h.85c.58,0,.87-.36.87-1.08v-1.71c0-.71-.29-1.07-.87-1.07h-.85Z'/%3e%3cpath%20class='st0'%20d='M93.51,19.75c1.78,0,2.67.94,2.67,2.82v1.48c0,1.87-.89,2.81-2.67,2.81h-.85v4.28h-1.79v-11.39h2.64ZM92.66,21.37v3.86h.85c.58,0,.87-.36.87-1.08v-1.71c0-.71-.29-1.07-.87-1.07h-.85Z'/%3e%3cpath%20class='st0'%20d='M98.8,31.14h-1.79v-11.39h1.79v4.88h2.03v-4.88h1.83v11.39h-1.83v-4.88h-2.03v4.88Z'/%3e%3cpath%20class='st0'%20d='M105.36,24.55h2.46v1.62h-2.46v3.34h3.09v1.63h-4.88v-11.39h4.88v1.63h-3.09v3.18ZM108.17,17.29l-1.76,1.91h-1.26l1.17-1.91h1.86Z'/%3e%3cpath%20class='st0'%20d='M112.2,19.75c1.78,0,2.67.94,2.67,2.82v1.48c0,1.87-.89,2.81-2.67,2.81h-.85v4.28h-1.79v-11.39h2.64ZM111.35,21.37v3.86h.85c.58,0,.87-.36.87-1.08v-1.71c0-.71-.29-1.07-.87-1.07h-.85Z'/%3e%3c/g%3e%3ccircle%20class='st1'%20cx='25'%20cy='25'%20r='20'/%3e%3cpath%20class='st0'%20d='M32.78,19.27c2.92,0,4.43,2.55,5.28,5.33l.71,2.17c.14.38-.33.75-.71.75h-5.61c.19-.33.24-.71.09-1.08l-.75-2.45c-.43-1.32-.99-2.64-1.79-3.77.75-.57,1.65-.94,2.78-.94h0ZM25,18.38c3.25,0,4.9,2.78,5.89,5.89l.76,2.45c.14.42-.33.8-.8.8h-11.69c-.42,0-.94-.38-.8-.8l.75-2.45c.99-3.11,2.64-5.89,5.89-5.89h0ZM25,11.35c1.74,0,3.11,1.37,3.11,3.11s-1.37,3.11-3.11,3.11-3.11-1.41-3.11-3.11,1.41-3.11,3.11-3.11h0ZM17.27,19.27c1.08,0,1.98.38,2.73.94-.8,1.13-1.37,2.45-1.74,3.77l-.8,2.45c-.14.38-.05.75.09,1.08h-5.56c-.42,0-.9-.38-.75-.75l.71-2.17c.9-2.78,2.41-5.33,5.33-5.33h0ZM17.27,12.91c1.51,0,2.78,1.27,2.78,2.83s-1.27,2.83-2.78,2.83-2.83-1.27-2.83-2.83,1.27-2.83,2.83-2.83h0ZM32.78,12.91c1.56,0,2.78,1.27,2.78,2.83s-1.23,2.83-2.78,2.83-2.83-1.27-2.83-2.83,1.27-2.83,2.83-2.83h0ZM27.07,28.56v.09c0,.57-.24,1.08-.61,1.46h0v.05c-.38.33-.9.57-1.46.57s-1.08-.24-1.46-.61h0c-.38-.38-.61-.9-.61-1.46v-.09h1.41v.09c0,.19.05.38.19.47v.05c.09.09.28.19.47.19s.38-.09.47-.19v-.05c.14-.09.24-.28.24-.47t-.05-.09h1.41ZM30.99,28.56v.09c0,1.65-.66,3.16-1.74,4.24-1.08,1.08-2.59,1.79-4.24,1.79s-3.16-.71-4.24-1.79l-.05-.05c-1.04-1.08-1.7-2.55-1.7-4.2v-.09h1.41v.09c0,1.27.47,2.4,1.27,3.25h.05c.85.85,1.98,1.37,3.25,1.37s2.4-.52,3.25-1.37c.85-.8,1.37-1.98,1.37-3.25v-.09h1.37ZM34.99,28.56v.09c0,2.78-1.13,5.28-2.92,7.07-1.79,1.79-4.29,2.92-7.07,2.92s-5.23-1.13-7.07-2.92c-1.79-1.79-2.92-4.29-2.92-7.07v-.09h1.41v.09c0,2.4.94,4.53,2.5,6.08,1.56,1.56,3.72,2.5,6.08,2.5s4.52-.94,6.08-2.5c1.56-1.56,2.5-3.68,2.5-6.08v-.09h1.41Z'/%3e%3c/svg%3e)