
RESEARCH Open Access
Determination of the volume-specific surface area
by using transmission electron tomography for
characterization and definition of nanomaterials
Elke AF Van Doren, Pieter-Jan RH De Temmerman, Michel Abi Daoud Francisco and Jan Mast
*
Abstract
Background: Transmission electron microscopy (TEM) remains an important technique to investigate the size,
shape and surface characteristics of particles at the nanometer scale. Resulting micrographs are two dimensional
projections of objects and their interpretation can be difficult. Recently, electron tomography (ET) is increasingly
used to reveal the morphology of nanomaterials (NM) in 3D. In this study, we examined the feasibility to visualize
and measure silica and gold NM in suspension using conventional bright field electron tomography.
Results: The general morphology of gold and silica NM was visualized in 3D by conventional TEM in bright field
mode. In orthoslices of the examined NM the surface features of a NM could be seen and measured without
interference of higher or lower lying structures inherent to conventional TEM. Segmentation by isosurface
rendering allowed visualizing the 3D information of an electron tomographic reconstruction in greater detail than
digital slicing. From the 3D reconstructions, the surface area and the volume of the examined NM could be
estimated directly and the volume-specific surface area (VSSA) was calculated. The mean VSSA of all examined NM
was significantly larger than the threshold of 60 m
2
/cm
3
.
The high correlation between the measured values of area and volume gold nanoparticles with a known spherical
morphology and the areas and volumes calculated from the equivalent circle diameter (ECD) of projected
nanoparticles (NP) indicates that the values measured from electron tomographic reconstructions are valid for
these gold particles.
Conclusion: The characterization and definition of the examined gold and silica NM can benefit from application
of conventional bright field electron tomography: the NM can be visualized in 3D, while surface features and the
VSSA can be measured.
Background
The number based size distribution of a material and the
features of its surface are predominant criteria to classify
it as a NM [1,2]. TEM remains an important technique
to measure the size and surface topography of materials
at the nanometer level. Because the resulting micro-
graphs are two-dimensional projections of the studied
objects, their interpretation can be difficult, particularly
when the particles are complex, agglomerated or lack
symmetry. In such cases, fine ultrastructural details are
blurred due to superposition of projected features. In
addition, parameters like the surface area and volume of
NM are not accessible by conventional TEM, while the
approach to measure the thickness of NM along the pro-
jection direction by analyzing focal series in TEM
assumes a relatively simple structure [3]. Recently, as
data acquisition, alignment and reconstruction software
evolves to be more user-friendly; ET is increasingly used
to reveal the morphology and to evaluate the three-
dimensional characteristics of NP and nanoparticle
ensembles [4,5].
To include also aggregates and agglomerates of pri-
mary particles and complex multi-component particles
with external dimensions larger than the arbitrarily spe-
cified upper size limit of 100 nm, the VSSA is proposed
as a complementary qualifier to distinguish a nanostruc-
tured material from a non-nanostructured material [1].
* Correspondence: jamas@var.fgov.be
EM-unit, CODA-CERVA, Groeselenberg 99, Brussels, Belgium
Van Doren et al.Journal of Nanobiotechnology 2011, 9:17
http://www.jnanobiotechnology.com/content/9/1/17
© 2011 Van Doren et al; licensee BioMed Central Ltd. This is an Open Access article distributed under the terms of the Creative
Commons Attribution License (http://creativecommons.org/licenses/by/2.0), which permits unrestricted use, distribution, and
reproduction in any medium, provided the original work is properly cited.

The European Commission [2] proposes to define a
material as a NM when it has a specific surface area by
volume greater than 60 m
2
/cm
3
, excluding materials
consisting of particles with a size lower than 1 nm. The
VSSA of a material is generally calculated from its bulk
density and its mass specific surface area. The latter is
usually determined by gas absorption methodology
called the BET-method [6] that allows surface area or
porosity measurements as small as 1 nm. From a 3D
reconstruction of a NM, its surface area and its volume
can, in principle, be estimated directly, such that its
VSSA can be calculated, even on a per particle basis.
Advanced electron tomography methods were applied
advantageously and successfully to characterize NM at a
high resolution [4,5,7,8]. Most TEM-facilities do how-
ever not dispose of the required expensive equipment
and lack the specialized expertise. Conventional electron
tomography, where reconstructions are generated from
a tilt series recorded in bright-field mode, using a single
tilt axes with a tilt range up to ± 70°, becomes however
a well-established technique. In this study, we examined
the feasibility of three-dimensional visualization of silica
and branched gold NM in suspension using conven-
tional bright field (BF) ET. We examined whether such
materials can be defined as a NM based on the mea-
surement of their VSSA from its electron tomographic
reconstruction. To evaluate the influence of missing
wedge artifacts on the reconstruction and on the preci-
sion of the estimation of the surface area and volume of
such NM, ET analyses of spherical colloidal gold nano-
particles were used as a control.
Methods
Suspensions of spherical and branched gold NP were
obtained from IMEC (Heverlee, Belgium). Aggregated
silica nanomaterials NM-200 and NM-203 are supplied
by the European Commission-JRC (Ispra, Italy) as repre-
sentative reference NM. They are used as well at the
OECD Working Party for Manufactured Nanomaterials
programme as principal materials and international har-
monization standards. The NM were brought on piolo-
form- and carbon-coated 400 mesh copper grids (Agar
Scientific, Essex, England) that were pre-treated with 1%
Alcian blue (Fluka, Buchs, Switzerland) to increase
hydrophilicity, as described by Mast and Demeestere [9].
Gold NP were used undiluted. NM-200 and NM-203
were suspended in water containing 2% Fetal calf serum
(PAA Laboratories GmbH, Pasching, Austria) at a con-
centration of 0.1 mg/ml and sonicated using a Vibra-
cell™75041 sonicator (750 W, 20 kHz, Fisher Bioblock
Scientific, Aalst, Belgium) with a 3 mm probe at 40%
amplitude (10 W). A total energy of approximately 6200
J was added to the samples.
To obtain a maximal field of view, grids were
mounted in a tomography holder (FEI, Eindhoven, The
Netherlands) such that the squares were oriented diag-
onally with respect to the axis of the holder. Only
objectsinthecentreofagridsquarewereanalyzed
using a Tecnai Spirit TEM (FEI) with a BioTWIN lens
configuration and a LaB6-filament operating at an accel-
eration voltage of 120 kV.
Series of micrographs (tilt-series) were recorded semi-
automatically assisted by the Xplore 3D tomography-
module of the microscope control software (FEI) over a
tilt range of at least 65°, or highest angle possible, at
intervals of 1 degree. Shift and focus changes were cor-
rected at every interval. Electron micrographs were
acquired with a 4*4 K Eagle CCD-camera (FEI) at mag-
nifications of 26,500 to 49,000 times and corresponding
pixel sizes of 0.49 to 0.22 nm. The tilt series were
aligned using the Inspect 3D software, version 2.5 (FEI)
by iterative rounds of cross correlation until the align-
ment shifts were approaching to zero. Because of their
higher signal to noise ratio, reconstructions using 10 to
20 iterations of the Simultaneous Iterative Reconstruc-
tion Technique (SIRT) algorithm were superior over
reconstructions based on weighted back projection
(WBP) and on the Algebraic Reconstruction Technique
(ART) algorithm (not shown).
For visualization in 3D, the Amira software, version
4.1.2 (Mercury Computer Systems, France) was used. Iso-
surface rendering was usedtocomputeatriangular
approximation of the interfaces between the segmented
sections. The segmentation was obtained based on a sin-
gle threshold. This was chosen such that the obtained
surface optimally matches the boundaries of the recon-
structed orthogonal digital slices (orthoslices) of the NM
in the xy-plane, where resolution is highest. The resulting
surface was visualized using pseudo-coloring. To reduce
missing wedge artifacts, so-called streaks, the surface was
smoothed using a 2 × 2 × 2 averaging of voxels (down-
sampling). Using the ‘Create Surface’function of Amira,
a surface was derived from the isosurface, which allowed
measurement of the surface area of the reconstructed 3D
objects and of their enclosed volume.
Two-dimensional parameters of the reconstructed NP
were measured from the TEM micrographs taken at 0°
using the AnalySIS Solution of the iTEM software
(Olympus, Münster, Germany). Briefly, contrast and
brightness of the micrographs were optimized, the
involved particles were enclosed in a frame (region of
interest) and thresholds were set to separate particles
from the background based on their electron density and
size. The surface area and volume of individual spherical
particles were approximated by the formulas to calculate
the surface area (4πr
2
)andthevolume(4/3πr
3
)ofa
Van Doren et al.Journal of Nanobiotechnology 2011, 9:17
http://www.jnanobiotechnology.com/content/9/1/17
Page 2 of 8

perfect sphere, where r is replaced by the measured ECD
of the projected particle divided by two. The sphericity,
describing the ‘roundness’ofaparticlebyusingcentral
moments, was used to assess the hypothesis that the par-
ticle is a sphere in reality.
To measure the strength of correlation between the
calculated VSSA and the measured VSSA, the nonpara-
metric Spearman rank order correlation test was calcu-
lated using the SigmaPlot software, version 11.0 (Cosinus
Computing B.V., Drunen, The Netherlands). To test the
hypothesis that the mean VSSA obtained from ET recon-
structions equals the threshold of 60 m
2
/cm
3
,theone-
sample t-test (Sigmaplot) was used.
Results
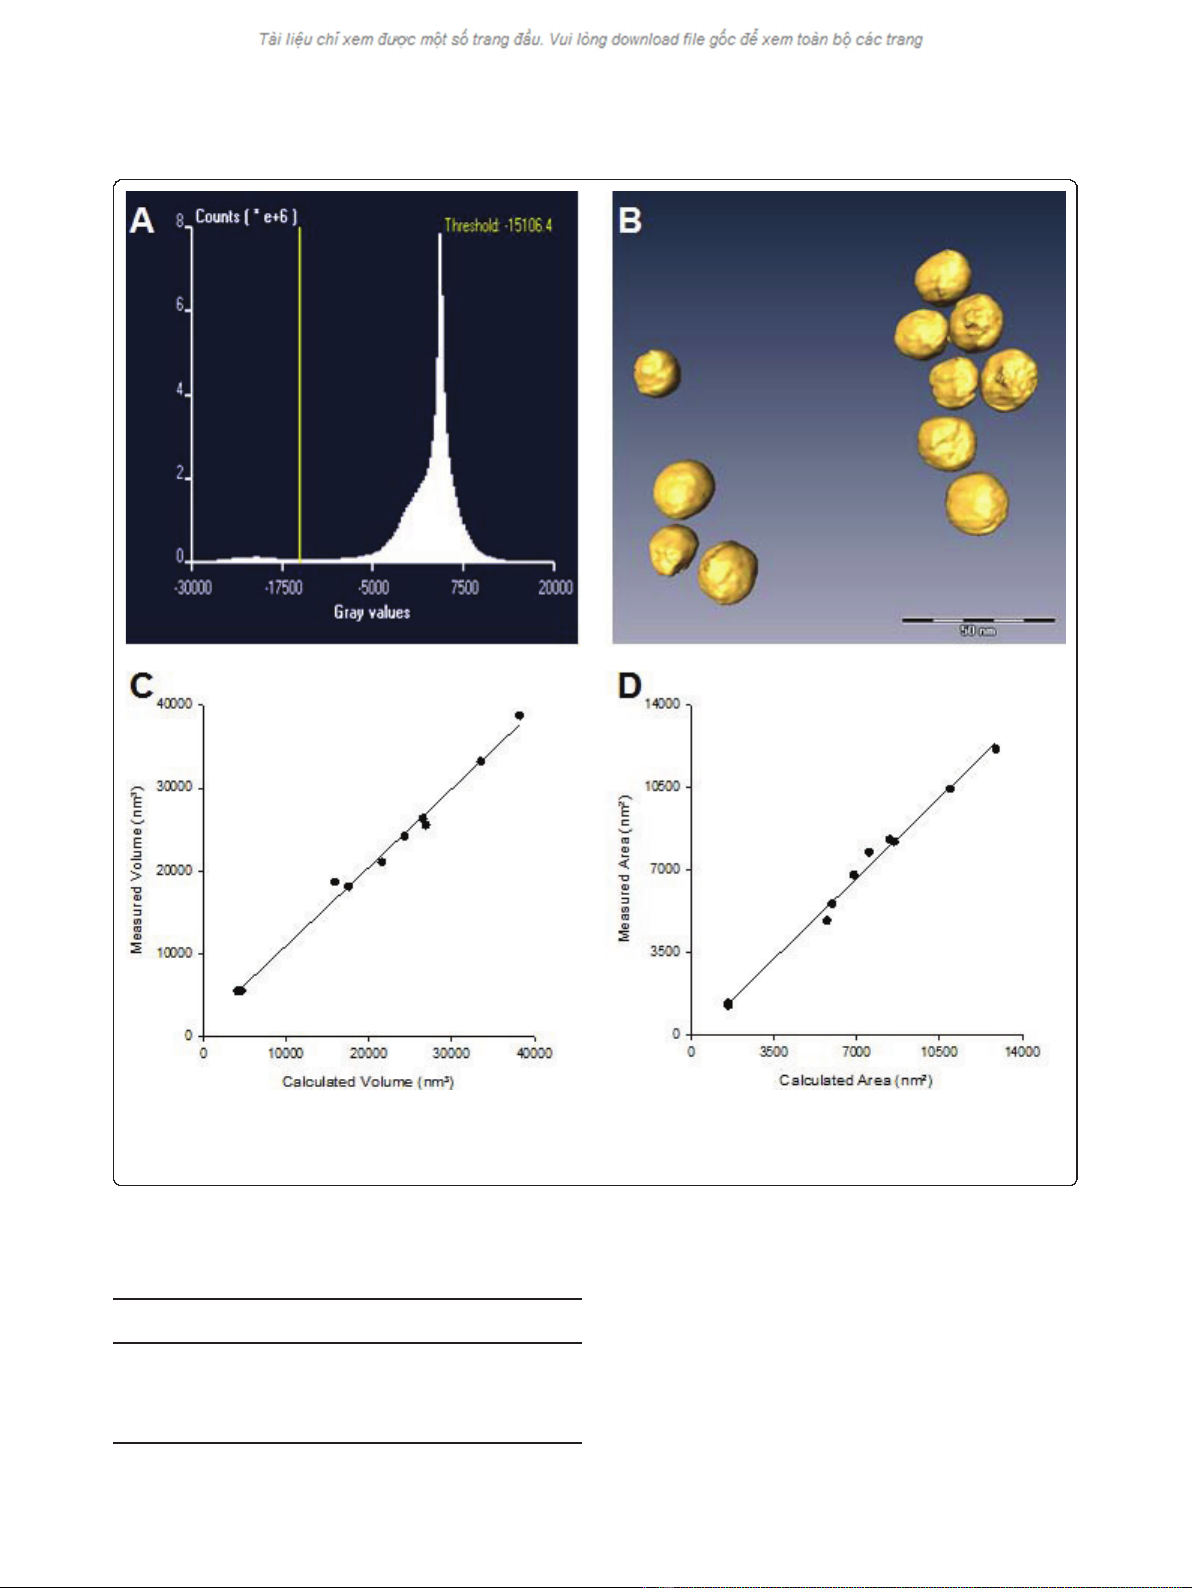
ET of spherical gold nanoparticles
Electron tomographic reconstruction allowed visualizing
the spherical gold NP in three dimensions (Figure 1B).
The particles measure approximately 20 nm in diameter
while the general morphology of all examined gold NP
was almost spherical. Some small extensions of the surface
were observed at the polar regions of the reconstructed
particles. Local flattening was observed in the equatorial
regions. The latter coincided with small zones in the origi-
nal micrographs showing diffraction contrast, indicative
for a confined crystalline organization. In the original
micrographs taken at a tilt angle of 0°, the outline of the
particles was roughly circular, although angular regions
corresponding with a local crystalline structure were
observed in certain particles.
From the isosurface based volume rendering of the ET
reconstructions, the total surface area and volume of their
composing gold particles could be measured. For example,
the total surface area and the volume of the NP shown in
Figure 1B are 13,895 nm
2
and 38,763 nm
3
, respectively.
This corresponds with a VSSA of 332 m
2
/cm
3
. The mean
VSSA±SEM,determinedfrom10ETreconstructions
(Table 1), is 316 ± 7 m
2
/cm
3
, which is significantly differ-
ent (P < 0.05) from 60 m
2
/cm
3
.
The reconstructed gold particles showed no obvious
elongation along their z-axis and image analysis of the
transmission electron micrographs of the individual par-
ticles taken at a tilt angle of 0° resulted in a mean
sphericity of 0.86. Hence, it was concluded that these
gold particles are almost spherical and that their surface
area and volume can be closely approximated by the
formulas to calculate the surface area and the volume of
a perfect sphere. Figure 1C and 1D show the correla-
tions between the calculated and measured volume and
surface area, respectively, for ten ET reconstructions
consisting of one to 11 gold NP. Both for the volume
and the surface area, the Spearman correlation coeffi-
cient was 0.98.
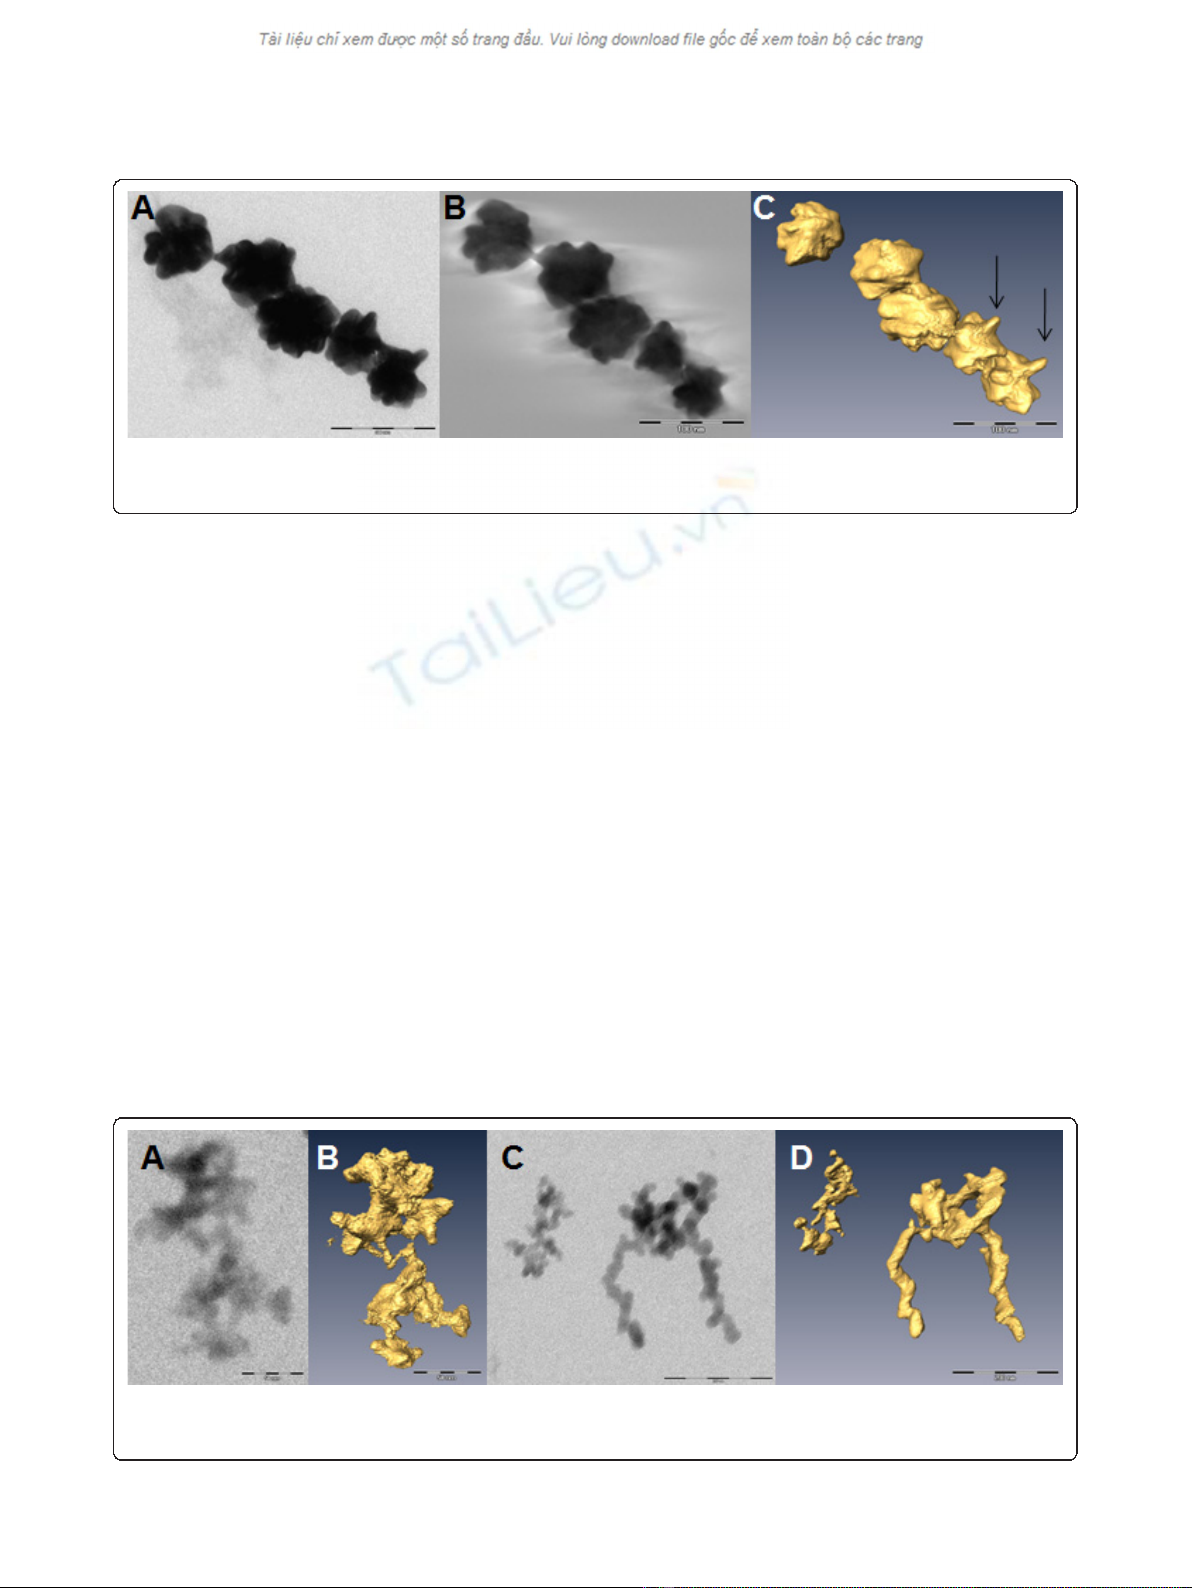
ET of branched gold nanoparticles
Branched gold NP measure approximately 50 nm in dia-
meter and show a highly irregular rather than a spherical
morphology: they are characterized by their surface
extensions or peaks. These features can be deduced from
2D images, like the original micrograph (Figure 2A) and
the orthoslices through the reconstruction (Figure 2B).
Under certain orientations, and for a few images of the
tilt series, diffraction contrast contributed considerably to
the image formation of the extensions of branched gold
particles, suggesting zones with a crystalline organization.
Nevertheless, the resolution of the final ET reconstruc-
tion remained high enough to visualize the branched
gold NP in three dimensions (Figure 2, Additional file 1),
where their surface topology can be interpreted easier
than in the 2D images. The surface area and volume of
the branched gold nanoparticles were measured for five
ET reconstructions such that VSSA could be calculated
(Table 1). The mean VSSA ± SEM is significantly differ-
ent (P < 0.05) from 60 m
2
/cm
3
.
ET analyses of silica NM
It is not evident to envisage the structure of the silica
reference materials NM-200 and NM-203 appropriately
by conventional bright field TEM (Figure 3A and 3C).
Their relatively low molar mass results in a low contrast,
while their complex morphology results in blurring of
ultrastructural details due to superposition of projected
features. Electron tomographic reconstruction in three
dimensions circumvents these difficulties. Figure 3B and
3D, and the corresponding Additional files 2 and 3,
illustrate that both the precipitated silica NM-200 and
the pyrogenic silica NM-203 consist of aggregates of
very complex morphology composed of a variable num-
ber of interconnected primary subunits. Although the
site where an aggregate interacts with the grid can be
found in the 3D reconstruction as a relatively flat sur-
face, structures of primary subunits remain extended in
the z-direction, resulting in similar dimensions along the
three axes. This suggests a limited flexibility of the
material. Measurement in 3D space showed that indivi-
dual aggregates in both NM-200 and NM-203 are com-
posed of similarly sized primary subunits. The size of
the subunits of the aggregates of NM-200 is relatively
constant: they measure approximately 20 nm in dia-
meter. The size of the subunits of different aggregates of
NM-203 is variable: the subunits of the left aggregate
shown in Figure 3D measure, for example, 8 to 12 nm
in diameter, while the subunits of the right aggregate
measure approximately 20 nm in diameter. In any of the
tilt series of NM-200 and NM-203, diffraction contrast
was observed, confirming their amorphous structure.
The surface area and volume of NM-200 and NM-203
Van Doren et al.Journal of Nanobiotechnology 2011, 9:17
http://www.jnanobiotechnology.com/content/9/1/17
Page 3 of 8
were measured for five ET reconstructions and the
VSSA was calculated (Table 1). For both materials, the
mean VSSA were significantly different (P < 0.05) from
60 m
2
/cm
3
.
Discussion
By electron tomographic reconstruction based on con-
ventional BF TEM, the general morphology of gold and
silica NM was visualized in 3D. In orthoslices of the
examined NM in the xy-plane, as presented in Figure
Figure 1 Electron tomographic analysis of spherical gold nanoparticles. Figure 1A represents the micrograph gray value range that served
for setting the threshold. The threshold was set at -15106.4, that is somewhere between the two peaks. Figure 1B shows a representative
electron tomographic 3D-reconstruction of spherical gold NP. Bar: 50 nm. Figure 1C and Figure 1D show the correlation between the calculated
and measured volumes and areas of ten electron tomograms.
Table 1 Mean volume specific surface area of different
nanomaterials based on electron tomographic
reconstructions
Type of nanomaterial n Volume-specific surface
area (m
2
/cm
3
)
a
Spherical Gold 10 316 ± 7
Branched Gold 5 177 ± 29
Precipitated Silica (NM-200) 5 342 ± 36
Pyrogenic Silica (NM-203) 5 219 ± 23
a
Values represent mean VSSA ± SEM
Van Doren et al.Journal of Nanobiotechnology 2011, 9:17
http://www.jnanobiotechnology.com/content/9/1/17
Page 4 of 8
2B, the surface can readily be distinguished from the
background and from missing wedge artifacts, like
streaks. In such orthoslices, the surface features of a
NM can be seen and measured without interference of
higher or lower lying structures inherent to conventional
TEM.
Segmentation by isosurface rendering allows accessing
the 3D information of an ET reconstruction in greater
detail than digital slicing. Such 3D visualization and
measurement of the surface features of NM can contri-
bute to bring the second condition of the definition of a
nanomaterial proposed by the European Commission [2]
in practice: structures in one or more dimensions in the
size range of 1-100 nm can be shown.
From the 3D reconstructions, the surface area and the
volume of the examined NM could be estimated directly
and the VSSA was calculated. The mean VSSA of all
examined NM was significantly larger than the threshold
of 60 m
2
/cm
3
such that these materials can be classified
as NP according to the third condition of this definition.
As opposed to the BET-method [10], ET is not limited
to powders and/or dry solid materials: it can be applied
to a large variety of NM samples, including suspensions
of complex particles, provided that the material can be
suitably coated on an EM-grid.
To optimally characterize the morphology of a NM by
ET reconstruction, it is required that (i) the projection
requirement is met [4]; (ii) missing wedge artifacts are
minimal and (iii) isosurface rendering optimally fits the
NM surface.
Our results indicate that, in principle, the characteri-
zation and definition of NM can benefit from applica-
tion of conventional BF ET. In the scope of putting this
technique in practice for the characterization and defini-
tion of gold and silica NM, following approach is sug-
gested to reconcile the limitations of conventional BF
ET with the above-described conditions.
(i) The projection requirement states that for an image
intensity to be usable for ET reconstruction, it has to be
a monotonic function of a projected physical quantity
[4]. The examined silica NM were shown to be amor-
phous and weak scattering such that their mass thick-
ness is the dominant contrast mechanism. The BF
images of the tilt series are thus essentially projections
Figure 2 Electron tomography of branched gold NP. Figure 2A represents the original micrograph of five branched gold NP taken at 0°.
Figure 2B is a 0.38 nm section through the reconstructed volume shown in Figure 2C. Figure 2C shows a representative electron tomographic
3D reconstruction of branched gold NP. Arrows indicate surface extensions. Bars: 100 nm.
Figure 3 Electron tomographic analyses of silica NM. The micrographs, taken at 0°, show one (Figure 3A) and two aggregates (Figure 3C)
consisting of multiple primary subunits of NM-200 and NM-203, respectively. Figure 3B and Figure 3D show the corresponding ET
reconstructions. Bars: 200 nm.
Van Doren et al.Journal of Nanobiotechnology 2011, 9:17
http://www.jnanobiotechnology.com/content/9/1/17
Page 5 of 8


%20--%3e%3cdefs%3e%3cstyle%3e%20.st0%20{%20fill:%20%23fff;%20}%20.st1%20{%20fill:%20%237800fa;%20}%20%3c/style%3e%3c/defs%3e%3cpath%20class='st1'%20d='M117.78,12.18H43.11c2.9,3.47,4.65,7.94,4.65,12.82,0,5.6-2.3,10.66-6.01,14.29h76.02l7.22-13.56-7.22-13.56Z'/%3e%3cg%3e%3cpath%20class='st0'%20d='M53.58,26.17h-.59v-1.46h.59v-4.96h2.83c1.78,0,2.67.94,2.67,2.82v5.76c0,1.87-.89,2.81-2.67,2.81h-2.83v-4.96ZM55.36,21.37v3.34h1.1v1.46h-1.1v3.34h1.01c.61,0,.91-.37.91-1.1v-5.93c0-.74-.3-1.1-.91-1.1h-1.01Z'/%3e%3cpath%20class='st0'%20d='M65.99,31.14h-1.8l-.31-2.07h-2.19l-.31,2.07h-1.64l1.82-11.39h2.62l1.82,11.39ZM65.28,18.04c-.25.46-.51.77-.75.94-.21.15-.47.22-.79.22-.26,0-.57-.07-.92-.22l-.38-.15c-.14-.05-.26-.07-.37-.07-.3,0-.53.18-.71.54l-.91-.68c.25-.46.51-.77.75-.94.21-.14.48-.21.79-.21.26,0,.57.07.92.21l.38.15c.14.05.26.07.37.07.3,0,.53-.18.71-.54l.91.68ZM61.91,27.52h1.73l-.87-5.76-.87,5.76Z'/%3e%3cpath%20class='st0'%20d='M74.53,26.89v1.52c0,1.91-.89,2.86-2.67,2.86s-2.67-.95-2.67-2.86v-5.93c0-1.91.89-2.86,2.67-2.86s2.67.95,2.67,2.86v1.11h-1.69v-1.22c0-.75-.31-1.12-.93-1.12s-.93.37-.93,1.12v6.15c0,.74.31,1.11.93,1.11s.93-.37.93-1.11v-1.63h1.69Z'/%3e%3cpath%20class='st0'%20d='M81.4,31.14h-1.8l-.31-2.07h-2.19l-.31,2.07h-1.64l1.82-11.39h2.62l1.82,11.39ZM75.9,19.2l1.52-1.91h1.71l1.51,1.91h-1.61l-.76-.95-.75.95h-1.61ZM77.32,27.52h1.73l-.87-5.76-.87,5.76ZM83.1,15.99l-1.76,1.91h-1.26l1.17-1.91h1.86Z'/%3e%3cpath%20class='st0'%20d='M84.86,19.75c1.78,0,2.67.94,2.67,2.82v1.48c0,1.87-.89,2.81-2.67,2.81h-.85v4.28h-1.79v-11.39h2.64ZM84.01,21.37v3.86h.85c.58,0,.87-.36.87-1.08v-1.71c0-.71-.29-1.07-.87-1.07h-.85Z'/%3e%3cpath%20class='st0'%20d='M93.51,19.75c1.78,0,2.67.94,2.67,2.82v1.48c0,1.87-.89,2.81-2.67,2.81h-.85v4.28h-1.79v-11.39h2.64ZM92.66,21.37v3.86h.85c.58,0,.87-.36.87-1.08v-1.71c0-.71-.29-1.07-.87-1.07h-.85Z'/%3e%3cpath%20class='st0'%20d='M98.8,31.14h-1.79v-11.39h1.79v4.88h2.03v-4.88h1.83v11.39h-1.83v-4.88h-2.03v4.88Z'/%3e%3cpath%20class='st0'%20d='M105.36,24.55h2.46v1.62h-2.46v3.34h3.09v1.63h-4.88v-11.39h4.88v1.63h-3.09v3.18ZM108.17,17.29l-1.76,1.91h-1.26l1.17-1.91h1.86Z'/%3e%3cpath%20class='st0'%20d='M112.2,19.75c1.78,0,2.67.94,2.67,2.82v1.48c0,1.87-.89,2.81-2.67,2.81h-.85v4.28h-1.79v-11.39h2.64ZM111.35,21.37v3.86h.85c.58,0,.87-.36.87-1.08v-1.71c0-.71-.29-1.07-.87-1.07h-.85Z'/%3e%3c/g%3e%3ccircle%20class='st1'%20cx='25'%20cy='25'%20r='20'/%3e%3cpath%20class='st0'%20d='M32.78,19.27c2.92,0,4.43,2.55,5.28,5.33l.71,2.17c.14.38-.33.75-.71.75h-5.61c.19-.33.24-.71.09-1.08l-.75-2.45c-.43-1.32-.99-2.64-1.79-3.77.75-.57,1.65-.94,2.78-.94h0ZM25,18.38c3.25,0,4.9,2.78,5.89,5.89l.76,2.45c.14.42-.33.8-.8.8h-11.69c-.42,0-.94-.38-.8-.8l.75-2.45c.99-3.11,2.64-5.89,5.89-5.89h0ZM25,11.35c1.74,0,3.11,1.37,3.11,3.11s-1.37,3.11-3.11,3.11-3.11-1.41-3.11-3.11,1.41-3.11,3.11-3.11h0ZM17.27,19.27c1.08,0,1.98.38,2.73.94-.8,1.13-1.37,2.45-1.74,3.77l-.8,2.45c-.14.38-.05.75.09,1.08h-5.56c-.42,0-.9-.38-.75-.75l.71-2.17c.9-2.78,2.41-5.33,5.33-5.33h0ZM17.27,12.91c1.51,0,2.78,1.27,2.78,2.83s-1.27,2.83-2.78,2.83-2.83-1.27-2.83-2.83,1.27-2.83,2.83-2.83h0ZM32.78,12.91c1.56,0,2.78,1.27,2.78,2.83s-1.23,2.83-2.78,2.83-2.83-1.27-2.83-2.83,1.27-2.83,2.83-2.83h0ZM27.07,28.56v.09c0,.57-.24,1.08-.61,1.46h0v.05c-.38.33-.9.57-1.46.57s-1.08-.24-1.46-.61h0c-.38-.38-.61-.9-.61-1.46v-.09h1.41v.09c0,.19.05.38.19.47v.05c.09.09.28.19.47.19s.38-.09.47-.19v-.05c.14-.09.24-.28.24-.47t-.05-.09h1.41ZM30.99,28.56v.09c0,1.65-.66,3.16-1.74,4.24-1.08,1.08-2.59,1.79-4.24,1.79s-3.16-.71-4.24-1.79l-.05-.05c-1.04-1.08-1.7-2.55-1.7-4.2v-.09h1.41v.09c0,1.27.47,2.4,1.27,3.25h.05c.85.85,1.98,1.37,3.25,1.37s2.4-.52,3.25-1.37c.85-.8,1.37-1.98,1.37-3.25v-.09h1.37ZM34.99,28.56v.09c0,2.78-1.13,5.28-2.92,7.07-1.79,1.79-4.29,2.92-7.07,2.92s-5.23-1.13-7.07-2.92c-1.79-1.79-2.92-4.29-2.92-7.07v-.09h1.41v.09c0,2.4.94,4.53,2.5,6.08,1.56,1.56,3.72,2.5,6.08,2.5s4.52-.94,6.08-2.5c1.56-1.56,2.5-3.68,2.5-6.08v-.09h1.41Z'/%3e%3c/svg%3e)