Allosteric modulation of myristate and Mn(III)heme binding to human serum albumin
Optical and NMR spectroscopy characterization Gabriella Fanali1, Riccardo Fesce1, Cristina Agrati1, Paolo Ascenzi2,3 and Mauro Fasano1
1 Dipartimento di Biologia Strutturale e Funzionale, and Centro di Neuroscienze, Universita` dell’Insubria, Busto Arsizio (VA), Italy 2 Dipartimento di Biologia, and Laboratorio Interdisciplinare di Microscopia Elettronica, Universita` ‘Roma Tre’, Italy 3 Istituto Nazionale per le Malattie Infettive I.R.C.C.S. ‘Lazzaro Spallanzani’, Roma, Italy
Keywords allostery; fatty acid binding; heme binding; human serum albumin; NMR relaxation
Correspondence M. Fasano, Dipartimento di Biologia Strutturale e Funzionale, Universita` dell’Insubria, Via Alberto da Giussano 12, I-21052 Busto Arsizio (VA), Italy Fax: +39 0331 339459 Tel: +39 0331 339450 E-mail: mauro.fasano@uninsubria.it Website: http://fisio.dipbsf.uninsubria.it/cns/ fasano
(Received 21 April 2005, revised 25 July 2005, accepted 26 July 2005)
doi:10.1111/j.1742-4658.2005.04883.x
Human serum albumin (HSA) is best known for its extraordinary ligand binding capacity. HSA has a high affinity for heme and is responsible for the transport of medium and long chain fatty acids. Here, we report myri- state binding to the N and B conformational states of Mn(III)heme–HSA (i.e. at pH 7.0 and 10.0, respectively) as investigated by optical absorbance and NMR spectroscopy. At pH 7.0, Mn(III)heme binds to HSA with lower affinity than Fe(III)heme, and displays a water molecule coordinated to the metal. Myristate binding to a secondary site FAx, allosterically coupled to the heme site, not only increases optical absorbance of Mn(III)heme-bound HSA by a factor of approximately three, but also increases the Mn(III)- heme affinity for the fatty acid binding site FA1 by 10–500-fold. Cooper- ative binding appears to occur at FAx and accessory myristate binding sites. The conformational changes of the Mn(III)heme–HSA tertiary struc- ture allosterically induced by myristate are associated with a noticeable change in both optical absorbance and NMR spectroscopic properties of Mn(III)heme–HSA, allowing the Mn(III)-coordinated water molecule to exchange with the solvent bulk. At pH ¼ 10.0 both myristate affinity for FAx and allosteric modulation of FA1 are reduced, whereas cooperation of accessory sites and FAx is almost unaffected. Moreover, Mn(III)heme binds to HSA with higher affinity than at pH 7.0 even in the absence of myristate, and the metal-coordinated water molecule is displaced. As a whole, these results suggest that FA binding promotes conformational changes reminiscent of N to B state HSA transition, and appear of general significance for a deeper understanding of the allosteric modulation of ligand binding properties of HSA.
Human serum albumin (HSA) is the most prominent protein in plasma, but it is also found in tissues and secretions throughout the body. HSA abundance (its concentration being 45 mgÆmL)1 in the serum of human adults) contributes significantly to colloid- osmotic blood pressure. HSA, best known for its is constituted extraordinary ligand binding capacity,
by a single nonglycosylated all-a chain of 65 kDa con- taining three homologous domains (labelled I, II, and III), each composed of two (A and B) subdomains. The three domains have different binding capacity for a broad variety of ligands such as aminoacids (Trp and Cys), hormones, metal ions, and bilirubin. Moreover, HSA has a high affinity for heme and is
Abbreviations FA, fatty acid; HSA, human serum albumin; MSE, mean square error; NMRD, nuclear magnetic relaxation dispersion.
FEBS Journal 272 (2005) 4672–4683 ª 2005 FEBS
4672
G. Fanali et al.
Myristate and Mn(III)heme binding to HSA–heme
suggesting that sites FA6–7 are low-affinity fatty acid binding sites [1,6,7,9–17].
responsible for the transport of lipophilic compounds and drugs and of medium and long chain fatty acids; among them, myristic acid is a stereotypic ligand to investigate fatty acid binding and transport properties of HSA [1–8].
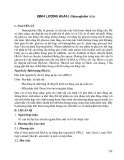
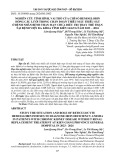
The fatty acid binding site FA1, located in subdo- main IB (Fig. 1), acts as the heme binding site as well, with the tetrapyrrole ring arranged in a d-shaped cavity limited by two tyrosine residues (Tyr138 and Tyr161) that provide p-p stacking interaction with the porphyrin and supply a donor oxygen (from Tyr161) for the ferric heme iron. Ferric heme is secured by the long IA-IB connecting loop that fits into the cleft opening. Heme propionates point toward the interface between domains I and III and are stabilized by salt bridges with His146 and Lys190 residues [6,8].
HSA undergoes pH- and allosteric effector-depend- ent reversible conformational isomerization(s). Between pH 2.7 and 4.3, HSA shows a fast (F) form, character- ized by a dramatic increase in viscosity, much lower loss in helical content. solubility, and a significant Between pH 4.3 and 8, in the absence of allosteric effectors, HSA displays the normal (N) form that is characterized by heart-shaped structure. Between pH 4.3 and 8, in the presence of allosteric effectors, and at pH greater than 8, in the absence of ligands, HSA changes conformation to the basic (B) form with loss of a-helix and an increased affinity for some lig- ands, such as warfarin [5,18–23].
Fatty acids (FAs) are required for the synthesis of membrane lipids, hormones and second messengers, and serve as an important source of metabolic energy. Although the binding of fatty acids to human and bovine serum albumin has been thoroughly inves- tigated over many years, their binding mode and thermodynamics are still objects of debate. By combi- ning biochemical and biophysical approaches, a com- mon consensus view has been reached on there being three high-affinity fatty acid binding sites, and at least three further low affinity sites have been envisaged. NMR studies on tryptic and peptic fragments of bovine serum albumin have localized two high affinity sites in domain III and one in the N-terminal half of the protein. Structural X-ray diffraction studies have demonstrated that HSA is able to bind up to seven long chain FAs at multiple binding equivalents of sites (labelled FA1 to FA7; Fig. 1) with different affinity. In sites FA1–5 the carboxylate moiety of fatty acids is anchored by electrostatic ⁄ polar inter- actions; on the contrary, sites FA6–7 do not display a clear evidence of polar interactions that keep in thus place the carboxylate head of
the fatty acid,
indicates
that
Fatty acids are effective in allosterically regulating ligand binding to Sudlow’s site I and to the heme cleft. Myristate regulates HSA binding properties in a com- plex manner, involving both competitive and allosteric mechanisms. The structural changes associated with FAs binding can essentially be regarded as relative domain rearrangements to the I-II and II-III inter- faces. This allosteric regulation is not observed for short FAs (e.g. octanoate) that preferably bind to Sudlow’s site II and displace the specific ligands (e.g. ibuprofen) inducing HSA allosteric rearrangement(s). without interactions the hydrophobic This between the long FA polymethylenic tail and HSA drives allosteric rearrangements. In turn, Sudlow’s site I ligands (e.g. warfarin) displace FA7, while Sudlow’s site II ligands (e.g. ibuprofen) displace FA3 and FA4. Moreover, heme binding to HSA displaces FA1 [6,8,13,16,23–26].
Fig. 1. Ribbon representation of the heart-shaped structure of HSA with the seven fatty acid binding sites labeled (FA1 to FA7); sites are occupied by myristate anions rendered with red sticks. N- and C-termini of the polypeptide chain are labeled accordingly. Atomic coordinates are taken from [6,8,13,14]. The figure was drawn using the SWISS PDB viewer (http://www.expasy.org/spdbv/).
Heme binding to HSA endows this protein with peculiar optical absorbance and magnetic spectroscopic properties that can be used to follow ligand- and pH- dependent conformational transition(s) [19–22,27]. In particular, Mn(III)heme can be used instead of Fe(III)- heme in order to increase the strength of the dipolar interaction with water protons when their NMR relax- ation rate is measured [19,20]. Although an even stronger dipolar interaction could be obtained using
FEBS Journal 272 (2005) 4672–4683 ª 2005 FEBS
4673
G. Fanali et al.
Myristate and Mn(III)heme binding to HSA–heme
the metal undergoes oxidation under
Mn(II)heme, aerobic conditions in porphyrin complexes [28].
Heme regulates allosterically drug binding to Sud- low’s site I. In fact, heme affinity for HSA decreases by about one order of magnitude upon warfarin bind- ing. Reciprocally, heme binding to HSA decreases war- farin affinity by the same extent [19]. Fe(III)heme allosterically inhibits ligand binding to Sudlow’s site I, possibly by stabilizing the neutral (N) state of HSA. Vice versa, ligand binding to Sudlow’s site I impairs Fe(III)heme–HSA formation, possibly by stabilizing the basic (B) state of HSA [5,18,23,29–31].
Here, we report the spectroscopic analysis of the myristate-dependent conformational changes of the N and B states of Mn(III)heme–HSA, by optical absorb- ance spectroscopy and NMR spectroscopy, that show allosteric interaction(s) between FAs and Mn(III)heme with HSA. Interestingly, FAs increase Mn(III)heme affinity to HSA, whereas warfarin and FA7 ligands were reported to behave in the opposite way with respect to ferric heme binding to HSA [19,21,31]. Additionally, the affinity of Mn(III)heme for HSA and the spectroscopic properties of the Mn(III)heme–HSA adduct in the presence of myristate are similar to those of the B conformational state of HSA, suggesting that myristate binding to one or more modulatory sites possibly drives the N to B state HSA transition.
Results
M myristate; crossed diamonds: 5.0 · 10)5
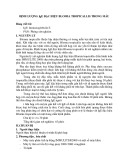
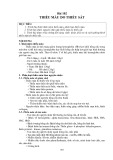
Fig. 2. (A) Binding isotherms for Mn(III)heme binding to fatty acid- free HSA and to the HSA–myristate complexes, at pH 7.0 and 25.0 (cid:1)C; open triangles: no myristate; solid triangles: 5.0 · 10)6 M myristate; open circles: 1.0 · 10)5 M myristate; solid circles: 2.5 · 10)5 M myri- state; open diamonds: 7.5 · 10)5 M myristate; solid diamonds: 1.0 · 10)4 M myristate. The continuous lines were obtained by numerical fitting of the data. Values of the dissociation equilibrium constants obtained according to Scheme 1 are given in Table 1. (B) UV-visible spectral changes observed for a solution of 1.0 · 10)5 M Mn(III)heme titrated with HSA (0–3.0 · 10)5 M) in the presence of 1.0 · 10)4 M myristate, at pH 7.0 and 25.0 (cid:1)C. The arrows indicate the increase of HSA concentration.
In the absence of myristate, at pH 7.0 (i.e. HSA in the N conformational state), Mn(III)heme binds to fatty acid-free HSA with a dissociation constant KH (cid:1) 2.0 · 10)5 m (Fig. 2A). Although the binding curve does not reach saturation and therefore the KH value should be considered as a lower limit, it is worth to note that it is two order of magnitude larger than that measured for Fe(III)heme [32]. In the presence of 1.0 · 10)4 m myristate, the optical absorbance spec- trum of Mn(III)heme–HSA displays a characteristic shoulder at 440 nm with well-defined isosbestic points (Fig. 2B).
In the presence of myristate,
are
ting that binding of myristate to a modulatory site FAx increases the signal yield of the complex. The DA value for 1.0 · 10)5 m Mn(III)heme–HSA–myristate complex can be estimated about A10* ¼ 0.33, by nor- malizing the value observed at 1.0 · 10)4 m myristate and 30 lm HSA (0.255) to full Mn(III)heme binding, based on the molar fraction of the Mn(III)heme–HSA adduct that gave similar spectral data at pH 10.0 (see below). Furthermore, (c) at intermediate HSA concen- tration the binding curves rapidly rise and appear to
the expression for HSA-bound Mn(III)heme concentration could not be solved analytically. Four major features are evident in optical absorbance difference (DA) curves: (a) at low HSA concentrations, the curves are depressed by myri- state, indicating that myristate affinity for FA1 is higher than that of Mn(III)heme in the absence of myristate, and Mn(III)heme binding to FA1 is pre- cluded by competition equilibrium (left column of Scheme 1). clearly (b) Maximal DA values increased in the presence of myristate, thereby indica-
FEBS Journal 272 (2005) 4672–4683 ª 2005 FEBS
4674
G. Fanali et al.
Myristate and Mn(III)heme binding to HSA–heme
Sn
(Myr)P(…)–(…)
* KM ↔ (Myr)P(Myr)–(…)
KM ↔
(Myr)P(Myr)–(Myr)n
M
↔
↔
↔
KM
KM
KM
Sn
(…)P(…)–(…)
* KM ↔ (…)P(Myr)–(…)
KM ↔ (…)P(Myr)–(Myr)n
M
M
↔
↔
↔
KH
KH
KH
Sn
(Hem)P(…)–(…)
H KM ↔ (Hem)P(Myr)–(…)
KM ↔ (Hem)P(Myr)–(Myr)n
Scheme 1. Allosteric and competition equilibria involving Mn(III)heme and myristate binding to HSA. Binding sites are indicated with the notation (FA1)P(FAx)–(FAS), where FA1 is the heme binding site, acting as myristate binding site as well, FAx is a different myristate binding site allosterically coupled to FA1, and FAS are n secondary myristate binding sites, with different affinities, allosterically uncoupled to FA1. P ¼ protein, HSA; Myr ¼ myristate; Hem ¼ Mn(III)heme. Values of the dissociation equilibrium constants are given in Table 1 and in the text. The framed transition is associated with a change in the optical absorption spectrum (see text).
reproduce the peak followed by partial decline observed at intermediate myristate concentrations, par- ticularly evident for 1.0–5.0 · 10)4 m myristate, and in general the right part of the curves (at high [HSA]). In order to qualitatively reproduce this feature, positive cooperation must be introduced between at least one of the additional FA binding sites and FAx, so that the Mn(III)heme–HSA–myristate adduct releases myri- state from FAx, as free myristate concentration van- ishes, and the optical absorbance signal declines.
M, and possibly K M
Several sets of parameters gave good fits to the identical curves experimental data, yielding almost (MSE ¼ 3.0 ± 0.1 · 10)5): an example of a set of fit- ting curves is displayed as continuous lines in Fig. 2A. S1 in the All these solutions indicate a value for K M range between 1.5 · 10)6 and 3.0 · 10)6 m (and thus values of the dissociation constants for the 5 additional FA sites ranging from 2 · 10)6 to 2 · 10)8 m) and sug- gest that the affinity of myristate for FAx is modulated by additional site no. 3 or 4, with dissociation constant in the order of 8.0 · 10)8 to 1.3 · 10)7 m and a 50–200- fold decrease in FAx affinity when the coupled site releases myristate.
S1 to K M
this
S1 ⁄ 10(n)1) ⁄ 2, n ¼ 2–5;
Sn ¼ K M
M, KM* and K M
Very similar fits were obtained, whether or not the affinity of FA1 for myristate was assumed to change when FAx is occupied. The strength of cooperative coupling between accessory sites and FAx could also change over a wide extent (10–500-fold decrease in KM* when additional FA site no. 3 or 4 releases myri- state) producing equally good fits. However, the set of estimated dissociation constants for FA1 and FAx changed quite markedly depending on the assumptions regarding cooperativity among FA binding sites. The best fitting values for the parameters of the model (Scheme 1) are reported in Table 1 for two nicely
reach saturation for HSA concentrations well lower than in the absence of myristate. This indicates that binding of myristate to the modulatory site also increa- ses the affinity of Mn(III)heme for FA1 (Scheme 1, central column). Finally, (d) at high HSA concentra- tion and intermediate myristate concentrations (1.0– 5.0 · 10)5 m) the binding curves decline, suggesting that unbinding of myristate from FAx occurs, accord- ing to equilibrium of the framed reaction in Scheme 1. A kinetic model was set up to numerically fit the optical absorbance data reported in Fig. 2A. The mini- mal core of the model was based on the competition between Mn(III)heme and myristate for binding to FA1 (defined by the parameters KH and KM) and on the allosteric modulation of FA1 properties by myri- state binding to FAx (defined by the parameters KM*, M1KM, if myristate binding to K H FA1 is also modulated; see Experimental procedures for explanation of the notations for the equilibrium constants). However, binding of myristate to addi- tional FA sites must also be considered, to take into account the decrease in free myristate concentration at increasing concentrations of HSA; this requires the S5. For the sake further set of parameters K M of simplicity, these constants were bound to a fixed S1 as a free parameter and affinity ratio series, with K M in general is K M agreement with the estimates reported in the literature [1,9,10,33]. Two further free parameters (in addition to S1) completed the model: KH, KM, K H the asymptotic absorbance in the absence of myristate (A10) and the absorbance of 1.0 · 10)5 m Mn(III)- heme–HSA–myristate complex (A10*). However, this simplified model did not adequately fit the experimen- tal data (MSE ¼ 4.9 · 10)5); in particular, it could not
FEBS Journal 272 (2005) 4672–4683 ª 2005 FEBS
4675
G. Fanali et al.
Myristate and Mn(III)heme binding to HSA–heme
Table 1. Values of the thermodynamic dissociation constants (M) for myristate and Mn(III)heme binding to HSA at pH 7.0 and 10.0 (Scheme 1 and see text). Assumptions: a KM
M ¼ KM. KM* · 100 for unoccupied FAS3. b K M
M ⁄ KH. KM* · 100 for unoccupied FAS3.
M ⁄ KM ¼ K H
pH
Constant
7.0a
10.0a
7.0b
10.0b
M [FA1 + Heme (FAx bound)] M [FA1 + Myr (FAx bound)]
S3 (FAS3 + Myr)
KH (FA1 + Heme) KM (FA1 + Myr) K H K M KM* (FAx + Myr) K M A10 [Asympt. DA (no Myr)] A10* [Asympt. DA (+ Myr)] Mean square error
1.5 · 10)5 3.4 · 10)7 8.2 · 10)7 3.4 · 10)7 3.2 · 10)7 9.2 · 10)8 0.011 0.030 2.9 · 10)5
1.0 · 10)6 1.1 · 10)6 9.3 · 10)8 1.1 · 10)6 1.2 · 10)5 9.2 · 10)8 0.027 0.028 9.2 · 10)6
1.7 · 10)5 7.2 · 10)6 8.5 · 10)8 3.7 · 10)7 5.7 · 10)7 1.4 · 10)7 0.012 0.030 2.8 · 10)5
1.1 · 10)6 1.3 · 10)5 7.9 · 10)7 9.4 · 10)6 2.6 · 10)6 1.4 · 10)7 0.027 0.028 8.8 · 10)6
M ⁄ KM ¼ K H
allosteric modulation
of FA1
(K H
M,
fitting models: no change in FA1 affinity for myristate, M ¼ KM), or a similar depending on FAx binding (K M change in FA1 affinity for both Mn(III)heme and myr- M ⁄ KH); in both cases 100-fold istate (K M decrease was assumed in KM* when additional FA site no. 3 releases myristate. By inspection of the model parameters (Table 1) it is clear that the assumptions strongly affect the estimated affinity of FAx for myri- state (KM*) and, as a consequence, the magnitude of M ⁄ KH ¼ the 5.4 · 10)2 vs. 5.0 · 10)3). The estimate of KM also dif- fers by about one order of magnitude, but the differ- i.e. FA1 ence is smaller for the estimate of K M affinity for myristate with occupied FAx, which pre- sumably is the relevant dissociation constant for com- petition between Mn(III)heme and myristate with the latter in excess.
increases by at
(KH)
the data. Values of
indicate that
M)
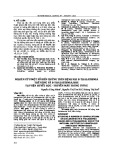
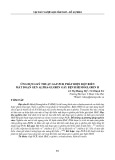
Fig. 3. (A) Binding isotherms for Mn(III)heme binding to fatty acid- free HSA and to the HSA–myristate complex, at pH 10.0 and 25.0 (cid:1)C; open triangles: no myristate; solid diamonds: 1.0 · 10)4 M myristate. The continuous lines were obtained by numerical fitting of the dissociation equilibrium constants obtained according to Scheme 1 are given in Table 1. (B) UV-visible spectral changes observed for a solution of 1.0 · 10)5 M Mn(III)- heme titrated with HSA (0–3.0 · 10)5 in the presence of 1.0 · 10)4 M myristate, at pH 10.0 and 25.0 (cid:1)C. The arrows indicate the increase of HSA concentration.
The same model was also applied to data obtained at pH 10.0 (Fig. 3). The model is over-defined, and several sets of parameters give comparable fits; the S3 to the value observed results obtained by fixing K M at pH 7.0 are displayed in Table 1. The consistent aspects, relatively independent of the model assump- tions, are the following: (a) FA1 affinity for Mn(III)- least one order of heme to pH 7.0, but both FAx magnitude with respect affinity and allosteric modulation of FA1 are reduced. (b) Cooperation of accessory sites and FAx is almost unaffected. Finally, (c) the asymptotic absorbance of the Mn(III)heme–HSA complex (A10) becomes com- parable to that of the Mn(III)heme–HSA–(FAx + myristate) complex (A10*), and the latter is not altered by the change in pH. Again, the occurrence of well-defined isosbestic points the binding equilibrium occurs through only two forms, the HSA-free and the HSA-bound Mn(III)heme (Fig. 3B).
FEBS Journal 272 (2005) 4672–4683 ª 2005 FEBS
4676
G. Fanali et al.
Myristate and Mn(III)heme binding to HSA–heme
the relaxivity measured at 10 MHz of a M solution of Mn(III)heme–HSA as a function of myri-
Fig. 5. Change of 1.0 · 10)3 state concentration. Data were obtained at pH 7.0 and 25.0 (cid:1)C.
with a varying slope, up to sevenfold molar excess of myristate, while it starts to decrease when myristate concentration is further increased.
An overview of the conformational changes due to both fatty acid binding and pH may be obtained by plot- ting 1H-NMR relaxation rate data vs. pH for the differ- ent Mn(III)heme ⁄ HSA ⁄ fatty acid ratios. Figure 6 shows the pH dependence curves of the observed relaxation rate measured at 10 MHz, where this parameter is most for Mn(III)heme–HSA and Mn(III)heme– affected, HSA-myristate at 1 : 1 : 3, 1 : 1 : 4.5, and 1 : 1 : 6 molar ratios. Values of pK for the three titration steps, obtained at the different Mn(III)heme–HSA-myristate ratios, have been determined using Eqn (2) (Experimen- tal procedures; Table 2).
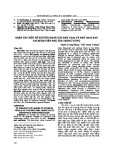
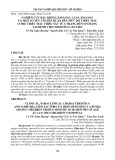
Fig. 4. (A) Absorbance change measured at 440 nm for a solution of 1.0 · 10)5 M Mn(III)heme–HSA as a function of myristate con- centration. Data were obtained at pH 7.0 and 25.0 (cid:1)C. (B) UV-visible absorption spectra of a solution of 1.0 · 10)5 M Mn(III)heme–HSA in the absence (continuous line) and in the presence of 4.5 · 10)5 M myristate (dashed line).
M (dotted line) and 1.0 · 10)4
Mn(III)heme–HSA was titrated with myristate in order to follow the conformational transition(s) associ- ated to the fatty acid binding. As shown in Fig. 4, binding of myristate to Mn(III)heme HSA causes the appearance of a shoulder at 440 nm that disappears on increasing myristate concentration due to the displace- ment of Mn(III)heme from FA1. Here, the equilibrium occurs through three different forms, Mn(III)heme– HSA in the absence of myristate, Mn(III)heme–HSA with myristate bound to site(s) other than FA1 (spec- trum with the shoulder at 440 nm), and free Mn(III)- heme; therefore, no isosbestic points are observed.
conditions,
M.
Fig. 6. Water proton relaxation rates measured at 10 MHz and 25.0 (cid:1)C, as functions of pH, for fatty acid-free Mn(III)heme–HSA (solid squares), Mn(III)heme–HSA–myristate at 1 : 1 : 3 (solid tri- angles), 1 : 1 : 4.5 (open diamonds), and 1 : 1 : 6 molar ratios (open circles). The continuous lines were calculated according to Eqn (2). Results of the fitting are given in Table 2. Under all the experi- mental the Mn(III)heme–HSA concentration was 1.0 · 10)3
A consistent behavior has been observed by measur- ing the paramagnetic contribution of Mn(III)heme to the solvent water proton NMR relaxation rate (Eqn 1 in Experimental procedures). Figure 5 shows the relax- ivity of fatty acid-free Mn(III)heme–HSA observed at 10 MHz, 25.0 (cid:1)C, as a function of the myristate con- centration. The relaxation rate increases, apparently
FEBS Journal 272 (2005) 4672–4683 ª 2005 FEBS
4677
G. Fanali et al.
Myristate and Mn(III)heme binding to HSA–heme
Table 2. pK values of pH-dependent water proton relaxation rates measured at 10 MHz and 25.0 (cid:1)C of fatty acid-free Mn(III)heme– HSA and of Mn(III)heme–HSA-myristate. pK values were obtained by fitting data in Fig. 6 according to Eqn (2).
Mn(III)heme ⁄ HSA ⁄ fatty acid ratio
pK1
pK2
pK3
1 : 1 : 0 1 : 1 : 3 1 : 1 : 4.5 1 : 1 : 6
6.60 ± 0.04 6.30 ± 0.01 5.43 ± 0.01 5.40 ± 0.01
9.40 ± 0.16 8.00 ± 0.02 7.32 ± 0.01 7.40 ± 0.02
11.80 ± 0.05 12.10 ± 0.03 11.40 ± 0.02 11.50 ± 0.03
concentrations. Figure 7
Fig. 7. NMRD profiles of fatty acid-free Mn(III)heme–HSA (solid squares) and of Mn(III)heme–HSA–myristate at 1 : 1 : 3 (solid tri- angles), 1 : 1 : 4.5 (open diamonds), and 1 : 1 : 6 molar ratios (open circles) at pH 7.0 (A) and at pH 10.0 (B). Under all the experimental conditions, Mn(III)heme–HSA concentration was 1.0 · 10)3 M. Data were obtained at 25.0 (cid:1)C.
Contributions to relaxation differ, depending on the conformational state of HSA and on the occupancy of the myristate binding sites. The relaxation rate change is highest between pH 5.5 and 8.0, where HSA is in the the native form (N state). The relaxivity of Mn(III)heme–HSA complex increases with myristate concentration. It should be noticed that at pH lower than 5.5, myristate is expected to be in the protonated form that is not able to bind HSA [34]. Conversely, between pH 8.3 and 11.9 (i.e. where HSA is in the B form), the contribution of Mn(III)heme–HSA-myri- state to paramagnetic relaxation does not differ signifi- cantly from that of fatty acid-free Mn(III)heme–HSA. As myristate binding appears to enhance the relaxiv- ity of Mn(III)heme–HSA, we attempted to gain more information from the analysis of NMRD profiles at various myristate shows NMRD profiles of fatty acid-free Mn(III)heme–HSA obtained at and of Mn(III)heme–HSA-myristate 1 : 1 : 3, 1 : 1 : 4.5, and 1 : 1 : 6 molar ratios at pH 7.0. Note that NMRD profiles are significantly dif- ferent in the high field region whereas at the low frequency limit they are almost coincident. NMRD profiles of Mn(III)heme–HSA as a function of myri- state concentration were also measured at pH 10.0 in order to check whether any change occurred for the B state of HSA as well. As shown in Fig. 7, the NMRD profiles of Mn(III)heme–HSA at pH 10.0 do not appear to be affected by myristate.
Fig. 8. Paramagnetic contribution to the linewidth of the 17O water resonance of 1.6 · 10)3 M solution of Mn(III)heme–HSA as a func- tion of myristate concentration. Solid squares: pH 7.0, HSA N state; open circles: pH 10.0, HSA B state. Data were obtained at 25.0 (cid:1)C.
Optical absorbance spectra are suggestive of different coordination modes of Mn(III)heme in the different conformational states of HSA [35], therefore we meas- ured the paramagnetic contribution to the 17O-NMR linewidth at pH 7.0 and 10.0 as a function of myristate concentration (Fig. 8). For paramagnetic metallopro- teins, the width of the 17O NMR resonance is affected by the presence of the paramagnetic metal through the exchange of water molecules directly coordinated to the metal center, according to Eqn (3) (Experimental pro- cedures) [20]. Unlike protons, 17O nuclei are negligibly affected by dipolar coupling with nearby unpaired
electrons, and the paramagnetic broadening of the 17O resonance is diagnostic of the occurrence of a direct coordination bond between water and Mn(III) [20,36].
FEBS Journal 272 (2005) 4672–4683 ª 2005 FEBS
4678
G. Fanali et al.
Myristate and Mn(III)heme binding to HSA–heme
As shown in Fig. 8, the linewidth change is significant (about 20 Hz) for the protein in the N state, and becomes larger (about 40 Hz) in the presence of satur- ating concentration of myristate. On the other hand, this contribution is almost negligible for HSA in the B state, and starts to increase to about 20 Hz in the pres- ence of high myristate concentration.
Discussion
mation from the N to the B state) is very similar to that induced by myristate binding to site FAx. Indeed, the HSA affinity for Mn(III)heme and the absorbance of Mn(III)heme–HSA increase by factors of about 10 and 3, respectively, and myristate effects become much attenuated. Still, the same interaction(s) that at pH ¼ 7.0 produces marked differences among absorbance curves at various myristate concentrations appear to fully account for the small reshaping of the curve pro- duced by 1.0 · 10)4 m myristate at pH ¼ 10.0.
Myristate binding to HSA determines conformational changes that open the FA1 cavity allowing Mn(III)- heme binding and consequently myristate displacement. Actually, addition of up to three moles of long-chain FAs is reported to enhance the binding of Sudlow’s site I (i.e. FA7) ligands, and this behaviour is usually explained by a cooperative effect established by FA binding to domain III (i.e. to FA4 and FA5) [26,37–39]. On the other hand, myristate bound at the limit of subdomain IA (i.e. to FA2) was suggested to be func- tionally linked to Sudlow’s site I [25]. It should be noticed that binding of more than three equivalents of myristate decreases warfarin affinity for Sudlow’s site I, as Fe(III)heme does [19,21,31,40]. Sudlow’s site II (i.e. FA4) ligands do not appear to be effective in modulating Sudlow’s site I ligands and heme binding properties [21,26].
Myristate binding to HSA affects the Mn(III)heme binding properties. The results presented here indicate that current views – seven FA binding sites, FA1 involved in ipsosterical competition with heme binding, FAx allosterically coupled to FA1, a scale of affinity ratios of about half a decade among FA sites, with dis- sociation constants in the range 10)6)10)8 m, and sev- eral possible allosteric cross interactions among FA sites [1,3,6,9–16,33] – allow us to numerically model the experimental results with good accuracy. In particular, modeling indicates that binding of myristate to FAx not only increases optical absorbance of Mn(III)heme- bound HSA by a factor of (cid:1) 3, but also increases FA1 affinity for Mn(III)heme by 10–500-fold (depending on the assumptions about possible similar changes in affin- ity of FA1 for myristate). This brings the value of HSA affinity for Mn(III)heme, with myristate bound to FAx, in the range of HSA affinity for Fe(III)heme [32]. Fur- thermore, modeling indicates that positive cooperation between an accessory FA site (with affinity 0.8– 1.5 · 10)7 m for myristate) and FAx is needed to account for the shape of the DA curves (Fig. 2A).
absorbance of
superimposable
(A10) becomes comparable to that of
At pH 10.0 (i.e. where HSA is in the B state), Mn(III)heme binds more strongly to HSA than at pH 7.0 (i.e. where HSA is in the N state) even in the absence of myristate, with KH (cid:1) 10)6 m (Fig. 3). Moreover, in the presence of saturating concentrations of myristate, the tendency of the curve to become sig- moidal is much attenuated, suggesting a substantial impairment of allosteric modulation by myristate bind- ing to FAx. Numerical analysis of the data, using the same models that fit the data at pH 7.0, indicate that, independently of the model assumptions, both FAx affinity for myristate and allosteric modulation of FA1 are reduced, whereas cooperation of accessory sites and FAx is almost unaffected. Furthermore, the the Mn(III)heme–HSA asymptotic the adduct Mn(III)heme–HSA-(FAx+myristate) complex (A10*), whereas the latter is not altered by the change in pH. these observations strongly suggest Taken together, that the conformational changes produced by changing the pH from 7.0 to 10.0 (i.e. shifting the HSA confor-
The marked variation in the optical absorbance spectrum of Mn(III)heme–HSA induced by myristate binding at pH 7.0 might be explained in terms of a change in the coordination sphere of Mn(III) [35]. Although structural data for Mn(III)heme–HSA are not available yet, evidence for a Mn(III)-coordinated water molecule was gained by 17O-NMR linewidth measurements, that showed a transverse relaxation rate different from Fe(III)heme–HSA, where no Fe(III)- coordinated water molecule(s) were observed [20]. On the other hand, both X-ray structures deposited in PDB so far for Fe(III)heme–HSA display the Tyr161 residue as the only axial ligand for Fe(III) [6,8]. In the absence of myristate, Mn(III)heme–HSA in the N state has a water molecule coordinated to the metal (Fig. 8) that could provide a source for paramagnetic relaxa- tion of the solvent water bulk. This is at difference with Fe(III)heme, due to the different affinity of the metals for phenolic oxygen ligands [6,8]. Nevertheless, this contribution is not evident from the NMRD pro- file, which is almost to that of Mn(III)heme–HSA in the B state. This finding could indicate that there is a water molecule coordinated at both pH but that its exchange is limiting the relaxivity. Therefore, the binding of myristate seems to markedly increase the exchange rate and induce a relaxivity
FEBS Journal 272 (2005) 4672–4683 ª 2005 FEBS
4679
G. Fanali et al.
Myristate and Mn(III)heme binding to HSA–heme
enhancement, although at pH 10.0 the possible increase in the exchange rate by myristate is incapable to induce a significant increase of the relaxivity.
covalent dimers was
At pH 10.0 (i.e. when HSA is in the B state), 17O-NMR linewidth measurements show no evidence of water molecules coordinated to Mn(III)heme, as already observed in the case of Fe(III)heme–HSA. Two hypo- theses should be taken into consideration: either the absence of water molecules in the coordination sphere of the metal ion, or the presence of one water molecule with a very slow exchange rate. Myristate binding to HSA might increase the exchange rate, thereby produ- cing a small broadening, but this is only observed at pH 7.0. The structural similarity of Mn(III)heme vs. Fe(III)heme and the structural evidence of a penta- coordinated Fe(III) atom, with no water molecules coordinated to it, favour the first hypothesis: in this case, upon deprotonation at pH 10.0 the phenolic Tyr161 oxygen becomes more nucleophylic and displa- ces the Mn(III)-coordinated water molecule with the consequent quenching of the paramagnetic relaxation.
without further purification. HSA was essentially fatty acid- free according to the charcoal delipidation protocol [41–43] and used without any further purification. Absence of signi- ficant amounts of checked by MALDI-TOF mass spectrometry. Mn(III)heme was pre- pared as previously reported [28]. The actual concentration of the Mn(III)heme stock solution was checked as bis- imidazolate complex in sodium dodecyl sulfate micelles with an extinction coefficient of 10.3 cm)1Æmm)1 (at 556 nm) [44]. Mn(III)heme–HSA was prepared by adding the appropriate volume of 3.0 · 10)2 m Mn(III)heme dis- solved in 1.0 · 10)1 m NaOH to a 1.0 · 10)3 m HSA solu- tion in NaCl ⁄ Pi (1.0 · 10)2 m phosphate buffer, 0.15 m solution of Mn(III)heme–HSA was NaCl). The final 1.0 · 10)3 m. Under all the experimental conditions, no free Mn(III)heme was present in the reaction mixtures. The act- ual concentration of the HSA stock solution was deter- mined by using the Bradford method [45].
Conclusions
the Mn(III)heme
to FA1 in the
The conformational transition(s) driven by myristate binding to HSA may be efficiently monitored by taking advantage of the optical and relaxometric pro- perties of label. Mn(III)heme binds fatty acid-free HSA with KH (cid:1) 2.0 · 10)5 m; myristate not only competitively binds to FA1, but also binds to a different site(s) and induces conformational changes that lowers the equi- librium constant for Mn(III)heme binding to the FA1 site by a factor of 10–500 (depending on possible modulation of myristate binding to FA1). This con- formational change(s) also favours the exchange of the Mn(III)-coordinated water molecule with the solvent bulk. At pH ¼ 10.0, Mn(III)heme binds to HSA with higher affinity even in the absence of myristate, releas- ing the metal-coordinated water molecule.
The sodium myristate 0.1 m solution was prepared by adding 0.1 m fatty acid to NaOH 0.1 m. The solution was heated to 100 (cid:1)C and stirred to dissolve the fatty acid. The sodium myristate solution was then mixed with 1.0 · 10)3 m Mn(III)heme–HSA (fatty acid free) to achieve the desired fatty acid to protein molar ratio. The Mn(III)- heme–HSA-myristate complex was incubated for one hour at room temperature with continuous stirring [6]. Sample pH was changed by adding a few lL of 0.1 m HCl or NaOH solutions.
As a general remark, NMRD data prove a valuable complement to X-ray crystallography to add dynamic information to structural data, and to provide thermo- dynamic description of the binding equilibria. As an addition to conventional optical methods, NMRD pro- vides a useful hint to follow environment changes that involve the coordination sphere of the paramagnetic metal.
Binding experiments of Mn(III)heme to HSA-myristate and titrations of Mn(III)heme–HSA with myristate were investigated spectrophotometrically using an optical cell with 1.0-cm path length on a Cary 50 Bio spectrophotome- ter (Varian Inc., Palo Alto, CA, USA). In a typical experi- ment, a small amount of a solution of Mn(III)heme in NaOH (about 3.0 · 10)3 m) was diluted in the optical cell with a solution of 1.0 · 10)4 m sodium myristate in a sol- vent mixture of DMSO-aqueous 0.1 m phosphate buffer pH 7.0 to a final chromophore concentration of 1.0 · 10)5 m. This solution was titrated with HSA by adding small amounts of a 1.0 · 10)3 m protein solution in the aqueous buffer and recording the spectrum after incubation for a few min after each addition. Difference spectra with respect to Mn(III)heme were taken and the binding iso- therm was analyzed by plotting the difference of absorb- ance between the maximum and the minimum of the two-signed difference spectra against the protein concentra- tion [27].
Experimental procedures
FEBS Journal 272 (2005) 4672–4683 ª 2005 FEBS
4680
Data have been numerically analyzed using the matlab language (The MathWorks, Natick, MA, USA) according to Scheme 1, with the following dissociation equilibrium constants: KH for Mn(III)heme binding to site FA1; KM for myristate binding to site FA1 and competing ipsosterically with Mn(III)heme; KM* for myristate binding to site FAx, M for Mn(III)heme bind- allosterically coupled to FA1; K H ing to the HSA–myristate complex, with myristate bound All reagents were purchased from Sigma-Aldrich (St Louis, MO, USA), were of highest purity available, and were used
G. Fanali et al.
Myristate and Mn(III)heme binding to HSA–heme
H ¼ (KM* · K H
to FAx. Accordingly, the dissociation constant for myri- state binding to FAx with FA1 occupied by Mn(III)heme M) ⁄ KH [46]. Five additional was set to K M S5 have been introduced S1 to K M dissociation constants K M in the model to take into account subtraction of myristate by additional binding sites no. 1 to 5 essentially uncoupled to FA1 and ⁄ or FAx. Fatty acid binding sites (FA1 to FA7) are numbered according to literature [6,7,14].
Water proton T1 measurements at 10 MHz, at 25.0 (cid:1)C and at variable pH were obtained on a Stelar Spinmaster- FFC fast field cycling relaxometer (Stelar, Mede, Italy) with 16 experiments in four scans. The reproducibility in T1 measurements was ± 0.5%. inner diameter tunable broadband probehead, by using a D2O external lock. Sample solutions were supplemented 17O (Cortec Ltd, Paris, France) to an iso- with enriched H2 topic abundance of 2%. Experimental settings: spectral width 6.0 kHz, 90(cid:1) pulse 16 ls, acquisition time 0.47 s, 128 scans, no sample spinning [20]. Paramagnetic contributions 17O-NMR linewidth (DW) were obtained by to the 17O signal in the presence subtracting the width of the H2 17O signal in the the H2 of HSA from the width of presence of Mn(III)heme–HSA at different myristate con- centrations. DW values are related to the transverse relaxa- tion time of the directly coordinated water oxygen (TO 2M) by Eqn (3):
obs) at magnetic field strengths
1H nuclear magnetic relaxation dispersion (NMRD) pro- files were recorded at variable concentration of myristate by measuring water proton longitudinal relaxation rates in the range from (R1 2.4 · 10)4 to 0.235 T (corresponding to 0.01–10 MHz pro- ton Larmor frequencies) with the field cycling relaxometer described above.
(cid:3) ð3Þ DW ¼ ½M(cid:2)q 55:56 1 TO 2M þ sM
obs) the blank relaxation rate value (R1
where sM is the exchange lifetime of the metal-coordinated water molecule, [M] is the concentration of the paramag- netic metal ion, and q is the number of water molecules coordinated to it. The oxygen transverse relaxation time TO 2M is dominated by the electron–nucleus scalar interac- tion, that occurs only in the presence of direct oxygen-water coordination [36].
In all figures, error bars have been omitted for clarity as all errors have been observed to be less than 2% of the measured values.
Acknowledgements
This work was supported by the Italian Ministry for Instruction, University and Research. Part of the work has been performed at the Bioindustry Park Canavese, Colleretto Giacosa (TO), Italy.
the paramagnetic
References
The R1p relaxivity values (i.e. paramagnetic contributions to the solvent water longitudinal relaxation rate referenced to a 1.0 mm concentration of paramagnetic agent) were determined by subtracting from the observed relaxation dia) measured rate (R1 for the buffer at the experimental temperature, divided by the concentration of the paramagnetic species. For 1H nuc- lei, R1p values are mostly affected by dipolar interaction with unpaired electrons of center. Unbound water protons relax by means of diffusion– controlled dipolar interaction (outer sphere contribution, R1os – see Eqn 1), whereas for water molecules coordinated to the metal ion or bound to the protein in close proximity of the paramagnetic center the dipolar interaction is modu- lated by the reorientation of the macromolecule with respect to the applied magnetic field. The latter term is des- cribed by Eqn (1): 1 Spector AA (1975) Fatty acid binding to plasma albu- min. J Lipid Res 16, 165–179. (cid:3) ð1Þ R1p ¼ R1os þ ½M(cid:2)q 55:56 1 T1M þ sM
2 Sudlow G, Birkett DJ & Wade DN (1975) The charac- terization of two specific drug binding sites on human serum albumin. Mol Pharmacol 11, 824–832.
where sM is the exchange lifetime and q is the number of water molecules close to the metal centre. [M] is the con- centration of the paramagnetic metal ion, and T1M is the longitudinal relaxation time of localized water protons [20,36]. Relaxivity of Mn(III)heme–HSA solutions at 25.0 (cid:1)C as 3 Hamilton JA, Cistola DP, Morrisett JD, Sparrow JT & Small DM (1984) Interactions of myristic acid with bovine serum albumin: a 13C NMR study. Proc Natl Acad Sci USA 81, 3718–3722. a function of pH was analyzed according to Eqn (2): 4 He X & Carter DC (1992) Atomic structure and chemis-
X ð2Þ R1p ¼ C0 þ Ci 1 þ ½Hþ(cid:2)=Ki
i where C0 is the R1p value at the low pH limit, Ki is the thermodynamic constant of the i-th titration, and Ci is the R1p change associated to the i-th titration.
try of human serum albumin. Nature 358, 209–215. 5 Peters T Jr (1996) All about albumin: biochemistry, gen- etics and medical applications. Academic Press, Orlando, FL, USA.
17O-NMR linewidth measurements at 25.0 (cid:1)C were recor- ded at 7.0 T on a Bruker Avance 300 spectrometer (Bruker Biospin, Rheinstetten, Germany), equipped with a 5 mm
FEBS Journal 272 (2005) 4672–4683 ª 2005 FEBS
4681
6 Zunszain PA, Ghuman J, Komatsu T, Tsuchida E & Curry S (2003) Crystal structural analysis of human serum albumin complexed with hemin and fatty acid. Struct Biol 3, 6.
G. Fanali et al.
Myristate and Mn(III)heme binding to HSA–heme
21 Mattu M, Vannini A, Coletta M, Fasano M & Ascenzi P (2001) Effect of bezafibrate and clofibrate on the heme-iron geometry of ferrous nitrosylated heme-human serum albumin: an EPR study. J Inorg Biochem 84, 293–296. 7 Petitpas I, Petersen CE, Ha CE, Bhattacharya AA, Zunszain PA, Ghuman J, Bhagavan NV & Curry S (2003) Structural basis of albumin–thyroxine inter- actions and familial dysalbuminemic hyperthyroxinemia. Proc Natl Acad Sci USA 100, 6440–6445. 22 Fasano M, Mattu M, Coletta M & Ascenzi P (2002)
8 Wardell M, Wang Z, Ho JX, Robert J, Ru¨ ker F, Ruble J & Carter DC (2002) The atomic structure of human methemalbumin at 1.9 A˚ . Biochem Biophys Res Commun 291, 813–819. The heme-iron geometry of ferrous nitrosylated heme- serum lipoproteins, hemopexin, and albumin: a com- parative EPR study. J Inorg Biochem 91, 487–490. 23 Ascenzi P, Bocedi A, Bolli A, Fasano M, Notari S &
Polticelli F (2005) Allosteric modulation of monomeric proteins. Biochem Mol Biol Educ 33, 169–176. 9 Reed RG, Feldhoff RC, Clute OL & Peters T Jr (1975) Fragments of bovine serum albumin produced by lim- ited proteolysis. Conformation and ligand binding. Biochemistry 14, 4578–4583.
10 Reed RG (1986) Location of long chain fatty acid-bind- ing sites of bovine serum albumin by affinity labeling. J Biol Chem 261, 15619–15624. 24 Bhattacharya AA, Curry S & Franks NP (2000) Binding of the general anesthetics propofol and halothane to human serum albumin. High resolution crystal struc- tures. J Biol Chem 275, 38731–38738.
25 Petitpas I, Bhattacharya AA, Twine S, East M & Curry S (2001) Crystal structure analysis of warfarin binding to human serum albumin: anatomy of drug site I. J Biol Chem 276, 22804–22809. 11 Cistola DP, Small DM & Hamilton JA (1987) Carbon 13 NMR studies of saturated fatty acids bound to bovine serum albumin. I. The filling of individual fatty acid binding sites. J Biol Chem 262, 10971–10979. 12 Hamilton JA, Era S, Bhamidipati SP & Reed RG 26 Chuang VTG & Otagiri M (2002) How do fatty acids
cause allosteric binding of drugs to human serum albu- min? Pharm Res 19, 1458–1464. (1991) Locations of the three primary binding sites for long-chain fatty acids on bovine serum albumin. Proc Natl Acad Sci USA 88, 2051–2054.
13 Curry S, Mandelkow H, Brick P & Franks N (1998) Crystal structure of human complexed with fatty acid reveals an asymmetric distribution of binding sites. Nat Struct Biol 5, 751–753. 27 Monzani E, Curto M, Galliano M, Minchiotti L, Aime S, Baroni S, Fasano M, Amoresano A, Salzano AM, Pucci P & Casella L (2002) Binding and relaxometric properties of heme complexes with cyanogen bromide fragments of human serum albumin. Biophys J 83, 2248–2258.
14 Bhattacharya AA, Gru¨ ne T & Curry S (2000) Crystallo- graphic analysis reveals common modes of binding of medium and long chain fatty acids to human serum albumin. J Mol Biol 303, 721–732. 28 Boucher LJ (1968) Manganese porphyrin complexes. I. Synthesis and spectroscopy of manganese (III) proto- porphyrin IX dimethyl ester halides. J Am Chem Soc 90, 6640–6645.
15 Choi JK, Ho J, Curry S, Qin D, Bittman R & Hamilton JA (2002) Interactions of very long-chain saturated fatty acids with serum albumin. J Lipid Res 43, 1000–1010. 16 Curry S (2002) Beyond expansion: structural studies on the transport roles of human serum albumin. Vox Sang 83 (Suppl. 1), 315–319. 17 Hamilton JA (2004) Fatty acid interactions with pro-
teins: what X-ray crystal and NMR solution structures tell us. Prog Lipid Res 43, 177–199. 29 Wilting J, van der Giesen WF, Janssen LH, Weideman MM, Otagiri M & Perrin JH (1980) The effect of albu- min conformation on the binding of warfarin to human serum albumin. The dependence of the binding of war- farin to human serum albumin on the hydrogen, cal- cium, and chloride ion concentrations as studied by circular dichroism, fluorescence, and equilibrium dialy- sis. J Biol Chem 255, 3032–3037. 30 Janssen LH, Van Wilgenburg MT & Wilting J (1981)
18 Yamasaki K, Maruyama T, Yoshimoto K, Tsutsumi Y, Narazaki R, Fukuhara A, Kragh-Hansen U & Otagiri M (1999) Interactive binding to the two principal ligand binding sites of human serum albumin: effect of the neutral-to-base transition. Biochim Biophys Acta 1432, 313–323.
Human serum albumin as an allosteric two-state protein. Evidence from effects of calcium and warfarin on proton binding behaviour. Biochim Biophys Acta 669, 244–250. 31 Ascenzi P, Bocedi A, Notari S, Menegatti E & Fasano M (2005) Heme impairs allosterically drug binding to human serum albumin Sudlow’s site I. Biochem Biophys Res Commun 334, 481–486.
19 Baroni S, Mattu M, Vannini A, Cipollone R, Aime S, Ascenzi P & Fasano M (2001) Effect of ibuprofen and warfarin on the allosteric properties of haem–human serum albumin. A spectroscopic study. Eur J Biochem 268, 6214–6220. 32 Adams PA & Berman MC (1980) Kinetics and mechan- ism of the interaction between human serum albumin and monomeric haemin. Biochem J 191, 95–102. 33 Ashbrook JD, Spector AA, Santos EC & Fletcher JE
FEBS Journal 272 (2005) 4672–4683 ª 2005 FEBS
4682
20 Fasano M, Baroni S, Vannini A, Ascenzi P & Aime S (2001) Relaxometric characterization of human hemal- bumin. J Biol Inorg Chem 6, 650–658. (1975) Long chain fatty acid binding to human plasma albumin. J Biol Chem 250, 2333–2338.
G. Fanali et al.
Myristate and Mn(III)heme binding to HSA–heme
40 Kragh-Hansen U (1981) Molecular aspects of ligand binding to serum albumin. Pharmacol Rev 33, 17–53. 41 Chen RF (1967) Removal of fatty acids from serum 34 Pedersen AO, Mensberg KD & Kragh-Hansen U (1995) Effect of ionic strength and pH on the binding of med- ium-chain fatty acids to human serum albumin. Eur J Biochem 233, 395–405. albumin by charcoal treatment. J Biol Chem 242, 173– 181.
35 Ikezaki A & Nakamura M (2003) Importance of the C–H. . .N weak hydrogen bonding on the coordination structures of manganese (III) porphyrin complexes. Inorg Chem 42, 2301–2310. 42 Sogami M & Foster JF (1968) Isomerization reactions of charcoal-defatted bovine plasma albumin. The N-F transition and acid expansion. Biochemistry 7, 2172– 2182.
36 Aime S, Botta M, Fasano M, Geninatti Crich S & Ter- reno E (1999) 1H and 17O-NMR relaxometric investiga- tions of paramagnetic contrast agents for MRI. Clues for higher relaxivities. Coord Chem Rev 186, 321–333. 37 Wilding G, Feldhoff RC & Vesell ES (1977) Concentra- tion-dependent effects of fatty acids on warfarin binding to albumin. Biochem Pharmacol 26, 1143–1146. 38 Rietbrock N, Menke G, Reuter G, Lassmann A & 43 Cabrera-Crespo J, Goncalves VM, Martins EA, Grellet S, Lopes AP & Raw I (2000) Albumin purification from human placenta. Biotechnol Appl Biochem 31, 101–106. 44 Boffi A, Das TK, Della Longa S, Spagnuolo C & Rous- seau DL (1999) Pentacoordinate hemin derivatives in sodium dodecyl sulfate micelles: model systems for the assignment of the fifth ligand in ferric heme proteins. Biophys J 77, 1143–1149. 45 Bradford MM (1976) A rapid and sensitive method of
Schmeidl R (1985) Influence of palmitate and oleate on the binding of warfarin to human serum albumin: stopped-flow studies. J Clin Chem Clin Biochem 23, 719–723. quantitation of microgram quantities of protein utilizing the principle of protein-dye-binding. Anal Biochem 72, 248–254.
FEBS Journal 272 (2005) 4672–4683 ª 2005 FEBS
4683
46 Wyman J (1964) Linked functions and reciprocal effects in hemoglobin: a second look. Adv Protein Chem 19, 223–286. 39 Vorum H & Honore B (1996) Influence of fatty acids on the binding of warfarin and phenprocoumon to human serum albumin with relation to anticoagulant therapy. J Pharm Pharmacol 48, 870–875.