
Original article
Estimating the foliage area of Maritime pine
(Pinus pinaster Aït.) branches and crowns
with application to modelling the foliage area
distribution in the crown
Annabel Portéa,*, Alexandre Bosca, Isabelle Championband Denis Loustaua
a INRA Pierroton, Station de Recherches Forestières, Laboratoire d'Écophysiologie et de Nutrition,
BP. 45, F-33611 Gazinet Cedex, France
b INRA Laboratoire de Bioclimatologie, BP. 81, F-33833 Villenave d'Ornon, France
(Received 26 August 1998; accepted 4 October 1999)
Abstract – Destructive measurements of architecture and biomass were performed on 63 trees from three Pinus pinaster stands (5,
21 and 26 year-old) in order to determine the quantity and distribution of foliage area inside the crown. Allometric equations were
developed per site and needle age, which allowed to correctly calculate (R2= 0.71 to 0.79) the foliage area of a branch, knowing its
basal diameter and its relative insertion height in the crown. Using these equations, we estimated total crown foliage area. A non-lin-
ear function of tree diameter and tree age was fitted to these data (R2= 0.82 and 0.88). On the 5 and 26 year-old stands, we combined
the branch level models and the architectural measurements to develop probability functions describing the vertical and horizontal
foliage area distributions inside the crown. The parameters of the beta functions varied with needle and stand age, foliage being locat-
ed mostly in the upper and outer part of the crown for the adult tree, whereas it was more abundant in the inner and lower parts of the
crown in the 5 year-old trees. A simple representation of crown shape was added to the study, so that knowing tree age and diameter,
it could be possible to fully describe the quantity of foliage area and its localisation inside a maritime pine crown.
maritime pine / foliage area / foliage distribution / allometric relationship
Résumé –Estimation de la surface foliaire de branches et de houppiers de Pin maritime (Pinus pinaster Aït.) et son applica-
tion pour modéliser la distribution de la surface foliaire dans le houppier. Afin de déterminer la quantité et la distribution de la
surface foliaire dans un houppier de pin maritime, nous avons réalisé une analyse destructive de l'architecture et de la biomasse de 63
arbres issus de trois peuplements âgés de 5, 21 et 26 ans. Des équations allométriques par peuplement et année foliaire permettent de
calculer correctement (R2= 0,71 à 0,79) la surface foliaire d'une branche connaissant son diamètre et sa hauteur relative d’insertion.
L’utilisation de ces équations a permis d’estimer la surface foliaire totale du houppier. Un modèle arbre correspondant à une fonction
puissance du diamètre de l’arbre et de l’inverse de son âge a été ajusté sur ces valeurs (R2= 0,80 et 0,88). D’autre part, la combinai-
son des modèles branches et des mesures architecturales a permis de paramétrer des fonctions de type bêta, sur les sites de 5 et
26 ans, décrivant les distributions verticales et horizontales de la surface foliaire dans le houppier. Leurs paramètres variaient avec
l’âge du site et de la cohorte : le feuillage étant localisé dans la partie supérieure et extérieure du houppier chez les arbres adultes, et
davantage vers le bas et l’intérieur de la couronne des arbres de 5 ans. Une représentation simplifiée de la forme du houppier a été
ajoutée à l’établissement des profils de surface foliaire afin que la connaissance de l’âge et du diamètre à 1,30 m d’un pin maritime
suffisent à établir une description quantitative et qualitative de son feuillage.
pin maritime / surface foliaire / distribution foliaire / relations allométriques
Ann. For. Sci. 57 (2000) 73–86 73
© INRA, EDP Sciences 2000
* Correspondence and reprints
Tel. (33) 05 57 97 90 34; Fax. (33) 05 56 68 05 46; e-mail: Annabel.Porte@pierroton.inra.fr

A. Porté et al.
74
1. INTRODUCTION
Appreciation of forest structure is determinant in
studying stand growth and functioning. In forestry, stand
structure mostly refers to the relative position of trees
and to stem and crown dimensions. However, estimating
the amount and the location of the tree foliage area is a
critical point in order to model its biological functioning
[17, 27, 40]. Since direct measurements of foliage distri-
bution are nearly impossible to perform in forest stands,
they have been replaced by sampling procedures. At the
stand level, the plant area index (including the projected
area of all aerial elements of the stand) can be assessed
from light interception measurements. However, such a
technique does not describe the foliage spatial distribu-
tion. Allometric relationships constitute an accurate tool,
many times used to estimate and predict the amounts and
the distributions of foliage or crown wood in trees [1, 3,
39]. Foliage distributions can be required in light inter-
ception models [40], and coupled to CO2, vapour pres-
sure and temperature profiles to determine canopy
carbon assimilation.
In the Landes de Gascogne Forest, a general drying
has been observed that resulted into a disappearing of
lagoons (1983-1995: –49%) and a lowering of the water
table level up to 44%. From these observations, scientists
raised a new problematic [18]: how can we maintain the
equilibrium of the Landes forest in terms of wood pro-
duction without exhausting the natural resources? To
enter such a question, we investigated upon the response
of Maritime pine to water availability in terms of prima-
ry production and growth. To overcome the problem of
duration which prevents from studying the whole life
cycle of a forest, scientists have been developing models.
Structure-function models provide a highly detailed
description of tree functioning but require numerous
parameters [6, 11, 19, 29, 31]. Pure statistical models are
based on data measurements and quite easy to handle but
they remain too empirical to be used as growth predic-
tors in a changing environment [20, 21, 37]. In between,
semi-empirical approaches were developed [1, 2, 23, 18]
that lay on quite rough hypothesis when compared to
real functioning. However, they permitted to describe
complex processes in a simple way, and to build growth
models sensitive to environmental conditions. As a nec-
essary first step in the semi-empirical and ecophysiologi-
cal modelling of Maritime pine (Pinus pinaster Aït.)
growth in the Landes de Gascogne, we undertook the
determination of stand foliage area amount and distribu-
tion. Previous studies on Maritime pine partially solved
the problem [22]. First, they did not discriminate needles
according to their age, which is an important factor
regarding their physical and physiological characteristics
[5, 30]. Moreover, the study had only been done for a 16
year-old stand. Considering maritime pine, as the tree
gets older, branches sprung at the top of the crown lower
down. At the same time, they change their geometry and
their amount of surface area.
Therefore, the first objective was to develop equations
permitting to predict the needle area of a branch and of a
tree, whatever stand age could be. We worked on a
chronosequence of stands (5, 21 and 26 year-old stands)
considered to represent the same humid Lande maritime
pine forest at different ages. The second objective was to
model foliage distribution in the crown to supply infor-
mation to light interception and radiation use models that
were under construction in the laboratory. Foliage area
amounts were estimated using the developed allometric
equations and coupled to architectural crown measure-
ments in order to describe vertical and horizontal leaf
area density profiles.
2. MATERIAL AND METHODS
2.1. Stands characteristics
The study was undertaken on two stands located
20 km Southwest of Bordeaux, France (44°42 N, 0°46 W).
They had an average annual temperature of 12.5 °C and
receive annual rainfall averaging 930 mm (1951-1990).
The Bray and L sites were even-aged maritime pine
stands originating from row seeding, with an understorey
consisting mainly of Molinia (Molinia coerulea
Moench.). Stand characteristics are summarised in table
V. Since 1987, the Bray forest has been studied for water
relations, tree transpiration and energy balance [4, 5, 13,
14, 24].
2.2. Data collection
Caution: the term foliage area always refers to the all-
sided foliage area of the needles. Projected area only
appears in leaf area index (LAI, m2m–2) values and is
calculated by dividing all-sided area by (1 + π/2) which
correspond to a projection assuming needles to be semi-
cylinders. Symbols used are presented in table A1
(Appendix 1).
Similar studies were done in 1990 and 1995 on the
Bray site (21 and 26 year-old) and in 1997 on the L site
(5 year-old). On the Bray site, diameter at breast height
(DBH, cm, measured at 1.30 m high) was measured for
each tree of the experimental plot (table V, n= 3897 and
2920) whereas on the younger trees, only total height
could be measured. Trees were studied for architectural
and biomass measurements. In order to represent the
stand distribution, we sampled 19 trees in 1990 and
Maritime pine foliage area 75
14 trees in 1995, according to their diameter at breast
height (DBH, cm) and 30 trees in 1997 according to their
height. In winter time (late November to February) the
21 and 26 year-old trees were fallen carefully to min-
imise the damage to the crowns, and the 5 year-old trees
were pulled off the ground with a Caterpillar. The coarse
roots were studied for architectural measurements [7, 8]
and wood characteristics with regards to wind loading
[33, 34]. On the ground, the lengths (L, nearest 0.5 cm)
and the diameters (D, measured in the middle of the
growth unit, nearest 0.1 cm) of each annual growth unit
of the trunks were measured (figure 1). The diameter of
each living branch (D10, cm, measured at the nearest
0.01 cm, diameter at about ten cm from the bole) was
measured with an electronic calliper. Two branches per
living whorl were selected for more detailed measure-
ments (195 branches in 1990, 186 branches in 1995, 265
branches in 1997, for the stand). In 1995 and 1997,
detailed architectural measurements were done on each
sampled branch: branch length (Lb), chord length (C),
insertion angle between chord and bole (α) were mea-
sured; lengths (Lj) and diameters (Dj, measured in the
middle of the growth unit) were obtained for all 2nd order
internodes (figure 1). Polycyclism of tree growth is an
important phenomenon during early growth [16].
Therefore, on younger trees, we paid attention to
describe this phenomenon: the first growth cycle of the
annual growth unit is named A, the second B, etc.
Branch analysis was done separately for each cycle
because from the 2nd cycle, growth tends to be less than
during the 1st annual flush. During all studies, one
branch per pair was randomly selected for determination
of foliage biomass. Branch foliage was separated into
compartments according to needle age, the 2nd order
internode on which it was inserted and its order of rami-
fication (figure 1). Needles located on the trunk were
entirely collected. Foliage was oven-dried at 65 °C for
48h and weighted. Ten needle pairs were randomly col-
lected, per needle age class (1 to 3 year-old), per whorl
and per tree, in order to determine their specific leaf area
(SLA, m2kg–1). The middle diameter and the length of
each needle was measured to calculate its area assuming
needles to be semi-cylinders. Their total dry weight
(oven-dried at 65 °C during 48 h) was measured, and
SLA calculated as the ratio of needles area per their
weight (m2kg–1). The foliage area of each compartment
was estimated multiplying its dry weight with the corre-
sponding SLA.
From November 1996 to January 1997, during an
independent study, a set of 108 branches was collected
from 10 trees (27 year-old) representative of the Bray
site DBH distribution. D10, total needle area per needle
age were measured and SLA values calculated and used
to estimate the branch foliage area, for one branch per
whorl. This additional data set was used for testing the
allometric relationships established in 1995 at the Bray
site.
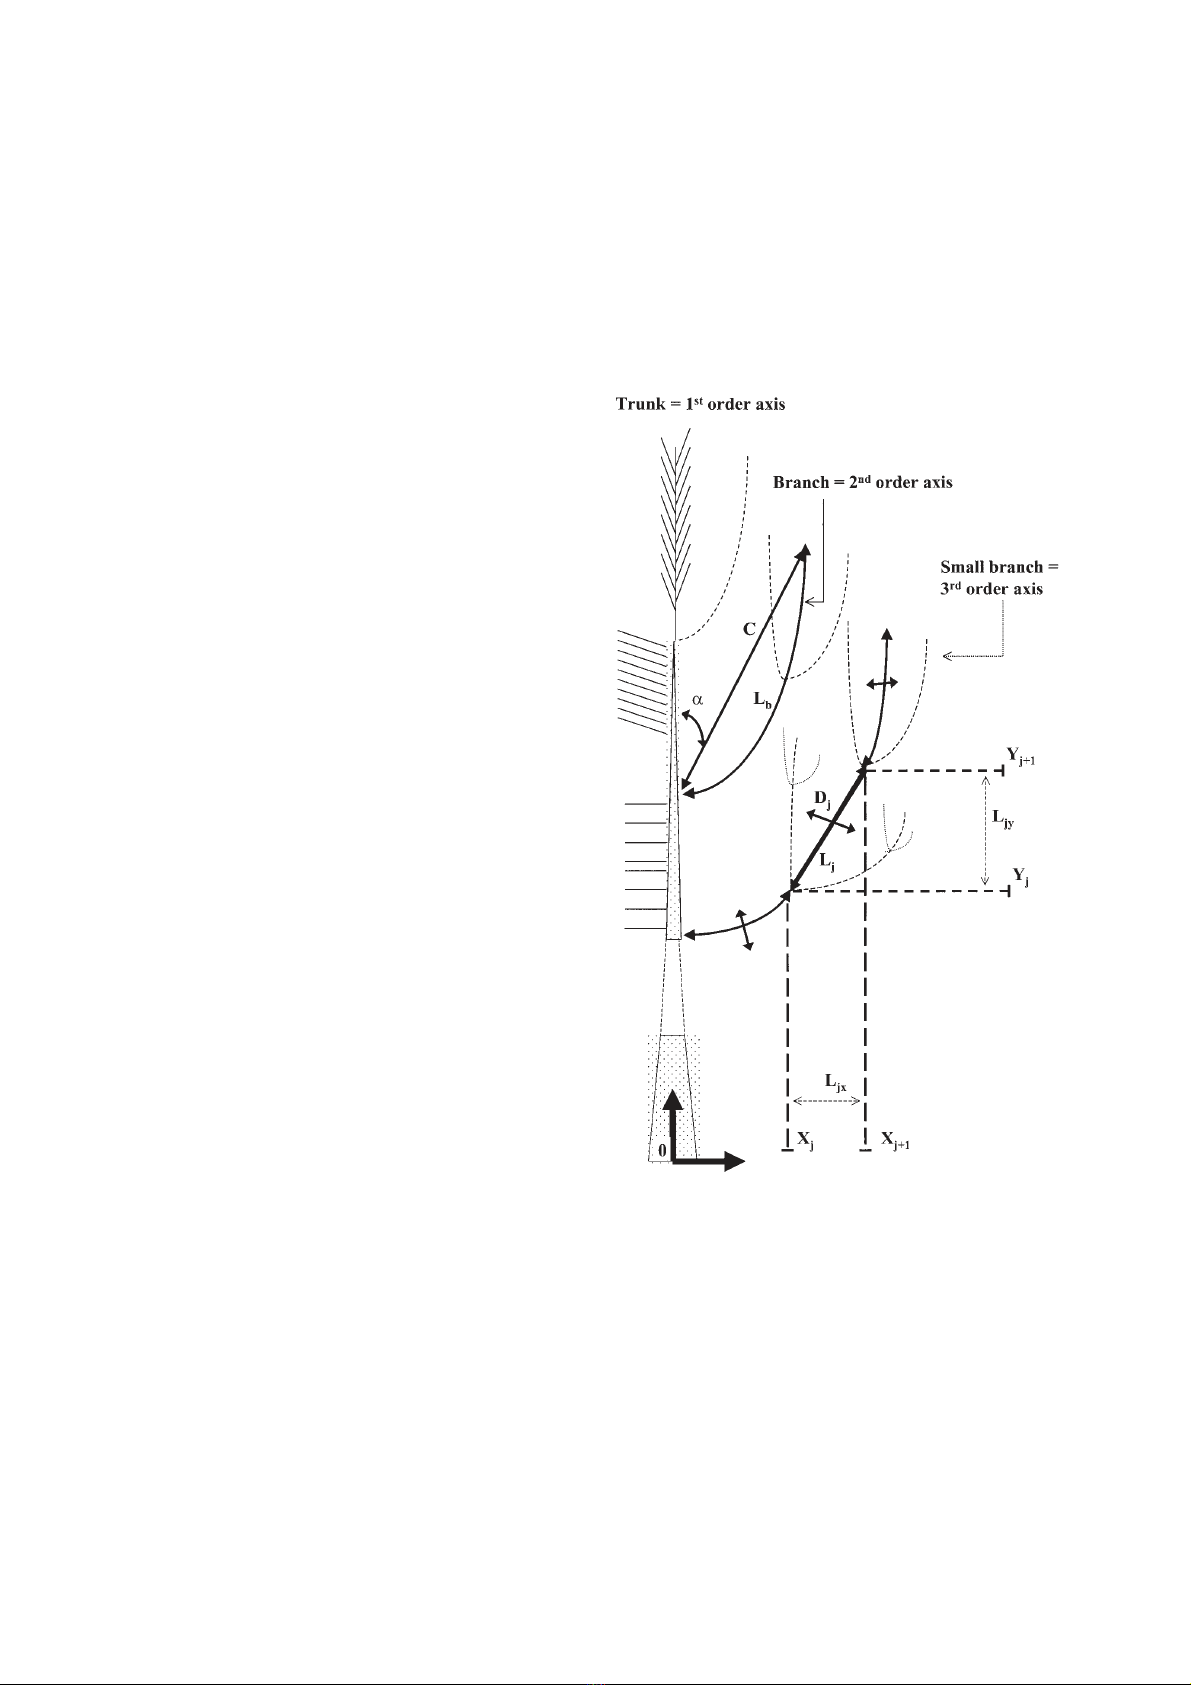
Figure 1. Diagram of a maritime pine presenting the detail of
the architectural measurements done on the sampled branches.
Branch length (Lb), chord length (C), bole-chord angle (α),
length (Lj) and diameter (Dj) of each internode of the branch.
Xj, Xj+1, Yj, Yj+1 are the co-ordinates of the ends of the intern-
ode. The total foliage area borne by the internode (2nd order)
and the 3rd order branches inserted on this internode was
assumed to be uniformly distributed along Ljy to determine the
vertical distribution of foliage area, and uniformly distributed
along Ljx for the horizontal distribution of foliage area.

A. Porté et al.
76
2.3. Statistical analysis
Various linear and non-linear regression models were
fitted to our data sets using the SAS software package
(SAS 6.11, SAS Institute Inc., Cary, NC, 1989-1995).
The choice of the final model was based on several crite-
ria: best fitting on the sample population (characterised
with adjusted R2values, residual sums of square, residual
mean square, Fvalues of regressors, residual plots), the
biological significance of the variables used as regres-
sors, its simplicity (minimum number of regressors) and
its use as an estimating tool when extrapolating to the
total population. Multiple range tests were used to com-
pare mean values (Student Newman Keuls). Means with
the same letters are considered not to be significantly
different at the 5% tolerance level.
2.4. Distributions of foliage area density
This part of the work was completed on the 5 (L) and
26 year-old stands (Bray95). It was based on the follow-
ing assumptions: (i) The vertical and horizontal distribu-
tions of foliage area density are independent of each
other. (ii) The horizontal distribution of foliage area den-
sity is the same whatever the height in the crown.
For the horizontal profile, crown length was divided
into ten slices for the Bray site, three slices for the Lsite.
The lower and upper slices were omitted and the follow-
ing steps were made for each remaining slice. On each
slice, normalised distances (Xrel) were measured, with a
length unit equal to the length of the slice radius, so that
Xrel varied between 0 from the stem to 1 on the crown
periphery. Relative height (Htrel) was defined with 0 at
the bottom of the crown, 1 at the top of the crown. We
considered that a branch was equivalent to a circular arc,
of length L, chord C, inserted with angle α, at the height
H, (Fig. 1) and constituted of j= 1 to n internodes. The
co-ordinates (Xj, Yj) of both ends of each internode j
were calculated using the length measurements of the
internodes (Lj). The orthogonal projection of internode j
(length Lj) on the vertical axis was calculated as Ljy =
Yj+1– Yjand its orthogonal projection on the horizontal
axis as Ljx = Xj+1 – Xj. To each point (Xj, Yj) was associ-
ated a foliage area, LAj(needle age), equal to the sum of
the leaf area bear by the woody axes inserted on this
point (2nd to 4th order woody axes, needle age 1 to 3). It
was normalised to needle area density, NADj, using the
estimated crown (or layer) foliage area estimated with
the allometric branch models. Finally, the normalised
foliage area was assumed to be distributed uniformly
along the normalised projection Ljx or Ljy.
The vertical and horizontal foliage area profiles were
fitted to a three or four parameters beta function (a4 can
be fixed to one according to the shape of the distribution)
using the non-linear procedure of the SAS software
package (SAS 6.11, SAS Institute Inc., Cary, NC, 1989-
1995): it calculated the minimum residual sum of least-
square using the iterative method of Marquardt.
NAD = a1 . ya2 . (a4 – y) a3 (1)
where yis the normalised dimension of the crown, either
Htrel or Xrel.
3. RESULTS
For each stand age, three needle age cohorts were
found on every tree, exceptionally four year-old needles
remained on some branches of the two oldest stands. On
the 5 year-old stand (Lsite), three year-old needles rep-
resented less than 1% of the total sampled leaf area,
therefore they were ignored in the distribution study.
One year-old needles represented 60% of the total needle
area (table I). For the 21 and 26 year-old stands (Bray 90
and 95), one year-old needles formed a smaller propor-
tion of the total area, with 42 and 48% respectively,
whereas three year-old needles reached 22 and 8% of the
total area, for each stand, respectively. Distribution of
leaf area according to the woody axis order of ramifica-
tion (table I) showed the strong contribution of 3rd order
branches (54%) to total leaf area for the older stand,
whatever the needle age was. On the contrary, it showed
the importance of 1st and 2nd order axis for the 5 year-old
stand (16 + 38 = 54%).
3.1. Branch-level foliage area model
The highest linear correlation between branch foliage
and branch characteristics occurred with the product
variable D102×Htrel (R= 0.81 to 0.90) for the one year-
old needle of every stand, and for the two year-old nee-
dles of the two oldest stands. Squared D10 and relative
height into the crown were the recurrent explicative vari-
ables strongly related to branch foliage area (Fvalue cor-
responding to an error probability inferior to 0.001).
Some variables such as the length of the trunk growth
unit occasionally appeared as explicative variables of
branch foliage variability, but they demonstrated a low
significant effect and were highly specific of both the
needle and stand ages. The different models investigated
were either linear or non-linear relationships, with more
or less numerous variables and finally exhibited quasi-
equivalent fittings on the data (in terms of sum of
squares, residual mean squares, Fand R2values) and

Maritime pine foliage area 77
similar residuals graphs (data not shown). The choice of
the final model lay on the facts that it demonstrated high
significant Fvalues and equivalent residual mean
squares and residuals distributions when compared to the
others. The linear functions that were explored presented
indeed smaller residual mean squares than the final
model, but often produced negative values for small
diameter values. Therefore, linear models were not
appropriate since we aimed at using the final relationship
to estimate foliage area for diameters ranging 0 to 6 cm.
The final model matched also our requirements of (i)
being a simple and useful tool. It required only two vari-
ables, branch diameter and branch relative height in the
crown, which were non destructive measurements that
can be rapidly and easily obtained in any forest. It only
required three parameters which also facilitated its para-
meterisation compared to more complex models. (ii)
This model was still empirical but variables and parame-
ters had a biological significance: this point will be
developed in the discussion. The allometric model of
branch foliage retained corresponded to the following
equation:
BrLA(age i) = (a2.D102.Htrel + a3.D102)a1(2)
with BrLA(i) being branch leaf area of needle cohort of
age i(1 or 2 year-old) (table II). The final model residual
mean square ranged from 0.03 to 0.27 (m2)2, the best one
occurring for the two-year old needles area on the
youngest stand.
Figure 2 presents the branch foliage area calculated
using equation (2) versus the branch area data measured
on all three stands, for the one and two year-old needles.
For branch foliage area lower than 1 m2, variance on the
estimates was large comparatively to the estimated
value, whereas between 1 and 2.5–3 m2, the fittings were
very satisfying. Then at the upper end of the range (over
3 m2), the model resulted in slightly underestimating the
biggest branch area. The model was a little better for the
two year-old needles (figure 2, R2= 0.76). As a whole,
the models explained 71 and 76% of the branch needle
area variability. The use of one single branch model for
the three stands altogether (table II) gave as satisfying
fittings on the whole set than when using separate fit-
tings for each stand. But looking at each stand separate-
ly, it resulted in overestimating the needle area of the
younger stand branches and underestimating the branch
area of the older stand. Different fittings for each site
were then elected as the more adapted models (table II).
No clear tendency in the parameters (a1, a2, a3) could
be driven out of the study. Parameter a3 tended to
increase with stand age whereas parameter a2 tended to
decrease regularly for both needle ages. Parameter a1
tended to increase with stand age for the younger needles
and no tendency appeared for the two year-old needles.
Neither of these differences between site was significant.
Table I. Distribution of the measured foliage area according to the order of the bearing axis (1 = trunk, 2 = branch, 3 = branch on the
branch etc.) and to needle age, in percent of the total measured area. Specific leaf area values (SLA, m2kg–1) per needle age. Values
in parenthesis are standard deviations of the mean values. Values with the same letter are not significantly different (α= 0.05).
Needle age
Stand Order 3 year-old 2 year-old 1 year-old all
Foliage area 5 year-old stand 1 0.45 5.45 10.00 15.90
(%) (L) 2 0.22 13.52 23.88 37.62
3 0.25 17.44 25.75 43.44
4 0 1.88 1.15 3.03
all 0.92 38.30 60.78 –
21 year-old stand all 21.51 36.68 41.81 –
(Bray 90)
26 year-old stand 1 0.21 2.38 2.69 5.27
(Bray 95) 2 1.73 12.31 14.34 28.39
3 5.48 23.35 25.56 54.39
4 0.81 5.56 5.58 11.95
all 8.23 43.60 48.17 –
SLA 5 year-old stand – – 9.11 b8.68 b–
(1.58) (1.48)
(m2kg-1) 26 year-old stand – 6.57 a6.82 a7.69 a–
(0.81) (1.33) (1.55) –


%20--%3e%3cdefs%3e%3cstyle%3e%20.st0%20{%20fill:%20%23fff;%20}%20.st1%20{%20fill:%20%237800fa;%20}%20%3c/style%3e%3c/defs%3e%3cpath%20class='st1'%20d='M117.78,12.18H43.11c2.9,3.47,4.65,7.94,4.65,12.82,0,5.6-2.3,10.66-6.01,14.29h76.02l7.22-13.56-7.22-13.56Z'/%3e%3cg%3e%3cpath%20class='st0'%20d='M53.58,26.17h-.59v-1.46h.59v-4.96h2.83c1.78,0,2.67.94,2.67,2.82v5.76c0,1.87-.89,2.81-2.67,2.81h-2.83v-4.96ZM55.36,21.37v3.34h1.1v1.46h-1.1v3.34h1.01c.61,0,.91-.37.91-1.1v-5.93c0-.74-.3-1.1-.91-1.1h-1.01Z'/%3e%3cpath%20class='st0'%20d='M65.99,31.14h-1.8l-.31-2.07h-2.19l-.31,2.07h-1.64l1.82-11.39h2.62l1.82,11.39ZM65.28,18.04c-.25.46-.51.77-.75.94-.21.15-.47.22-.79.22-.26,0-.57-.07-.92-.22l-.38-.15c-.14-.05-.26-.07-.37-.07-.3,0-.53.18-.71.54l-.91-.68c.25-.46.51-.77.75-.94.21-.14.48-.21.79-.21.26,0,.57.07.92.21l.38.15c.14.05.26.07.37.07.3,0,.53-.18.71-.54l.91.68ZM61.91,27.52h1.73l-.87-5.76-.87,5.76Z'/%3e%3cpath%20class='st0'%20d='M74.53,26.89v1.52c0,1.91-.89,2.86-2.67,2.86s-2.67-.95-2.67-2.86v-5.93c0-1.91.89-2.86,2.67-2.86s2.67.95,2.67,2.86v1.11h-1.69v-1.22c0-.75-.31-1.12-.93-1.12s-.93.37-.93,1.12v6.15c0,.74.31,1.11.93,1.11s.93-.37.93-1.11v-1.63h1.69Z'/%3e%3cpath%20class='st0'%20d='M81.4,31.14h-1.8l-.31-2.07h-2.19l-.31,2.07h-1.64l1.82-11.39h2.62l1.82,11.39ZM75.9,19.2l1.52-1.91h1.71l1.51,1.91h-1.61l-.76-.95-.75.95h-1.61ZM77.32,27.52h1.73l-.87-5.76-.87,5.76ZM83.1,15.99l-1.76,1.91h-1.26l1.17-1.91h1.86Z'/%3e%3cpath%20class='st0'%20d='M84.86,19.75c1.78,0,2.67.94,2.67,2.82v1.48c0,1.87-.89,2.81-2.67,2.81h-.85v4.28h-1.79v-11.39h2.64ZM84.01,21.37v3.86h.85c.58,0,.87-.36.87-1.08v-1.71c0-.71-.29-1.07-.87-1.07h-.85Z'/%3e%3cpath%20class='st0'%20d='M93.51,19.75c1.78,0,2.67.94,2.67,2.82v1.48c0,1.87-.89,2.81-2.67,2.81h-.85v4.28h-1.79v-11.39h2.64ZM92.66,21.37v3.86h.85c.58,0,.87-.36.87-1.08v-1.71c0-.71-.29-1.07-.87-1.07h-.85Z'/%3e%3cpath%20class='st0'%20d='M98.8,31.14h-1.79v-11.39h1.79v4.88h2.03v-4.88h1.83v11.39h-1.83v-4.88h-2.03v4.88Z'/%3e%3cpath%20class='st0'%20d='M105.36,24.55h2.46v1.62h-2.46v3.34h3.09v1.63h-4.88v-11.39h4.88v1.63h-3.09v3.18ZM108.17,17.29l-1.76,1.91h-1.26l1.17-1.91h1.86Z'/%3e%3cpath%20class='st0'%20d='M112.2,19.75c1.78,0,2.67.94,2.67,2.82v1.48c0,1.87-.89,2.81-2.67,2.81h-.85v4.28h-1.79v-11.39h2.64ZM111.35,21.37v3.86h.85c.58,0,.87-.36.87-1.08v-1.71c0-.71-.29-1.07-.87-1.07h-.85Z'/%3e%3c/g%3e%3ccircle%20class='st1'%20cx='25'%20cy='25'%20r='20'/%3e%3cpath%20class='st0'%20d='M32.78,19.27c2.92,0,4.43,2.55,5.28,5.33l.71,2.17c.14.38-.33.75-.71.75h-5.61c.19-.33.24-.71.09-1.08l-.75-2.45c-.43-1.32-.99-2.64-1.79-3.77.75-.57,1.65-.94,2.78-.94h0ZM25,18.38c3.25,0,4.9,2.78,5.89,5.89l.76,2.45c.14.42-.33.8-.8.8h-11.69c-.42,0-.94-.38-.8-.8l.75-2.45c.99-3.11,2.64-5.89,5.89-5.89h0ZM25,11.35c1.74,0,3.11,1.37,3.11,3.11s-1.37,3.11-3.11,3.11-3.11-1.41-3.11-3.11,1.41-3.11,3.11-3.11h0ZM17.27,19.27c1.08,0,1.98.38,2.73.94-.8,1.13-1.37,2.45-1.74,3.77l-.8,2.45c-.14.38-.05.75.09,1.08h-5.56c-.42,0-.9-.38-.75-.75l.71-2.17c.9-2.78,2.41-5.33,5.33-5.33h0ZM17.27,12.91c1.51,0,2.78,1.27,2.78,2.83s-1.27,2.83-2.78,2.83-2.83-1.27-2.83-2.83,1.27-2.83,2.83-2.83h0ZM32.78,12.91c1.56,0,2.78,1.27,2.78,2.83s-1.23,2.83-2.78,2.83-2.83-1.27-2.83-2.83,1.27-2.83,2.83-2.83h0ZM27.07,28.56v.09c0,.57-.24,1.08-.61,1.46h0v.05c-.38.33-.9.57-1.46.57s-1.08-.24-1.46-.61h0c-.38-.38-.61-.9-.61-1.46v-.09h1.41v.09c0,.19.05.38.19.47v.05c.09.09.28.19.47.19s.38-.09.47-.19v-.05c.14-.09.24-.28.24-.47t-.05-.09h1.41ZM30.99,28.56v.09c0,1.65-.66,3.16-1.74,4.24-1.08,1.08-2.59,1.79-4.24,1.79s-3.16-.71-4.24-1.79l-.05-.05c-1.04-1.08-1.7-2.55-1.7-4.2v-.09h1.41v.09c0,1.27.47,2.4,1.27,3.25h.05c.85.85,1.98,1.37,3.25,1.37s2.4-.52,3.25-1.37c.85-.8,1.37-1.98,1.37-3.25v-.09h1.37ZM34.99,28.56v.09c0,2.78-1.13,5.28-2.92,7.07-1.79,1.79-4.29,2.92-7.07,2.92s-5.23-1.13-7.07-2.92c-1.79-1.79-2.92-4.29-2.92-7.07v-.09h1.41v.09c0,2.4.94,4.53,2.5,6.08,1.56,1.56,3.72,2.5,6.08,2.5s4.52-.94,6.08-2.5c1.56-1.56,2.5-3.68,2.5-6.08v-.09h1.41Z'/%3e%3c/svg%3e)