Review
article
Gene
diversity
in
natural
populations
of
oak
species
A
Kremer
RJ
Petit
INRA,
laboratoire
de
génétique
et
d’amélioration
des
arbres
forestiers,
BP 45, 33610
Gazinet,
Cestas,
France
Summary —
This
contribution
reviews
studies
of
nuclear
and
organelle
gene
diversity
in
oak
spe-
cies.
Studies
of
allozymes
were
reported
for
33
species
belonging
to
the
sections
Erythrobalanus,
Lepidobalanus
and
Mesobalanus
of
the
genus
Quercus.
The
extent
and
organization
of
gene
diver-
sity
were
investigated
at
3
hierarchical
levels:
complex,
species
and
population.
Total
diversity
at
the
species
and
population
level
varies
greatly
among
species
(from
0.06
to
0.40).
The
range
of
varia-
tion
among
species
is
as
large
as
that
observed
in
other
plant
genera.
Life
history
characteristics
and
evolutionary
history
are
the
main
explanations
for
these
results.
Species
with
large
and
conti-
nuous
distributions
such
as
Q
petraea
and
Q
rubra
exhibit
high
levels
of
gene
diversity.
Within
a
complex,
most
of
the
nuclear
gene
diversity
is
distributed
within
populations
(74%).
The
remaining
diversity
is
mainly
due
to
species
differentiation
(23%),
while
the
between-population
component
is
low
(3%).
Organelle
gene
diversity
has
been
investigated
recently
in
2
species
complexes
in
the
sec-
tion
Lepidobalanus
(one
in
North
America
and
one
in
Europe).
Compared
to
nuclear
genes,
orga-
nelle
gene
diversity
is
strikingly
different.
Contributions
of
within-stand
variation,
species
differentia-
tion
and
population
differentiation
to
total
diversity,
are
respectively
13%,
11 %
and
76%.
Trees
of
a
given
population
generally
share
the
same
chloroplast
genome.
Moreover,
trees
of
different
species
(with
reported
introgression)
occupying
the
same
stand
exhibit
a
high
degree
of
similarity.
Quercus
/ nuclear
gene
diversity
/
organelle
gene
diversity
/
gene
differentiation
Résumé —
Diversité
génétique
dans
les
populations
de
chênes.
Cette
contribution
présente
une
synthèse
des
résultats
obtenus
sur
la
diversité
génétique
nucléaire
et
cytoplasmique
chez
les
chênes.
À
l’heure
actuelle,
des
données
existent
sur
33
espèces
appartenant
aux
sections
Erythro-
balanus,
Lepidobalanus
et
Mesobalanus
du
genre
Quercus.
Les
analyses
ont porté
sur
l’estimation
du
niveau
de
diversité
et
sur
la
répartition
de
la
diversité
entre
les
3
niveaux :
complexe,
espèce
et
population.
La
diversité
totale
au
niveau
espèce
et
population
montre
une
variation
importante
(entre
0,06
et
0,40).
L’amplitude
de
variation
entre
espèces
est
aussi
importante
que
celle
observée
dans
d’autres
genres.
Les
caractéristiques
biologiques
des
espèces
ainsi
que
leur
histoire
évolutive
per-
mettent
d’interpréter
ces
résultats.
Les
espèces
à
large
aire
de
distribution,
telles
que
Q
petraea
et
Q
robur
manifestent
des
niveaux
élevés
de
diversité.
Au
niveau
d’un
complexe
d’espèces,
la
majeure
partie
de
la
diversité
réside
à
l’intérieur
des
populations
(74%);
la
différenciation
entre
espèces
à
l’intérieur
du
complexe
représente
23%,
alors
que
la
différenciation
entre
populations
à
l’intérieur
d’une
espèce
ne
représente
plus
que
3%
de
la
diversité
totale.
La
diversité
génétique
cytoplasmique
a
été
étudiée
récemment
dans
2
complexes
de chênes
blancs
de
la
section
Lepidobalanus
(le
pre-
mier
situé
en
Amérique
du
Nord,
le
second
en
Europe).
Les
résultats
sont
très
différents
de
ceux
ob-
tenus
au
niveau
nucléaire.
Les
contributions
de
la
différenciation
entre
arbres
(à
l’intérieur
des
popu-
lations),
entre
populations
(à
l’intérieur
des
espèces)
et
entre
espèces
sont
respectivement
de
13,
11
et
76%.
Les
arbres
d’une
même
population
partagent
généralement
le
même
génome
cytoplasmique.
Par
ailleurs,
les
espèces
proches,
échangeant
des
gènes
et
occupant
les
mêmes
peuplements,
mani-
festent
une
similarité
génétique
élevée.
Quercus
/
diversité
génétique
nucléaire
/
diversité
génétique
cytoplasmique
/
différenciation
génétique
INTRODUCTION
The
genus
Quercus
comprises
more
than
300
species
spread
over
Asia,
North
America
and
Europe
(Camus,
1934-
1954).
On
each
continent,
oak
species
are
sympatric
over
large
areas
in
which
exten-
sive
gene
flow
among
related
species
has
been
reported.
Although
morphological
and
ecological
boundaries
of
species
are
usually
well
recognized,
natural
hybridiza-
tion
has
been
described
in
many
combina-
tions
based
on
morphological
evidence.
This
suggests
that
oaks
are
multispecies
or
large
sets
of
broadly
sympatric
species
exchanging
genes
(Van
Valen,
1976).
Since
introgression
represents
a
poten-
tially
important
source
of
genetic
variation
in
natural
populations,
the
multispecies
level
has
to
be
considered
in
evaluating
levels
and
organization
of
gene
diversity.
Questions
related
to
the
multispecies
concept
are:
does
interfertility
between
species
provide
higher
levels
of
gene
di-
versity
than
within
species
which
do
not
normally
experience
introgression?
How
is
diversity
distributed
among
species
and
among
populations
within
species?
We
ad-
dress these
questions
by
reviewing
the
scarce
literature
on
gene
diversity
in
oak
species
both
at
the
nuclear
and
organelle
levels.
In
recent
years,
allozymes
have
been
used
to
document
nuclear
variation
in
oaks,
while
restriction-site
data
on
chloro-
plast
DNA
(cpDNA)
have
provided
a
preliminary
insight
into
organelle
poly-
morphisms.
Because
chloroplasts
are
ma-
ternally
and
clonally
inherited,
whereas
nu-
clear
genes
undergo
recombination
and
are
biparentally
inherited,
the
comparison
of
the
organization
of
gene
diversity
in
these
different
genomes
is
of
particular
in-
terest
and
will
be
stressed
in
this
review.
MATERIALS
AND
METHODS
Nuclear
gene
diversity
Reported
studies
and
sampling
strategies
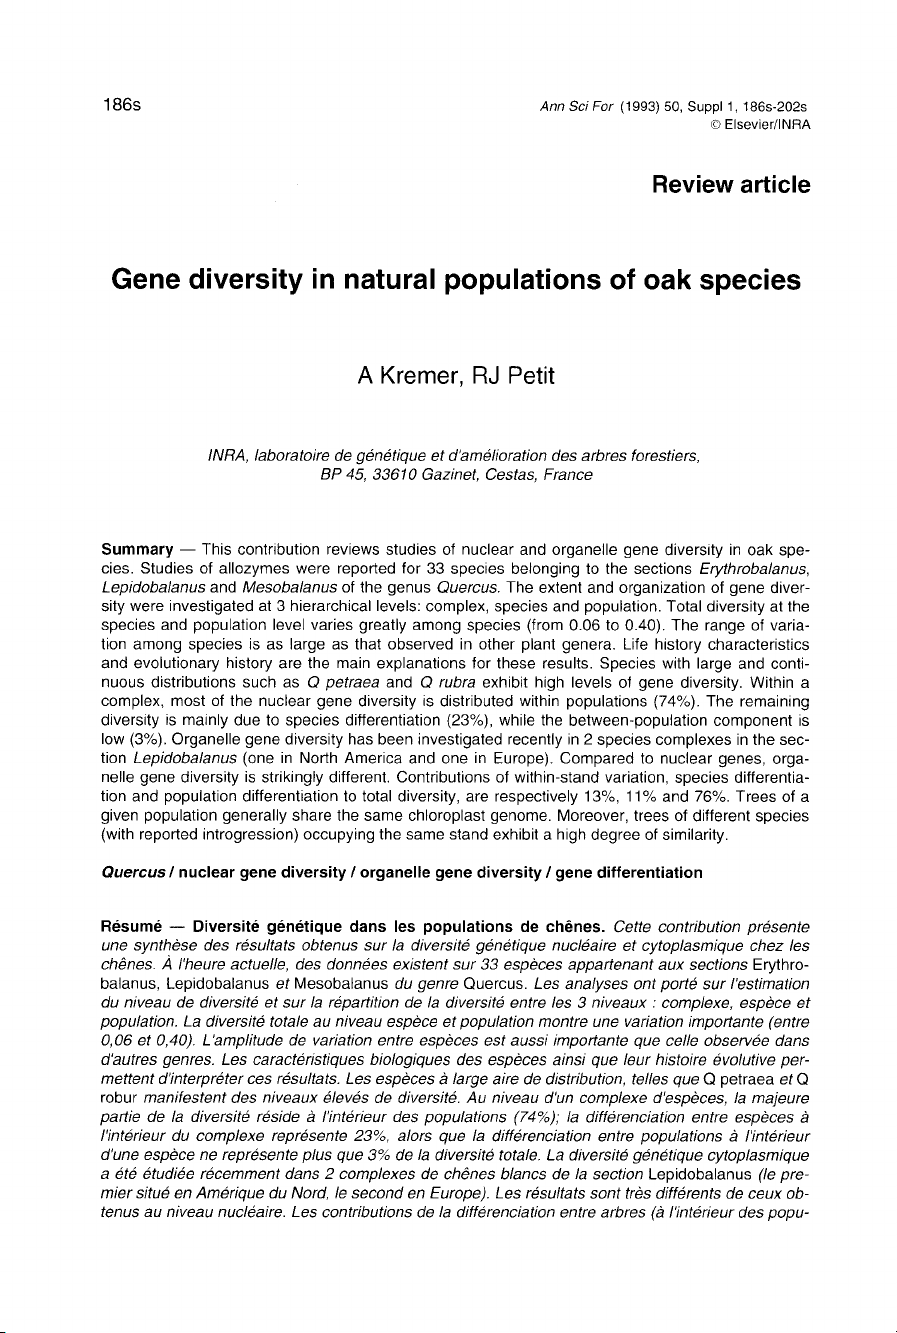
Table
I presents
a
general
survey
of
gene
diver-
sity
studies
conducted
so
far
on
oak
species,
with
particular
emphasis
on
sampling
schemes.
Species
are
classified
according
to
Camus’s
tax-
onomy
(Camus,
1934-1954).
Data
are
available
on
33
species
and
originate
from
13
references.
These
species
belong
mainly
to
sections
Lepido-
balanus
(white
oaks)
and
Erythrobalanus
(red
oaks)
and
are
distributed
over
North
America,
Europe
and
Asia.
No
data
are
available
on
spe-
cies
belonging
to
sections
Macrobalanus and
Protobalanus.
Sampling
schemes
are
extremely
variable
and
in
some
cases
restricted
to
a
few
loci
or
populations.
Among
the
33
species
only
8
assessed
had
more
than
13
loci
and
4
popula-
tions.
For
a
few
economically
important
species
(Q
petraea,
Q
alba,
Q
rubra,
Q
macrocarpa),
in-
vestigations
were
conducted
independently
by
different
institutes,
leading
in
some
cases
to
substantial
differences
in
the
results.
Therefore,
species
comparisons
will
only
be
made
when
the
same
techniques
were
applied.
Because
oak
stands
are
often
composed
of
several
interfertile
species,
gene
diversity
in
nat-
ural
populations
should
be
analyzed
at
different
hierarchical
levels:
complexes
of
species,
spe-
cies
within
complexes
and
populations
within
species.
To
evaluate
gene
diversity
parame-
ters,
species
were
considered
to
form
a
com-
plex
when:
1)
they
belonged
to
the
same
bo-
tanical
section,
2)
their
natural
ranges
were
largely
overlapping
and
3)
natural
hybridization
was
indicated
in
the
literature
in
all
pairwise
combinations.
In
defining
a
complex,
we
added
an
additional
constraint -
that
the
gene
fre-
quencies
be
obtained
with
the
same
tech-
niques
for
all
species
forming
the
complex.
Among
the
different
species
listed
in
table
1,
4
complexes
can
be
identified
using
the
criteria
reported
above.
Q
rubra
complex
Two
different
studies
(Manos
and
Fairbrothers,
1987;
Guttman
and
Weight,
1989)
have
provid-
ed
data
on
6
and
10
species
of
red
oaks,
re-
spectively.
According
to
the
aforementioned
cri-
teria
and
the
Quercus
rubra
syngameon
(Jensen,
1993),
species
were
clustered
in
2
complexes
(4
species
each):
complex
1,
com-
prised
of
Q
rubra,
Q
coccinea,
Q
ilicifolia
and
Q
velutina
(Manos
and
Fairbrothers,
1987);
and
complex
2,
comprised
of
Q
rubra,
Q
marilandi-
ca,
Q
phellos
and
Q
velutina
(Guttman
and
Weight,
1989).
Q
alba
complex
This
contains
species
studied
by
Guttman
and
Weight
(1989)
clustered
in
a
complex
according
to
the
Q
alba
syngameon
described
by
Hardin
(1975):
Q
alba,
Q
bicolor,
Q
lyrata,
Q
macrocar-
pa
and
Q
stellata.
Q
douglasii
complex
Two
white
oaks
(Q
douglasii
and
Q
lobata)
were
selected
among
the
3
species
studied
by
Millar
et al (1992).
They
are
sympatric
over
their
entire
distribution
in
California.
Natural
hybridization
has
been
reported
by
Tucker
(1990).
Q
robur
complex
Q
petraea
and
Q
robur
species
are
sympatric
over
most
of
Europe
and
their
introgression
has
been
extensively
documented
(Rushton,
1979;
letswaart
and
Feij,
1989).
The
data
analyzed
here
originated
from
Müller-Starck
et al
(1992).
Estimation
of
gene
diversity
parameters
Gene
diversity
was
investigated
at
3
hierarchical
levels
(complex,
species
and
population)
by
computing
the
following
genetic
parameters
for
each
locus
separately
(Hamrick
and
Godt,
1990):
1)
mean
number
of alleles
(A):
number
of
alleles
observed
at
a
given
hierarchical
level
(ie,
species
or
populations);
2)
genetic
diversity
(He);
3)
effective
number
of
alleles
(A
e;
Ae
=
1/
(1-H
e
)).
Additional
subscripts
indicate
the
level
at
which
these
parameters
were
calculated;
for
ex-
ample
Ac,
As
and
Ap
are,
respectively,
the
mean
number
of
alleles
at
the
complex,
species
and
population
levels.
Genetic
diversity
was
calculat-
ed
at
each
different
level
by:
He
=
1
-
Σ
p2i;
where
pi
is
the
mean
frequency
of
allele
i
over
all
units
of
the
next
lowest
hierarchical
level.
Val-
ues
of
the
genetic
parameters
were
averaged
over
all
loci
analyzed.
The
structure
of
gene
diversity
was
analyzed
using
Nei’s
genetic
diversity
statistics
(1973,
1977)
in
which
the
total
diversity
in
a
complex
(H
T)
was
partitioned
into
3
components:
HT
=
HS
+
D
SG
+
D
GT
;
where
HS
is
the
diversity
within
populations
within
species,
D
SG
is
the
compo-
nent
of
diversity
due
to
subdivision
into
popula-
tions
within
species,
and
D
GT
is
the
component
of
diversity
due
to
subdivision
into
species
(with-
in
the
complex).
These
components
were
further
calculated
as
ratios
of
total
diversity
(Chakraborty
and
Lei-
mar,
1988;
Kremer
et al,
1991),
which
is
differ-
ent
from
the
notation
of
Nei
(1973):
GS
+
G
SG
+
G
GT
=
1
and
GS
=
HS
/H
T,
the
coefficient
of
gene
differentiation
among
individuals
within
popula-
tions;
G
SG
=
D
SG/H
T,
the
coefficient
of
gene
dif-
ferentiation
among
populations
within
species;
and
G
GT
=
D
GT/H
T,
the
coefficient
of
gene
differ-
entiation
among
species
within
a
complex.
The
proportion
of
gene
diversity
residing
among
pop-
ulations
irrespective
of
species
is:
G
ST
=
G
SG
+
G
GT
.
Due
to
the
extremely
different
sampling
schemes
used
(table
I),
genetic
parameters
were
not
systematically
calculated
for
every
study.
For
documentation
purposes,
we
report
all
the
results
on
a
species
level,
but
restrict
the
analysis
of
organization
of
gene
diversity
to
the
cases
where
more
than
13
loci
were
investigat-
ed.
Because
authors
used
different
genetic
pa-
rameters
or
estimation
methods,
most
of
the pa-
rameters
were
recalculated
when
allele
frequen-
cies
were
available.
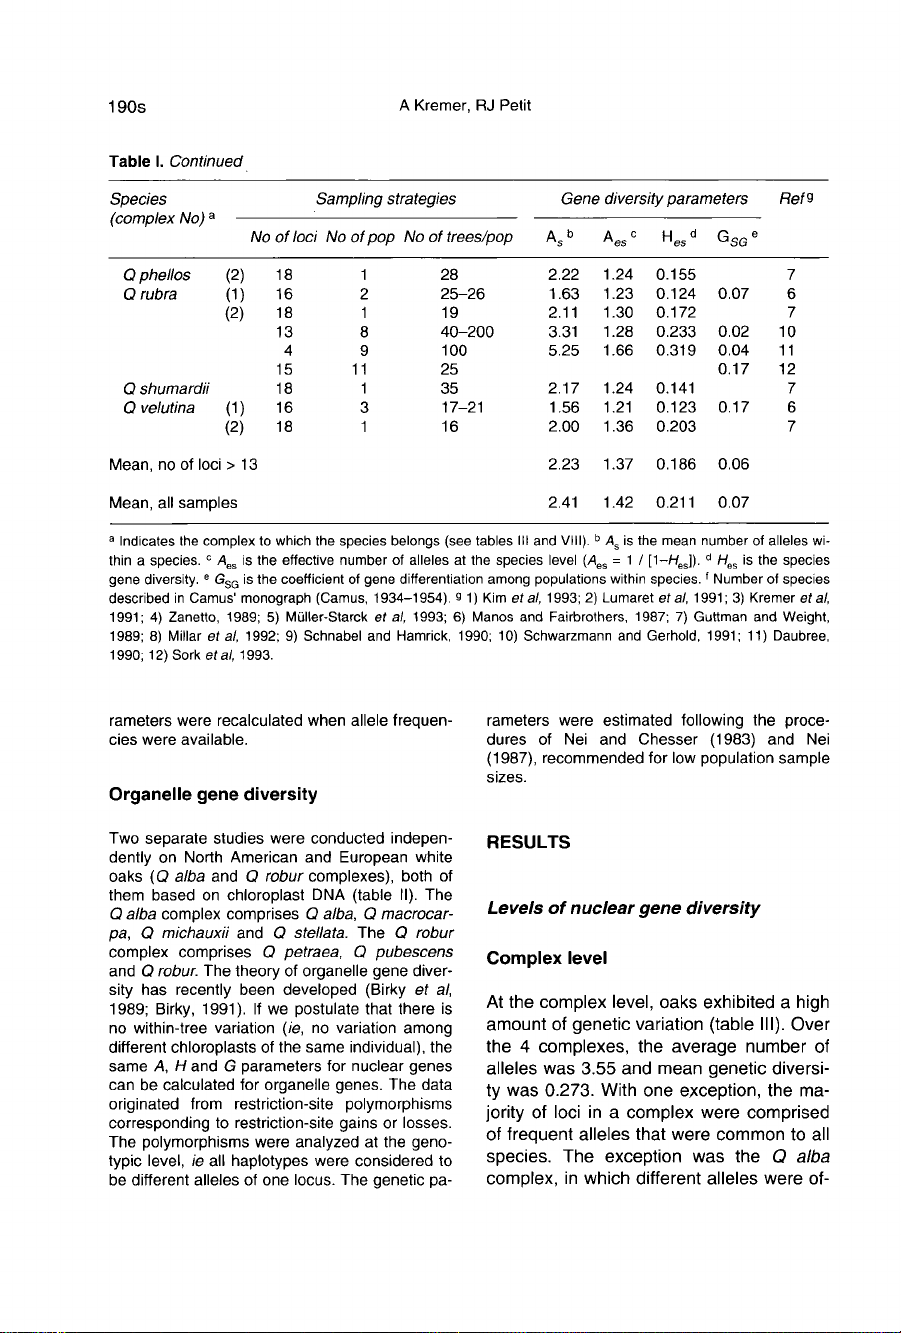
Organelle
gene
diversity
Two
separate
studies
were
conducted
indepen-
dently
on
North
American
and
European
white
oaks
(Q
alba
and
Q
robur
complexes),
both
of
them
based
on
chloroplast
DNA
(table
II).
The
Q
alba
complex
comprises
Q
alba,
Q
macrocar-
pa,
Q
michauxii
and
Q
stellata.
The
Q
robur
complex
comprises
Q
petraea,
Q
pubescens
and
Q
robur.
The
theory
of
organelle
gene
diver-
sity
has
recently
been
developed
(Birky
et
al,
1989;
Birky,
1991).
If
we
postulate
that
there
is
no
within-tree
variation
(ie,
no
variation
among
different
chloroplasts
of
the
same
individual),
the
same
A,
H and
G
parameters
for
nuclear
genes
can
be
calculated
for
organelle
genes.
The
data
originated
from
restriction-site
polymorphisms
corresponding
to
restriction-site
gains
or
losses.
The
polymorphisms
were
analyzed
at
the
geno-
typic
level,
ie
all
haplotypes
were
considered
to
be
different
alleles
of
one
locus.
The
genetic
pa-
rameters
were
estimated
following
the
proce-
dures
of
Nei
and
Chesser
(1983)
and
Nei
(1987),
recommended
for
low
population
sample
sizes.
RESULTS
Levels
of
nuclear
gene
diversity
Complex
level
At
the
complex
level,
oaks
exhibited
a
high
amount
of
genetic
variation
(table
III).
Over
the
4
complexes,
the
average
number
of
alleles
was
3.55
and
mean
genetic
diversi-
ty
was
0.273.
With
one
exception,
the
ma-
jority
of
loci
in
a
complex
were
comprised
of
frequent
alleles
that
were
common
to
all
species.
The
exception
was
the
Q
alba
complex,
in
which
different
alleles
were
of-


%20--%3e%3cdefs%3e%3cstyle%3e%20.st0%20{%20fill:%20%23fff;%20}%20.st1%20{%20fill:%20%237800fa;%20}%20%3c/style%3e%3c/defs%3e%3cpath%20class='st1'%20d='M117.78,12.18H43.11c2.9,3.47,4.65,7.94,4.65,12.82,0,5.6-2.3,10.66-6.01,14.29h76.02l7.22-13.56-7.22-13.56Z'/%3e%3cg%3e%3cpath%20class='st0'%20d='M53.58,26.17h-.59v-1.46h.59v-4.96h2.83c1.78,0,2.67.94,2.67,2.82v5.76c0,1.87-.89,2.81-2.67,2.81h-2.83v-4.96ZM55.36,21.37v3.34h1.1v1.46h-1.1v3.34h1.01c.61,0,.91-.37.91-1.1v-5.93c0-.74-.3-1.1-.91-1.1h-1.01Z'/%3e%3cpath%20class='st0'%20d='M65.99,31.14h-1.8l-.31-2.07h-2.19l-.31,2.07h-1.64l1.82-11.39h2.62l1.82,11.39ZM65.28,18.04c-.25.46-.51.77-.75.94-.21.15-.47.22-.79.22-.26,0-.57-.07-.92-.22l-.38-.15c-.14-.05-.26-.07-.37-.07-.3,0-.53.18-.71.54l-.91-.68c.25-.46.51-.77.75-.94.21-.14.48-.21.79-.21.26,0,.57.07.92.21l.38.15c.14.05.26.07.37.07.3,0,.53-.18.71-.54l.91.68ZM61.91,27.52h1.73l-.87-5.76-.87,5.76Z'/%3e%3cpath%20class='st0'%20d='M74.53,26.89v1.52c0,1.91-.89,2.86-2.67,2.86s-2.67-.95-2.67-2.86v-5.93c0-1.91.89-2.86,2.67-2.86s2.67.95,2.67,2.86v1.11h-1.69v-1.22c0-.75-.31-1.12-.93-1.12s-.93.37-.93,1.12v6.15c0,.74.31,1.11.93,1.11s.93-.37.93-1.11v-1.63h1.69Z'/%3e%3cpath%20class='st0'%20d='M81.4,31.14h-1.8l-.31-2.07h-2.19l-.31,2.07h-1.64l1.82-11.39h2.62l1.82,11.39ZM75.9,19.2l1.52-1.91h1.71l1.51,1.91h-1.61l-.76-.95-.75.95h-1.61ZM77.32,27.52h1.73l-.87-5.76-.87,5.76ZM83.1,15.99l-1.76,1.91h-1.26l1.17-1.91h1.86Z'/%3e%3cpath%20class='st0'%20d='M84.86,19.75c1.78,0,2.67.94,2.67,2.82v1.48c0,1.87-.89,2.81-2.67,2.81h-.85v4.28h-1.79v-11.39h2.64ZM84.01,21.37v3.86h.85c.58,0,.87-.36.87-1.08v-1.71c0-.71-.29-1.07-.87-1.07h-.85Z'/%3e%3cpath%20class='st0'%20d='M93.51,19.75c1.78,0,2.67.94,2.67,2.82v1.48c0,1.87-.89,2.81-2.67,2.81h-.85v4.28h-1.79v-11.39h2.64ZM92.66,21.37v3.86h.85c.58,0,.87-.36.87-1.08v-1.71c0-.71-.29-1.07-.87-1.07h-.85Z'/%3e%3cpath%20class='st0'%20d='M98.8,31.14h-1.79v-11.39h1.79v4.88h2.03v-4.88h1.83v11.39h-1.83v-4.88h-2.03v4.88Z'/%3e%3cpath%20class='st0'%20d='M105.36,24.55h2.46v1.62h-2.46v3.34h3.09v1.63h-4.88v-11.39h4.88v1.63h-3.09v3.18ZM108.17,17.29l-1.76,1.91h-1.26l1.17-1.91h1.86Z'/%3e%3cpath%20class='st0'%20d='M112.2,19.75c1.78,0,2.67.94,2.67,2.82v1.48c0,1.87-.89,2.81-2.67,2.81h-.85v4.28h-1.79v-11.39h2.64ZM111.35,21.37v3.86h.85c.58,0,.87-.36.87-1.08v-1.71c0-.71-.29-1.07-.87-1.07h-.85Z'/%3e%3c/g%3e%3ccircle%20class='st1'%20cx='25'%20cy='25'%20r='20'/%3e%3cpath%20class='st0'%20d='M32.78,19.27c2.92,0,4.43,2.55,5.28,5.33l.71,2.17c.14.38-.33.75-.71.75h-5.61c.19-.33.24-.71.09-1.08l-.75-2.45c-.43-1.32-.99-2.64-1.79-3.77.75-.57,1.65-.94,2.78-.94h0ZM25,18.38c3.25,0,4.9,2.78,5.89,5.89l.76,2.45c.14.42-.33.8-.8.8h-11.69c-.42,0-.94-.38-.8-.8l.75-2.45c.99-3.11,2.64-5.89,5.89-5.89h0ZM25,11.35c1.74,0,3.11,1.37,3.11,3.11s-1.37,3.11-3.11,3.11-3.11-1.41-3.11-3.11,1.41-3.11,3.11-3.11h0ZM17.27,19.27c1.08,0,1.98.38,2.73.94-.8,1.13-1.37,2.45-1.74,3.77l-.8,2.45c-.14.38-.05.75.09,1.08h-5.56c-.42,0-.9-.38-.75-.75l.71-2.17c.9-2.78,2.41-5.33,5.33-5.33h0ZM17.27,12.91c1.51,0,2.78,1.27,2.78,2.83s-1.27,2.83-2.78,2.83-2.83-1.27-2.83-2.83,1.27-2.83,2.83-2.83h0ZM32.78,12.91c1.56,0,2.78,1.27,2.78,2.83s-1.23,2.83-2.78,2.83-2.83-1.27-2.83-2.83,1.27-2.83,2.83-2.83h0ZM27.07,28.56v.09c0,.57-.24,1.08-.61,1.46h0v.05c-.38.33-.9.57-1.46.57s-1.08-.24-1.46-.61h0c-.38-.38-.61-.9-.61-1.46v-.09h1.41v.09c0,.19.05.38.19.47v.05c.09.09.28.19.47.19s.38-.09.47-.19v-.05c.14-.09.24-.28.24-.47t-.05-.09h1.41ZM30.99,28.56v.09c0,1.65-.66,3.16-1.74,4.24-1.08,1.08-2.59,1.79-4.24,1.79s-3.16-.71-4.24-1.79l-.05-.05c-1.04-1.08-1.7-2.55-1.7-4.2v-.09h1.41v.09c0,1.27.47,2.4,1.27,3.25h.05c.85.85,1.98,1.37,3.25,1.37s2.4-.52,3.25-1.37c.85-.8,1.37-1.98,1.37-3.25v-.09h1.37ZM34.99,28.56v.09c0,2.78-1.13,5.28-2.92,7.07-1.79,1.79-4.29,2.92-7.07,2.92s-5.23-1.13-7.07-2.92c-1.79-1.79-2.92-4.29-2.92-7.07v-.09h1.41v.09c0,2.4.94,4.53,2.5,6.08,1.56,1.56,3.72,2.5,6.08,2.5s4.52-.94,6.08-2.5c1.56-1.56,2.5-3.68,2.5-6.08v-.09h1.41Z'/%3e%3c/svg%3e)