Direct identification of hydrophobins and their processing in Trichoderma using intact-cell MALDI-TOF MS Torsten Neuhof1, Ralf Dieckmann1,*, Irina S. Druzhinina2, Christian P. Kubicek2, Tiina Nakari-Seta¨ la¨ 3, Merja Penttila¨ 3 and Hans von Do¨ hren1
1 TU Berlin, Institut fu¨ r Chemie, FG Biochemie und Molekulare Biologie, Berlin, Germany 2 FB Gentechnik und Angewandte Biochemie, Institut fu¨ r Verfahrenstechnik, Umwelttechnik und Technische Biowissenschaften, TU Wien, Vienna, Austria 3 VTT Technical Research Centre of Finland, Espoo, Finland
Keywords fungal biomarker; hydrophobin; intact-cell MS; MALDI-TOF MS; Trichoderma
Correspondence H. von Do¨ hren, TU Berlin, Institut fu¨ r Chemie, FG Biochemie und Molekulare Biologie, Franklinstr. 29, 10587 Berlin, Germany Fax: +49 30 314 24783 Tel: +49 30 314 22697 E-mail: Doehren@chem.tu-berlin.de
Intact-cell MS (ICMS) was applied for the direct detection of hydropho- bins in various species and strains of Hypocrea ⁄ Trichoderma. In both myce- lia and spores, dominating peaks were identified as hydrophobins by detecting mass shifts of 8 Da of reduced and unreduced forms, the analysis of knockout mutants, and comparison with protein databases. Strain-speci- fic processing was observed in the case of Hypocrea jecorina (anamorph Trichoderma reesei). An analysis of 32 strains comprising 29 different spe- cies of Trichoderma and Hypocrea showed hydrophobin patterns that were specific at both at the species and isolate (subspecies) levels. The method therefore permits rapid and direct detection of hydrophobin class II com- positions and may also provide a means to identify Trichoderma (and other fungal) species and strains from microgram amounts of biomass without prior cultivation.
*Present address AnagnosTec, Gesellschaft fu¨ r Analytische Biochemie und Diagnostik mbH, Potsdam- Golm, Germany
(Received 19 September 2006, revised 27 November 2006, accepted 6 December 2006)
doi:10.1111/j.1742-4658.2007.05636.x
Hydrophobins are small proteins thought to be ubi- quitous in filamentous fungi. They are usually present on the outer surfaces of cell walls of hyphae and coni- dia. Here, they mediate interactions between the fun- gus and the environment, such as surface recognition during pathogenic interactions with plants, insects or other fungi, and also in symbiosis. The size of hydro- phobins ranges from approximately 75 to 400 amino acid residues; they contain eight positionally conserved cysteine residues, and can be divided into two classes according to their hydropathy profiles and spacing between the conserved cysteines [1].
The anamorphic fungal genus Trichoderma (Hypocre- ales, Ascomycota) contains cosmopolitan soil-borne fungi with economic importance as biocontrol agents and producers of beneficial metabolites and enzymes. In addition, Trichoderma spp. have recently been reported to occur as endophytes, eliciting positive plant responses against potential pathogens [2]. Hydrophobins are likely to play a role in this process, and a hydrophobin gene has in fact recently been isolated that leads to overpro- duction of hydrophobins during endophytic interactions between Trichoderma asperellum and cucumber roots [3]. However, hydrophobins may also be involved in the
FEBS Journal 274 (2007) 841–852 ª 2007 The Authors Journal compilation ª 2007 FEBS
841
Abbreviations HFB, hydrophobin; ICMS, intact-cell MALDI-TOF MS.
T. Neuhof et al. Trichoderma hydrophobins
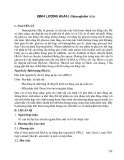
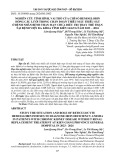
Fig. 1. Alignment of the six hydrophobin protein sequences of H. jecorina. Protein accession numbers and first amino acid of the protein after predicted signal peptide cleavage are: HFB1 (P52754; Q17), HFB2 (S62621; A16), HFB3 (trire.GWV1.31.87.1, scaffold 31: 136 622– 136 948; A17), HFB4 (estExt_fgenesh1_pg.C_50116, scaffold 5: 390 006–390 493; D25), HFB5 (trire.GWV1.11.179.1, scaffold 11: 162 998– 163 354; A17), HFB6 (trire.GWV1.3.266.1, scaffold 3: 1 189 586–1 190 177; no predicted signal peptide).
mechanism of mycoparasitism as well as the coloniza- tion of decaying wood.
(L12T11P119R10608). Their
bin-encloding EST sequences were retrieved from the TrichEST database (http://www.trichoderma.org): one encoding an ortholog of HFB3 from T. longibra- chiatum (L22T11P141R12690, L14T53P137R01628, L22T11P138R12431, and L22T11P137R12300), and the other one encoding an ortholog of HFB1 of T. atroviride sequence relationships and putative processing sites are illustra- ted in the alignment given in Fig. 1.
ICMS analysis of Trichoderma
Our information about the roles of hydrophobins in the physiology of Trichoderma, as well as in other fungi, is mostly derived from reversed genetics. Little is known about the occurrence and processing of the individual hydrophobins on the fungal surface. As a method for the rapid detection of hydrophobins from a large number of small samples, we have investigated the potential of intact-cell MALDI-TOF MS (ICMS). Initial applications of ICMS on fila- mentous fungi have demonstrated characteristic sets of ions for strain identification in mycelia [4–8] and spores [9–12]. We will show here that class II hydro- phobins account for the main characteristic peaks of Trichoderma, as the intact-cell extraction procedure employing a solvent mixture of acetonitrile and is suitable for dissolving these cell wall methanol constituents.
Results
Identification of new Trichoderma hydrophobins by EST search
In order to determine which hydrophobins could potentially be detected in Hypocrea jecorina, we first mined its genome database for members of class II hydrophobins. Besides the well-known HFB1 and HFB2, the HFB3 hydrophobin has been identified by cloning the corresponding gene [13] and further char- acterization of the protein [14]. We here identified HFB4, HFB5, and HFB6. In addition, two hydropho-
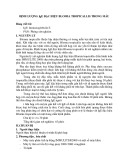
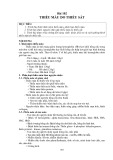
Several strains of Trichoderma were studied initially to examine the effectiveness of ICMS as an analytical method for distinguishing different species of Trichoder- ma. A rapid analytical procedure based on ICMS was established in order to characterize the low-molecular- weight proteometric (up to 20 000 Da) and peptidomet- ric (up to 2000 Da) profiles at the same time. Thirty-two Trichoderma strains belonging to various species were subcultivated on agar plates at an incubation tem- perature of 25 (cid:2)C and analyzed without further pre- treatments as described in Experimental procedures. Vegetative mycelia or spores were transferred from the biomass growing on agar plates directly to the MALDI sample plate and mixed with an acidic matrix in an organic solvent mixture. An estimated 106 cells were used per spot. Data obtained from triplicate samples grown for different times confirmed that the MS analy- ses were reproducible with respect to the characteristic biomarkers obtained. Figure 2 shows typical MALDI- TOF mass spectra of four strains of H. koningii, T. long- ibrachiatum, H. virens and T. atroviride. The spectra
FEBS Journal 274 (2007) 841–852 ª 2007 The Authors Journal compilation ª 2007 FEBS
842
T. Neuhof et al. Trichoderma hydrophobins
Fig. 2. Intact-cell MALDI-TOF mass spectra of mycelia and spores of Trichoderma strains. The masses 7347 and 7494 of T. atroviride spores correlate with two proc- essed products of the spore hydrophobin SRH1 [16] cleaved at the N-terminal MQFSI- VALFATGALA site and the C-terminal Phe, respectively.
showed a characteristic set of mass peaks in the range of 5–10 kDa, typically including two dominating peaks at approximately m ⁄ z 7000. As mycelia and spores largely remained intact, and the extraction solution contained acetonitrile and methanol, the well-known hydrophobins were suspected to be the signal source, and some were assigned by database analysis.
Identification of the class II hydrophobins produced by H. jecorina
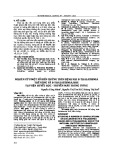
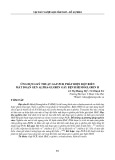
9874.32 Da is processed to a 75 amino acid peptide with a molecular mass of 7540.58 Da, which is further reduced by disulfide bond formation to 7532.58 Da [15]. The 86 residue HFB2 precursor with a mass of 8766.28 Da is processed to a 71 amino acid peptide with a calculated molecular mass of 7196.42 kDa, and further reduced by disulfide formation to 7188.42 Da [15]. Both hydrophobins were detected as [MH]+ sig- nals of the oxidized forms (Hfb1, m ⁄ z 7533; Hfb2, m ⁄ z 7189). A minor peak of m ⁄ z 7041 presumably cor- responds to the processed Hfb2 lacking the terminal Phe (7041.24 Da) (Fig. 3).
In order to identify the already known hydrophobin peaks and to validate the method described here, we first performed a detailed analysis of H. jecorina ¼ T. reesei QM 9414. To date, two major hydrophobin (HFB) proteins have been characterized in detail: the 97-residue HFB1-precursor with a molecular mass of
The same peaks were observed in the spectra obtained from isolated reference substances of HFB1 and HFB2 proteins (Fig. 3C). A second minor peak of m ⁄ z 7229 correlates with oxidized HFB2 cleaved at Ala13 lacking the N-terminal Phe. This tentative corre-
FEBS Journal 274 (2007) 841–852 ª 2007 The Authors Journal compilation ª 2007 FEBS
843
Fig. 3. Intact-cell MALDI-TOF mass spectra of H. jecorina strain QM 9414 (D), and the mutant strains QM 9414 Dhfb1 (B) and QM 9414 Dhfb1Dhfb2 (A). HFB I and HFB II indicate the processed hydrophobins. Whereas the HFB I peak is missing in the disruption mutant, the proportions of the processed HFB2 hydrophobins have been shifted. The double knockout (A) has no sig- nificant mass peaks in this region. As a con- trol spectrum, the purified hydrophobins are shown in (C).
T. Neuhof et al. Trichoderma hydrophobins
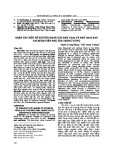
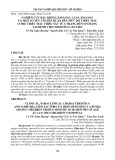
Fig. 4. Intact-cell MALDI-TOF spectra of mycelia (A, C, E) and sporulating mycelia (B, D, F) of three strains of H. jecorina grown on malt agar. The masses displayed have an error of about 0.1%, so peaks of 7232 (A), 7237 (E) and 7234 (F) represent similar peptides. Strain 618 mycelia (A) show a variety of peaks, in contrast to strains 665 and 937, shown in (C) and (E). However, there are only few similarities: 7232 and 7237 in (A) and (E), or 7509 and 7514 in (A) and (C). An obvious shift is the appearance of higher mass peaks upon sporulation, presum- ably related to the only large hydrophobin of H. jecorina.
lation of mass data is achieved by the calculation of successive deletions of terminal amino acid residues of all six hydrophobins providing this single match.
from HFB1
and HFB2,
HFB1 and HFB2 show shifts from m ⁄ z 7533 to 7541 and from m ⁄ z 7189 to 7197, respectively (supplementary Fig. S1). This characteristic feature of hydrophobins could therefore be used as a diagnostic tool to identify hydrophobin peaks in intact-cell MALDI-TOF spectra. In order to prove that the peaks described above hfb1D and originate hfb1 ⁄ hfb2DD strains were also analyzed to confirm the peak assignments: The double mutant hfb1– ⁄ hfb2 – did not show HFB1 and HFB2 signals (Fig. 3A), whereas
A rapid means of identifying peaks corresponding to hydrophobins in MALDI-TOF mass spectra was elab- orated, making use of the fact that hydrophobins con- tain eight cysteines forming four disulfide bonds. the four disulfides with dithiothreitol Reduction of increased the masses of all peaks corresponding to hydrophobins by 8 Da. Thus, the masses of processed
FEBS Journal 274 (2007) 841–852 ª 2007 The Authors Journal compilation ª 2007 FEBS
844
T. Neuhof et al. Trichoderma hydrophobins
Fig. 4. (Continued).
in the knockout mutant hfbI –, only the respective mass peak was missing (Fig. 3B).
show a prominent
Deviating post-translational processing of hydrophobins in H. jecorina strains
To investigate strain diversity with respect to meta- bolite production and low-mass proteomics by ICMS, three phylogenetically described isolates of H. jecorina were studied. As shown in Fig. 4, spectra of mycelia and sporulating mycelia directly taken from the plates after 1 or 3 days, respectively, differ in peak
compositions and intensities. Surprisingly, all spectra to strain QM 9414. Strain differ with respect CPK 618 mycelia signal of m ⁄ z 7232 (Fig. 4A), which disappears in the sporula- tion process, with new signals of m ⁄ z 8859, 8802 and 7521 appearing (Fig. 4B). To obtain a preliminary correlation of observed masses with hydrophobin data, we again calculated from the available sequence data sets of masses for each hydrophobin, succes- sively subtracting terminal residues and introducing disulfide bonds. The m ⁄ z 7232 peptide could thus be tentatively assigned to the hydrophobin HFB3 in the
FEBS Journal 274 (2007) 841–852 ª 2007 The Authors Journal compilation ª 2007 FEBS
845
T. Neuhof et al. Trichoderma hydrophobins
displayed a similar peak pattern, but with slightly dif- ferent masses of 7181, 7339 and 7739 Da. A database search in TrichoEST for the presence of other T. atro- viride hydrophobins led to the identification of an HFB1-like protein, which, after N-terminal processing (MKFFTAAALFAAVAIA), C-terminal processing (AVGA) and disulfide bond formation, has a mass of 7743 Da.
oxidized form, with cleavage of the N-terminal pep- tide at Ala31 and the C-terminal dipeptide at Pro102. The same mass is also observed in strain CPK 937 (Fig. 4E,F) as a prominent signal in myce- lia that almost disappears in the sporulation process. Peaks of m ⁄ z 8858 and 8863 were also observed in sporulating strains CPK 618 and CPK 665, respect- ively (Fig. 4B,D). These correspond in mass to HFB5 with an N-terminal cleavage at Ala8 including oxida- tion (8861 Da).
T. longibrachiatum
tetrapeptide.
and at
The main mass peak of T. longibrachiatum of m ⁄ z 7242 was assigned to an HFB3-type of hydrophobin identified by searching the TrichoEST database. The 10 235 Da precursor peptide would have been cleaved at the unique Arg site MQFLAVAALLFTAAFAAPSSEAHGLRRR, comprising 3 Arg residues in sequence (underlined), and this would have been followed by the formation of four disulfide bonds, leading to a mass of 7241 Da.
Comparison of the mycelial compositions of strains CPK 665 (Fig. 4C) and CPK 937 (Fig. 4E) shows four major peaks, all differing in mass, but none of them corresponds to the QM 9414 strain (Fig. 3). The main peak of CPK 665, m ⁄ z 7147, correlates with HFB1 with four disulfide bonds, cleaved N-terminally at In the C-terminal Arg22 QM 9414, HFB1I is not processed C-terminally. The m ⁄ z 6999 peak, the second prominent peak of strain CPK 665, can be assigned to Hfb2 C-terminally cleaved at Lys66 and oxidized. This peak is not present in any other strain investigated.
ICMS of class II hydrophobins can distinguish Trichoderma strains at the subspecies level
Although they are rather speculative, the interpreted masses agree with verified cleavage sites observed for HFB1 and HFB2 and known sites for signal peptidas- es and Kex2-type peptidases (Table 1). Verification of these assessments by tryptic digestion and sequencing is in progress.
Hydrophobin patterns in other T. atroviride and T. longibrachiatum strains
T. atroviride
The results described above for H. jecorina show that even under carefully controlled culture conditions, different strains of this taxon displayed different MS fingerprints. Because of the ease and speed of the analysis, we investigated whether the hydrophobin class II pattern of Trichoderma could be used in strain diagnosis at the species level. To this end, we selected isolates for 29 different species of Hypo- crea ⁄ Trichoderma and compared their hydrophobin molecular masses. Table 2 shows that, indeed, all of the species tested exhibited a unique combination of peaks with unique molecular masses. It is therefore interesting to note that even phylogenetically closely related species (such as T. hamatum and T. asperel- lum, or T. harzianum and T. fulvum [17], or T. fas- ciculatum and T. strictipile, which were recently revised to be actually the same species [18]), could be clearly separated. This is in accordance with the data on H. jecorina shown above, and implies that hydro- phobin fingerprints can in fact distinguish isolates at the subspecies level. All spectra are compiled in sup- plementary Fig. S2.
Discussion
Hydrophobin patterns
A hydrophobin gene (srh1) encoding a class II hydro- phobin with phylogenetic similarity to H. jecorina HFB2 (I. S. Druzhinina and C. P. Kubicek, unpub- lished results) has been found in T. atroviride (therein named ‘T. harzianum’ [16]). The main components of the sporulating mycelia of the same strain (T. atrovi- ride P1) could indeed be assigned to this hydrophobin, assuming similar post-translational processing as for the H. jecorina HFB2 (Fig. 2, top spectrum). The peaks at m ⁄ z 7499 and 7352 correspond to the proc- essed spore hydrophobin SRH1 with the cleaved signal sequence MQFSIVALFATGALA and an additional C-terminal Phe cleavage, respectively, including loss of the disulfide bonds. A minor peak at 8 Da for m ⁄ z 7741 could be tentatively correlated with the SRH1 hydrophobin with N-terminal cleavage of MQFSIVA, C-terminal processing following the two Glu residues of AAAQGTF, and four disulfide bonds. Interestingly, these peaks could not be detected in vegetative mycelia of T. atroviride P1 (Fig. 2), which
Genome sequencing of filamentous fungi has revealed the presence of multiple hydrophobin genes in filamen- tous fungi. We here report the the sequences of four
FEBS Journal 274 (2007) 841–852 ª 2007 The Authors Journal compilation ª 2007 FEBS
846
T. Neuhof et al. Trichoderma hydrophobins
Table 1. Confirmed and predicted hydrophobin cleavage sites.
Strain Hydrophobin Mass N-terminal processing C-terminal cleavage Comments
HFB1 7533 – Non-Kex2 type EDR ⁄ SNG H. jecorina QM 9414
protease processing, shown by N-terminal sequencing – HFB2 7189 ALA ⁄ AVC
Signal protease at A15, shown by N-terminal sequencing – F HFB2 7042 Unknown protease, ALA ⁄ AVC
predicted C-terminal cleavage – F HFB2 7229 TSA ⁄ LAA
Signal protease at A13, predicted C-terminal cleavage H. jecorina HFB3 7232 Predicted sites of signal ANA ⁄ FCP PIP ⁄ AI
strains 618 and 937
peptidase and predicted C-terminal cleavage by unknown protease – HFB4 8862 Predicted cleavage TVA ⁄ LFI within signal peptide HFB1 7147 Confirmed and EDR ⁄ SNG CQT ⁄ AVG H. jecorina strain 665 predicted non-Kex2 sites HFBII 6999 Confirmed signal ALA ⁄ AVC CQK ⁄ AIG
– T. atroviride P1 SRH1 7499 peptide site, predicted non-Kex2 site Predicted signal ALA ⁄ SVS peptide cleavage – F SRH1 7352 Predicted signal ALA ⁄ SVS
peptide cleavage, predicted C-terminal cleavage SRH1 7741 Predicted alternative IVA ⁄ LFA EE ⁄ AQG
signal peptide cleavage, predicted C-terminal cleavage HFB1 7743 Predicted signal AIA ⁄ GPV CQT ⁄ AVG
peptide cleavage, predicted C-terminal cleavage T. longibrachiatum HFB3 7242 – Predicted Kex2 site RRR ⁄ DQA cleavage
Instead, further processing has been observed, as has been demonstrated before from N-terminal sequence analysis of H. jecorina HFB1 and HFB2. Hydrophobin patterns even suggest strain-specific multiple cleavages of propepides.
Hydrophobin processing
The export of most type II hydrophobins involves both signal peptide cleavage and maturation of the propep-
new type II hydrophobins for H. jecorina, in addition to the known HFB1 and HFB2. Likewise, we identi- fied new hydrophobins in T. atroviride in addition to the known sporulation-specific one, and in T. longibra- chiatum. Direct MS analysis of mycelia in differing physiologic states provides evidence for differential expression of these genes in relation to the morpho- logic state. However, there is no clear match of the observed mass peaks to the predicted propeptides expected to originate from cleavage of signal peptides.
FEBS Journal 274 (2007) 841–852 ª 2007 The Authors Journal compilation ª 2007 FEBS
847
T. Neuhof et al. Trichoderma hydrophobins
Table 2. Biomarker masses of various Hypocrea ⁄ Trichoderma strains detected by ICMS. CBS, Centraalbureau voor Schimmelcultures, the Netherlands; DAOM, Eastern Cereal and Oilseed Research Centre, Canada; ATTC, American Type Strain Culture Collection, USA. The iden- tity of all strains was verified by sequencing internal transcribed spacer (ITS)1 and ITS2 and (if necessary) the long intron of tef1, and analyz- ing the sequences by TRICHOKEY [28] and TRICHOBLAST [29].
Species m ⁄ z m ⁄ z m ⁄ z m ⁄ z m ⁄ z m ⁄ z m ⁄ z m ⁄ z m ⁄ z
7895 7718 7214 7014 7024 7727 7269 7570 7594
7186 7167 7171 7214 7309 7611 7634
a T. fasciculatum is a synonym of H. strictipilis. b T. flavofuscum is a synonym of H. virens. c T. croceum is a synonym of T. polysporum (¼H. pachybasioides). d Identified as HFB3 type with processing at the Arg site: MQFLAVAALLFTAAFAAPSSEAHGLRRR. e Identified as processed HFB2 (see Fig. 2). f Identified as processed HFB1 (see Fig. 2). g Identified as processed HFB1-type hydrophobin: GPVEVRTGGG- SICPDGLFSNPQCCDTQLLGIIGLGCEVPSQTPRDGADFKNICAKTGDQALCCVLPIAGQDLLCQA. h Identified as processed SRH1 (see Fig. 1). i Identified as processed SRH1: LASVSVCPNGLYSNPQCCGANVLGVAALDCHTPRVDVLTGPIFQAVCAAEGGKQPLCCVVPVAGQDLLCEE.
7129 7171 7155 7432 7496 7440 7473 7490 7501 7490 7399 7346 7313 7517 7120 7459 7257 7286 7282 7255 7618 7141 7603 7093 7307 7021 7584 7748 7176 7293 7141 7055 7616 7342 7368 7522 7104 7156 7188 7284 7646 7333 7380 7835 7470 7429 7484 7240 7223 7242d 7229e 7533f 7042e 7481 7721 7189e 7202 7183 7073 7456 7186 H. tawa CBS 246.63 H. semiorbis CBS 244.63 H. hunua CBS 238.63 H. gelatinosa ATCC 7476 H. citrina CBS 977.69 H. aureoviridis CBS 254.63 T. strigosum CBS 348.93 T. tomentosum CBS 349.93 T. strictipilis CBS 347.93 T. longipile CBS 340.93 T. fasciculatum CBS 118.72a H. minutispora CBS 342.93 T. pubescens DAOM 162162 T. viride ATCC 28020 T. stromaticum CBS 101875 T. flavofuscum CBS 248.59b T. citrinoviride IMI 232088 T. brevicompactum CBS 109720 T. hamatum CBS 393.92 T. asperellum CBS 358.97 T. croceum DAOM 167068c T. fulvum DAOM 175924 T. oblongisporum CBS 343.93 H. lixii CBS 273.78 T. longibrachiatum CBS 816.68 H. jecorina QM 9414 T. spirale CBS 346.93 H. virens CBS 249.59 H. koningii CBS 460.96 T. atroviride ATCC 74058 T. atroviride (spores) 7744g 7739i 7344 7352h 7499h 7526
and sequencing work, or indirect studies employing proteinase knockouts or proteinase inhibition. This may indeed be speculative, but provides useful hypo- thetical data based on: (a) selective extraction leading to a limited set of no more than six small proteins; (b) known cleavage sites of signal peptidases and fungal Kex2-like proteinases; and (c) actual structural studies of H. jecorina HFB1 and HFB2.
tides. A considerable amount of information is avail- able on eukaryotic signal peptidase specificities, and cleavage site predictions can be performed using, for example, signalp (http://www.cbs.dtu.dk/services/ SignalP/) version 3.0 [19]). Owing to the limited amount of information available on eukaryotic pro- teins, an evaluation of version 2 reported a 78% accu- racy [20]. In this study, a selection of verified and predicted sites for hydrophobins is reported (Table 2). On the basis of confirmed structural data of H. jecorina HFB1, HFB2 and HFB3, we here predict the presence and cleavage patterns of additional hydrophobins. These data are based on calculated masses, which need to be confirmed by other experiments, such as isolation
In H. jecorina, maturation of HFB1, HFB2 and HFB3 includes signal protease processing that removes peptides 15 and 16 amino acids in length. This is fol- lowed by propeptide cleavage by a non-Kex2 protein- ase in the case of HFB1, cleaving at a monobasic site, and by Kex2 cleavage in the case of HFB3 [21],
FEBS Journal 274 (2007) 841–852 ª 2007 The Authors Journal compilation ª 2007 FEBS
848
T. Neuhof et al. Trichoderma hydrophobins
whereas HFB2 is not cleaved further in the N-teminal region. Mass spectra provide evidence for a C-terminal Phe cleavage for HFB2.
hydrophobin composition. Unexpectedly, the patterns observed indicate diverse cleavage reactions of the respective prepropeptides. These patterns are unlikely to be proteolytic artefacts of extraction, as proteases are unlikely to be active in methanol ⁄ acetonitrile mix- tures. As MALDI-TOF MS involves an especially gen- tle ionization process, cleavages of peptide bonds are generally not observed. Differences in hydrophobin processing are thus interpreted as being dependent on the presence and concentrations of specific proteinases acting on the respective propeptides.
Hydrophobins as biomarkers for ICMS of filamentous fungi
The ICMS spectra presented here provide evidence for similar cleavage patterns of hydrophobins HFBIII of H. jecorina and T. longibrachiatum, and SRH1 and HFB1 of T. atroviride, involving signal peptides, Kex2- type processing, and C-terminal amino acid cleavage (Table 2). In addition, the recorded masses provide evidence for alternative processing reactions. One reac- tion concerns alternative signal peptide cleavage sites at Ala13 for H. jecorina HFB2 and at Ala7 for T. atr- oviride SRH1. The predicted sites are compatible with the specificity profiles of signal peptidases, whereas their length is less than the average 15–40 residues. The second type of reaction is the cleavage of C-ter- minal peptides at Ala sites, e.g. at sites + 2 from the last conserved Cys, at Lys-Ala positions, at Glu-Ala positions, or at Thr-Ala positions. These predictions need confirmation by further analysis.
Comparing ICMS of bacteria and fungi
Hydrophobins are proposed to be suitable ICMS bio- markers for the following reasons: (a) fungi contain a set of hydrophobin genes, generally with developmen- tally regulated expression; (b) the hydrophobic pep- tides can be selectively dissolved and rapidly analyzed by MALDI-TOF MS; (c) hydrophobin patterns are diverse, due to post-translational processing; (d) the presence of the characteristic four disulfide bonds can be easily demonstrated by reduction; (e) owing to their fairly small size, sequence information for the hydro- phobins can be obtained by MS; (f) the respective genes are accessible by standard PCR methods; and (g) the variability of hydrophobins is fairly significant, and exceeds the similarities of other biomarkers pro- posed, e.g. ubiquitins. The sensitivity of detection employing the MALDI-TOF technique can be expec- ted to allow the identification of bacterial peptides with (cid:2) 100 microbial cells.
Experimental procedures
Reagents and standards
expression of hydrophobins
the
2,5-Dihydroxybenzoic acid from Anagnostec (Potsdam, Germany) was used as the matrix for MALDI-TOF experi- ments. Trifluoroacetic acid, ethanol, acetonitrile and meth- anol from Merck (Darmstadt, Germany) were used as solvents. The reference hydrophobins HFBI and HFBII were purified by two-phase separation and RP-HPLC puri- fication as described previously [25].
Microbial strains and cultivations
ICMS provides a rapid means for distinguishing bac- teria, spores, viruses and fungi [4–12]. It has the advantages of being very rapid, using small samples (subcolony amounts) and requiring minimal sample preparation. Bacterial intact-cell MALDI-TOF spectra in the range 2–20 kDa are dominated by a set of ri- intracellular bosomal proteins as highly abundant constituents [22]. This set of about 10–30 defined masses permits the identification at the species and subspecies ⁄ strain level. We here show that in filamen- tous fungi, hydrophobins are the dominating protein masses, whereas ribosomal proteins have not been identified. This result can be ascribed to the unique solubility properties of these hydrophobic proteins. Although there are several hydrophobin genes pre- sent, only a some of these might be expressed under it has been differing physiologic conditions. Thus, reported that is dependent on the morphologic state of T. atroviride (erroneously described as T. harzianum [16]). It has also been shown that expression and localization of in Cladosporium fulvum is specific hydrophobins dependent on the stages of the plant infection pro- cess, the hydrophobins being either retained on coni- dia and aerial structures or being excreted [23]. In Magnaporthe grisea, it has been demonstrated that the formation of disulfide linkages is required for secretion and cell wall localization [24].
The strains of H. jecorina used were: the wild-type strains QM 6a, TUB F-1038 (CPK 618), TUB F-733 (CPK 665) and CBS 498.97 (CPK 937) (all described in [26]); the cellu- lase moderately overproducing mutant strain QM 9414 [27]; and QM 9414 Dhfb1 (VTT D-99724 (ATTC 26921)
Indeed, we have shown here that sporulating and nonsporulating mycelia of several species differ in
FEBS Journal 274 (2007) 841–852 ª 2007 The Authors Journal compilation ª 2007 FEBS
849
atomic mass. All masses determined correspond to average atomic masses.
[28]) and QM 9414 Dhfb1Dhfb2 (VTT D-99725 [25]). Other Trichoderma spp. strains used in this study are listed in Table 1.
T. Neuhof et al. Trichoderma hydrophobins
MS analysis of low-molecular-mass peptides
Hypocrea jecorina QM 9414 and its mutants were cultiva- ted in liquid cultures on microtiter plates (200 lL volume) for 4 days in buffered minimal medium [15] complemented with 3% glucose and 0.2% peptone. The other strains of H. jecorina, as well as strains of other Trichoderma spp., were cultivated on malt extract agar (3%) at 25 (cid:2)C.
Measurements were performed in the delayed extraction mode, allowing the determination of monoisotopic mass values. A low mass gate of 800 Da improved the measure- ment by filtering out the most intensive matrix ions. The mass spectrometer was used in the positive ion detection and reflector mode.
Extraction and preparation of mycelia for MALDI-TOF analysis
Database search and alignments ) H. jecorina hydrophobins
genome
A few micrograms of fungal mycelia were suspended in acetonitrile ⁄ methanol ⁄ water (1 : 1 : 1), and 1 lL of the sus- pension was directly spotted onto target wells of a 100-posi- tion sample plate and immediately mixed with 1 lL of matrix solution [10 mgÆmL)1 2,5-dihydroxybenzoic acid in acetonitrile ⁄ methanol ⁄ water (1 : 1 : 1) and 0.3% trifluoro- acetic acid]. The sample matrix mixture was allowed to air dry prior to analysis. Alternatively, freeze-dried mycelium obtained from shaken cultures or fungi grown on plates was homogenized in 60% ethanol and centrifuged at 13 000 g using a Beckman Microfuge 11 (Beckman Coulter, Unterscheissheim, Germany). One microliter of the protein solution was spotted on a MALDI target plate and mixed with matrix.
The H. jecorina (http://gsphere.lanl.gov/trire1/ trire1.home.html) was screened for hydrophobin-encoding genes by using the tblastn (protein versus translated nuc- leotide) program. We used the hydrophobin class II protein sequences of other fungal species as queries to search the H. jecorina genome. Then, all putative hydrophobins, inclu- ding the newly identified hydrophobin from H. jecorina, were used to identify further proteins with similar domains, and finally all hypothetical proteins encoding hydrophobins from the annotated genomes of the Broad Institute (http:// www.broad.mit.edu/), Neurospora crassa, Gibberella zeae (Fusarium graminearum) and Magnaporthe griseae, were also used.
Reduction of disulfide bonds
Calculations of monoisotopic molecular masses of hydro- phobins was performed with the expasy proteomics server (http://www.expasy.org/) or the peptide mass calculator (http://rna.rega.kuleuven.ac.be/masspec/pepcalc.htm). To correlate observed mass peak data, masses of various N- and C-terminally processed and oxidized peptides were calculated and compared.
For reduction of proteins containing disulfide bonds, cells were suspended in 60% methanol, vortexed, and centri- fuged at 13 000 g using a Beckman Microfuge 11, and the supernatant was concentrated to dryness. The residual was redissolved in 50 mm Tris ⁄ HCl (pH 8) and 1 mm dithio- threitol and incubated for 1 h at room temperature.
Acknowledgements
Microbial characterization by MALDI-TOF MS analysis
This work was supported by a fellowship from the Deut- sche Forschungsgemeinschaft (Do270 ⁄ 10) and by the Fifth Framework program (Quality of Life and Man- agement of Living Resources; Project EUROFUNG 2; QLK3-1999-00729) of the European Community. The T. reesei genome sequencing project was funded by the Department of Energy. The authors thank M. Salohei- mo for helpful comments and discussions.
References
and the mass
2000,
1 Linder MB, Szilvay GR, Nakari-Setala T & Penttila¨ ME (2005) Hydrophobins: the protein-amphiphiles of filamentous fungi. FEMS Microbiol Rev 29, 877–896.
MS measurements were performed on a VOYAGER DE- PRO TOF mass spectrometer from Applied Biosystems (Foster City, CA, USA). Mass spectra were acquired in lin- ear delayed extraction mode using an acceleration voltage of 20 kV and a low mass gate of 1500 Da. For desorption of the components, a nitrogen laser beam (k ¼ 337 nm) was focused on the template. The laser power was set to just above the threshold of ionization. Spectra for individ- ual specimens were compiled, and results were averaged from at least 100 shots taken across the width of the speci- men for m ⁄ z values of 2000–20 000. In the linear mode, the resolution was accuracy was 1000 p.p.m. (0.1%). Calibration was done with the H. jeco- rina HFB1 protein with the 7533 Da calculated average
FEBS Journal 274 (2007) 841–852 ª 2007 The Authors Journal compilation ª 2007 FEBS
850
2 Harman GE, Howell CR, Viterbo A, Chet I & Lorito M (2004) Trichoderma species: opportunistic avirulent plant symbionts. Nat Rev Microbiol 2, 43–56.
expression of the vegetative and spore-bound hydropho- bins of Trichoderma reesei ) cloning and characteriza- tion of the hfb2 gene. Eur J Biochem 248, 415–423. 16 Munoz G, Nakari-Seta¨ la¨ T, Agosin E & Penttila M
(1997) Hydrophobin gene srh1, expressed during sporu- lation of the biocontrol agent Trichoderma harzianum. Curr Genet 32, 225–230.
3 Viterbo A & and Chet I (2006) TasHyd1, a new hydro- phobin gene from the biocontrol agent Trichoderma asperellum, is involved in plant root colonization. Mol Plant Pathol 7, 249–258.
4 Schmidt O & Kallow W (2005) Differentiation of
indoor wood decay fungi with MALDI-TOF mass spec- trometry. Holzforschung 59, 374–377.
17 Druzhinina I & Kubicek CP (2005) Species concepts and biodiversity in Trichoderma and Hypocrea: from aggregate species to species clusters? J Zhejiang Univ Sci B 6, 100–112.
18 Chaverri P, Castlebury LA, Overton BE & Samuels GJ (2003) Hypocrea ⁄ Trichoderma: species with conidio- phore elongations and green conidia. Mycologia 95, 1100–1140.
5 Valentine NB, Wahl JH, Kingsley MT & Wahl KL (2002) Direct surface analysis of fungal species by matrix-assisted laser desorption ⁄ ionization mass spectrometry. Rapid Commun Mass Spectrom 16, 1352–1357.
19 Bendtsen JD, Nielsen H, von Heijne G & Brunak S
(2004) Improved prediction of signal peptides: SignalP 3.0. J Mol Biol 314, 783–795.
6 Bryden WA, Lalekos MA & Morgan JS (2001) Methods for using mass spectrometry to identify and classify fila- mentous fungi, yeasts, molds and pollen). PCT Int Appl WO 2001092872.
20 Zhang Z & Henzel WJ (2004) Signal peptide prediction based on experimentally verified cleavage sites. J Prot Sci 13, 2819–2824.
7 Amiri-Eliasi B & Fenselau C (2001) Characterization of protein biomarkers desorbed by MALDI from whole fungal cells. Anal Chem 73, 5228–5231.
8 Neuhof T (2002) Matrix-assistierte Laser-Desorptions ⁄
Ionisations-Flugzeit-massenspektrometrische Untersuchungen an Ascomyceten und deren Metaboliten. Thesis, TU Berlin.
21 Goller SP, Schoisswohl D, Baron M, Parriche M & Kubi- cek CP (1998) Role of endoproteolytic dibasic proprotein processing in maturation of secretory proteins in Tricho- derma reesei. Appl Environ Microbiol 64, 3202–3208. 22 Dieckmann R, Kaesler I, Graeber I, Szewzyk U & von Do¨ hren H (2005) Rapid screening and dereplication of microbial isolates from marine sponges by intact-cell- MALDI-TOF mass spectrometry. J Appl Microbiol Biotechnol 67, 539–548.
9 Chen H-Y & Chen Y-C (2005) Characterization of intact Penicillium spores by matrix-assisted laser desorption ⁄ ionization mass spectrometry. Rapid Com- mun Mass Spectrom 19, 3564–3568.
23 Whiteford JA, Lacroix H, Talbot NJ & Spanu PD
10 Li TY, Liu BH & Chen YC (2000) Characterization of
Aspergillus spores by matrix-assisted laser desorption ⁄ ionization time-of-flight mass spectrometry. Rapid Commun Mass Spectrom 14, 2393–2400.
(2004) Stage-specific cellular localisation of two hydro- phobins during plant infection by the pathogenic fungus Cladosporium fulvum. Fungal Genet Biol 41, 624–631.
11 Welham KJ, Domin MA, Johnson K, Jones L & Ash-
ton DS (2000) Characterization of fungal spores by laser desorption ⁄ ionization time-of-flight mass spectrometry. Rapid Commun Mass Spectrom 14, 307–310.
24 Kershaw MJ, Thornton CA, Wakley GE & Talbot NJ (2005) Four conserved intramolecular disulphide lin- kages are required for secretion and cell wall localiza- tion of a hydrophobin during fungal morphogenesis. Mol Microbiol 56, 117–125.
25 Linder M, Selber K, Nakari-Setala T, Qiao M, Kula
12 Welham KJ, Domin MA, Johnson K, Jones L & Ash- ton DS (2000) Matrix-assisted laser-desorption ⁄ ioniza- tion time-of-flight mass spectrometry and its application to the analysis of fungal spores. Pharmacy Pharmacol Commun 6, 107–111.
MR & Penttila¨ M (2001) The hydrophobins HFBI and HFBII from Trichoderma reesei showing efficient inter- actions with nonionic surfactants in aqueous two-phase systems. Biomacromolecules 2, 511–517.
13 Penttila¨ M, Nakari-Seta¨ la¨ T, Fagerstro¨ m R, Selber K, Kula M-R, Linder M & Tjerneld F (2000) Process for partitioning of proteins. International Patent Applica- tion PCT ⁄ Fi00 ⁄ 00249, 24.3.2000.
26 Druzhinina IS, Schmoll M, Seiboth B & Kubicek CP (2006) Global carbon utilization profiles of wild-type, mutant, and transformant strains of Hypocrea jecorina. Appl Environ Microbiol 72, 2126–2133.
14 Rintala E, Linder M & Nakari-Seta¨ la¨ T (2006) Isolation and characterization of the HFBIII hydrophobin of Tri- choderma reesei. VIIp-9. 8th European Conference on Fungal Genetics, 8–11 April, Vienna, Austria, book of abstracts (Druzhinina IS, Kopchinskiy AG & Kubicek CP, eds), p. 264. VTT Publications, Espoo.
27 Askolin S, Penttila¨ M, Wo¨ sten HA & Nakari-Setala T (2005) The Trichoderma reesei hydrophobin genes hfb1 and hfb2 have diverse functions in fungal development. FEMS Microbiol Lett 253, 281–288.
28 Druzhinina IS, Kopchinskiy AG, Komon M, Bissett J, Szakacs G & Kubicek CP (2005) An oligonucleotide
15 Nakari-Seta¨ la¨ T, Aro N, Ilmen M, Munoz G, Kalkki- nen N, Alatalo E & Penttila¨ M (1997) Differential
FEBS Journal 274 (2007) 841–852 ª 2007 The Authors Journal compilation ª 2007 FEBS
851
T. Neuhof et al. Trichoderma hydrophobins
barcode for species identification in Trichoderma and Hypocrea. Fungal Genet Biol 42, 813–828.
T. Neuhof et al. Trichoderma hydrophobins
Intact-cell MALDI-TOF spectra (6000– Fig. S2. 10 000 m ⁄ z) of Trichoderma ⁄ Hypocrea strains. All indi- cated masses have been identified as hydrophobins by an m ⁄ z shift of 8 upon dithiothreitol reduction.
This material is available as part of the online article
29 Kopchinskiy A, Komon M, Kubicek CP & Druzhinina IS (2005) TrichoBLAST: a multilocus database for Tri- choderma and Hypocrea identifications. Mycol Res 109, 658–660.
from http://www.blackwell-synergy.com
Supplementary material
is available
Please note: Blackwell Publishing is not responsible for the content or functionality of any supplementary materials supplied by the authors. Any queries (other than missing material) should be directed to the corres- ponding author for the article.
The following supplementary material online: Doc. S1. Sequence data of hydrophobins. Fig. S1. Dithiothreitol reduction of H. jecorina QM 9414 hydrophobins.
FEBS Journal 274 (2007) 841–852 ª 2007 The Authors Journal compilation ª 2007 FEBS
852