Eur. J. Biochem. 269, 1662–1669 (2002) (cid:211) FEBS 2002
DNA supercoiling in Escherichiacoliis under tight and subtle homeostatic control, involving gene-expression and metabolic regulation of both topoisomerase I and DNA gyrase
Jacky L. Snoep1,2, Coen C. van der Weijden1, Heidi W. Andersen2,3, Hans V. Westerhoff1,4 and Peter Ruhdal Jensen3
1Departments of Molecular Cell Physiology and Mathematical Biochemistry, BioCentrum Amsterdam, Free University, Amsterdam, the Netherlands; 2Department of Biochemistry, University of Stellenbosch, South Africa; 3Section of Molecular Microbiology, Biocentrum, Technical University of Denmark, Lyngby, Denmark; 4Stellenbosch Institute for Advanced Study, South Africa
Keywords: metabolic control analysis (MCA); hierarchical control analysis (HCA); homeostasis coe(cid:129)cient.
regulatory mechanisms via which homeostasis is conferred, regulation of enzyme activity or regulation of enzyme expression, we quantified the first to be responsible for 72% and the latter for 28%. The gene expression regu- lation could be dissected to DNA gyrase (21%) and to topoisomerase I (7%). On a scale from 0 (no homeostatic control) to 1 (full homeostatic control) we quantified the homeostatic control of DNA supercoiling at 0.87. A 10% manipulation of either topoisomerase I or DNA gyrase activity results in a 1.3% change of DNA supercoiling only. We conclude that the homeostatic regulation of the nonequilibrium DNA structure in wild-type Escherichia coli is almost complete and subtle (i.e. involving at least three regulatory mechanisms).
with activities differing greatly from the wild-type activity. Such studies cannot be used to assess the homeostasis of supercoiling in the physiological situation, where the response to smaller challenges is important. When chal- lenged sufficiently, all systems will respond in drastic manners, or fail. It may well be that a system is robust with respect to small challenges, whilst it fails to deal with the same but larger challenges, or vice versa.
DNA in the bacterial nucleoid is negatively supercoiled and it has been estimated that roughly 50% of the supercoiling is constrained by proteins binding to the DNA [1]. This constraint does not depend on the continuous expenditure of ATP. The remaining supercoils are maintained actively at the cost of ATP hydrolysis, via topoisomerase activities. Four topoisomerases have been identified in Escherichia coli (reviewed in [2]). Topoisomerase I [3,4] and DNA gyrase (topoisomerase II) are mostly held responsible for main- taining the supercoiled state of the DNA while topoisom- erase III and IV manage the decatenation reactions. A recent publication suggested that topoisomerase IV may also be important for the relaxation of DNA supercoiling [5].
DNA of prokaryotes is in a nonequilibrium structural state, characterized as (cid:212)active(cid:213) DNA supercoiling. Altera- tions in this state a(cid:128)ect many life processes and a homeostatic control of DNA supercoiling has been sug- gested [Menzel, R. & Gellert, M. (1983) Cell 34, 105–113]. We here report on a new method for quantifying home- ostatic control of the high-energy state of in vivo DNA. The method involves making small perturbation in the expression of topoisomerase I, and measuring the e(cid:128)ect on DNA supercoiling of a reporter plasmid and on the expression of DNA gyrase. In a separate set of experi- ments the expression of DNA gyrase was manipulated and the control on DNA supercoiling and topoisom- erase I expression was measured [part of these latter experiments has been published in Jensen, P.R., van der Weijden, C.C., Jensen, L.B., Westerho(cid:128), H.V. & Snoep, J.L. (1999) Eur. J. Biochem. 266, 865–877]. Of the two
The importance of DNA gyrase and topoisomerase I for supercoiling has been shown in studies involving mutants
Correspondence to H. V. Westerho(cid:128), Free University, De Boelelaan 1087, NL-1081 HV Amsterdam, the Netherlands. Fax: + 31 20 4447229, Tel.: + 31 20 4447230, E-mail: hw@bio.vu.nl Abbreviations: IPTG, isopropyl thio-b-D-galactosidase; aLk, active linking number. (Received 16 October 2001, revised 17 December 2001, accepted 22 January 2002)
DNA gyrase activity is known to be controlled home- ostatically [6], but the extent of this control and its implications for the homeostatic control of supercoiling itself, have not been quantified. In general, homeostasis can be conferred via changes in enzyme activity (e.g. due to sensitivities for substrate, product or allosteric effectors) or via changes in enzyme concentration transferred through gene expression regulation. The activities of both DNA gyrase and topoisomerase I depend on the level of supercoiling. In vitro, topoisomerase I has been shown to be more active on more negatively supercoiled DNA, and it does not completely relax DNA [7]. In contrast, DNA gyrase is more active in vitro on relaxed DNA as compared to negatively supercoiled DNA [8]. Expression of the topoisomerase I [9] and DNA gyrase [6] also depends on DNA supercoiling as has been determined using gene fusion studies or (for DNA gyrase) via direct measure- ments of the expression (e.g [10]).
(cid:211) FEBS 2002
Control of DNA supercoiling by topoisomerase I (Eur. J. Biochem. 269) 1663
Topoisomerase concentration
Recently we used metabolic and hierarchical control analysis to determine the control of DNA gyrase on DNA supercoiling [11]. We have now used a similar strategy to determine the control of topoisomerase I. In addition we have now been able to determine the strength of the homeostasis and the relative importance of the regulatory loops. To our knowledge this is the first time that the relative contributions of gene expression and enzyme activity to homeostasis have been quantified.
M A T E R I A L S A N D M E T H O D S
The topoisomerase I and DNA gyrase content of the cells was estimated by quantitative Western blotting using an antibody against topoisomerase I and GyrA subunit, respectively. Purified topoisomerase I and gyrase were subjected to SDS/PAGE. After subsequent blotting to nitrocellulose and Ponceau staining [Ponceau-S, 0.2% in 3% trichlororacetic acid (Serva)] the topoisomerase I and gyrase A bands were cut out and ground. Polyclonal antibodies were raised by Eurogentec by immunizing rabbits with the ground fragments.
Bacterial strains
Construction of the plasmid used for the integration at the topAlocus pHA2
The cloning work was performed in the strain DH5a or JM105 [12,13]. Chromosome integration was performed in strain MC1000 [14].
tricine (4 mM), valine,
Growth of cultures
PHA5
A 1549-bp PCR fragment containing the DNA region upstream of topA, the topA promoter and the N-terminal part of topA was amplified using primers ECTOPA, accession number X04475, bp322–342, i.e. 5¢-CGAA GAAGGGCGGGGAGAAAT-3¢ +bp1870–1850, i.e. 5¢- TCCATAGCAGCGGCGAAACCA-3¢ and chromosomal DNA from strain LM1237 [17] as a template. The PCR fragment was subsequently digested with the enzymes DraI and EcoRV and a 842-bp fragment containing the DNA region upstream of topA and the topA promoter was isolated and inserted into pUC19 (New England Biolabs) digested with SmaI, resulting in the plasmid pHA2.
Enzymes
The 1549-bp PCR fragment described above was digested with EcoRV and SspI and a 572-bp fragment containing the N-terminal part of the topA gene was isolated and inserted into pUC19 digested with SmaI, resulting in the plasmid pHA5.
Restriction enzymes, T4 DNA ligase, and T4 DNA polymerase were obtained from and used as recommended by New England Biolabs and Boehringer Mannheim.
PTOPA2TS
Plasmid and ATP, ADP extraction
Aliquots (0.8 mL) were removed from cell cultures and placed into an equal volume of 80 (cid:176)C phenol. After centrifugation and chloroform extraction, ATP/ADP was measured in a sample from the water phase and DNA was extracted using standard isopropanol precipitation. This method has been described more extensively previously [16].
In the topoisomerase I and DNA gyrase modulation (40 mM, experiments cells were pregrown in Mops pH 7.4) minimal salts medium [15] containing 0.5% w/v leucine and isoleucine glucose, (40 lgÆmL)1 each), thiamine (10 lgÆmL)1) and ampicillin as antibiotic marker for pBR322 (100 lgÆmL)1) at the relevant isopropyl thio-b-D-galactosidase (IPTG) concen- tration. After over night growth, the cells were diluted in the same medium to an D540 of 0.005 and growth was followed for at least five generations before sampling. All samples were withdrawn between D540 (cid:136) 0.2 and 0.4.
ATP/ADP assay
Intracellular concentrations of ATP and ADP were meas- ured using a luciferin–luciferase ATP monitoring kit (LKB), essentially according to the manufacturer’s recommenda- tions. This method has been described previously [17].
pGYRABTS was constructed previously for site specific integration of a lac-type promoter in the gyrA locus [11]. Important features of this plasmid are that the replication is temperature sensitive, and that the pA1lacO-1 promoter and the lacI q1 gene are surrounded by a DNA fragment originating from upstream the gyrA gene and a fragment containing the N-terminal part of the gyrA gene. To create a plasmid for integration of the lac-type promoter at the topA locus, it is necessary to replace the two regions containing DNA from the gyrA locus on pGYRABTS with DNA fragments taken from upstream the topA gene and a fragment containing the N-terminal part of the topA gene. pGYRABTS was first digested with KpnI and BamHI to excise the gyrA upstream region, treated with T4 DNA polymerase to create blunt ends. Subsequently, a 811-bp HincII fragment from pHA2 containing the DNA region upstream of topA and the topA promoter was inserted into the blunted KpnI–BamHI sites, resulting in the plasmid pTOPA2TS.
Supercoiling assay
PTOPA2A5TS
DNA supercoiling was assessed in terms of the linking number of intracellular plasmid pBR322 [18]. DNA super- coiling was expressed as the active linking number, aLk, which is the difference in linking number of pBR322 in the respective sample and of pBR322 isolated from cells incubated for 30 min with 0.1 mgÆmL)1 of coumermycin and 0.2 mgÆmL)1 rifampicin. pTOPA2TS was digested first with PstI and then with EcoRI (partial digest), which removes the N-terminal part of the
1664 J. L. Snoep et al.
(Eur. J. Biochem. 269)
(cid:211) FEBS 2002
gyrA gene. Subsequently a 625-bp EcoRI–PstI fragment from pHA5 containing the N-terminal part of topA was inserted. This resulted in the plasmid pTOPA2A5TS, in which the pA1lacO-1 promoter and the lacIq1 gene are surrounded by a DNA fragment originating from upstream the topA gene and a fragment containing the N-terminal part of the topA gene.
Replacement of the chromosomal topApromoter with an inducible lac-type promoter and a lacIq1 gene
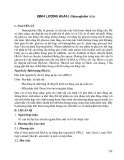
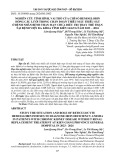
Fig. 1. IPTG induction of topoisomerase I expression. E. coli strain HWA36 was incubated with IPTG at concentrations ranging from 0 to 0.5 mM. Topoisomerase I concentrations in cellular extracts were measured by Western analysis using polyclonal topoisomerase I anti- bodies. Topoisomerase I concentration was expressed as amounts per gram protein and then normalized to the amount found in wild-type cells. Results from five independent experiments are shown using dif- ferent symbols for each. Each data point is the average of three measurements (samples taken at D540 (cid:136) 0.2, 0.3 and 0.4). The error bars denote the standard error of the mean. Precise growth conditions are given in Materials and methods.
Plasmid pTOPA2A5TS was integrated in the chromosome of E. coli strain MC1000. Clones in which a second cross over has taken place were selected on basis of chloram- phenicol sensitivity. Such clones were found at a frequency of 2.7 · 10)3. The second cross over will either re-establish the wild-type gene configuration in the topA locus, or it will leave the IPTG regulatory elements upstream of topA. The latter clones should still respond to the presence of IPTG, and such clones were indeed found at a frequency of 22% of the second cross over event. Southern blot analysis and DNA sequencing of one of these clones in the topA locus, i.e. strain HWA36, confirmed that the pA1lacO-1 promoter and the lacI q1 gene had indeed been inserted upstream of the topA gene.
R E S U L T S
Modulation of the expression of topoisomerase I by IPTG
To determine how readily changes in topoisomerase I activity compromises DNA structure, we set up a system where we could modulate the enzyme around its physio- logical concentration. We substituted an IPTG driven promoter for the natural promoter of the chromosomal topA gene. In E. coli strain HWA36 topoisomerase I expression was indeed dependent on IPTG concentration as is shown in Fig. 1. In the absence of IPTG the expression was very low (2–5% of wild-type). Precise modulation of expression around the wild-type level (at (cid:25) 40 lM IPTG), but also over-expression up to 20 times wild-type was possible. At any given IPTG concentration no significant dependence of topoisomerase concentration on cell density was detected, in the range of cell concentrations represented by D540 (cid:136) 0.2–0.4, indicating a constant expression level of the enzyme (data not shown; cf [19]). Under these conditions we should be able to ask how readily DNA supercoiling is perturbed by changes in topoisomerase I activity.
c
b (cid:136) 7.1069, b
1 (cid:135) e
aLk (cid:136) a (cid:135) c (cid:136) ) 5.2409,
c (cid:136) 1.4141, with long
(cid:255)(cid:133)topoisomerase I(cid:255)c(cid:134) d d (cid:136) 1.6430,
a (cid:135) c(cid:1)ln(cid:133)topoisomerase I(cid:134)
defined
coordinates. Thus d(cid:133)aLk(cid:134)
aLk
the control d(cid:133)topoisomerase I(cid:134) (cid:1) topoisomerase I
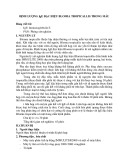
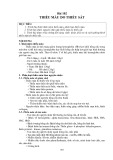
Fig. 2. Dependence of DNA supercoiling on topoisomerase I expression. (A) HWA36 was incubated with IPTG concentrations ranging from 0 to 0.5 mM. Results of five independent experiments are shown using di(cid:128)erent symbols for each. Each data point is the average of three measurements. The error bars denote the standard error of the mean. Wild-type is shown as a closed circle. The following equations were b fitted through the data points: solid line, aLk (cid:136) a (cid:135) 1 (cid:135) (cid:133)topoisomerase I (cid:134)d a (cid:136) )16.1886, with d (cid:136) )1.0819, short dash, a (cid:136) )173.219, b (cid:136) 163.529, aLk (cid:136) dash, 1 (cid:135) b(cid:1)ln(cid:133)topoisomerase I(cid:134) (cid:135) d(cid:1)(cid:133)ln(cid:133)topoisomerase I(cid:134)(cid:134)2 with a (cid:136) )13.460, b (cid:136) )0.0125, c (cid:136) 1.3983, d (cid:136) 0.0072. (B) Shown as an insert is the control of topoisomerase I on DNA supercoiling. Inherent control coe(cid:129)cients are calculated by multiplying the derivative of the fitted curves in (A) at each point of the graph with the quotient of the respective coe(cid:129)cient x/y as caLk is obtained. At wild-type topoisomerase I (cid:136) topoisomerase concentration an inherent control coe(cid:129)cient of )0.14 was calculated. ‘topoisomerase I’ refers to the concentration of topoisomerase I relative to the wild-type.
Is DNA supercoiling readily compromised by topoisomerase I?
From the plot of aLk vs. the topoisomerase I concentration (Fig. 2), it can be deduced that supercoiling is not very sensitive for changes in topoisomerase I activity. Over a thousand-fold range of expression of topoisomerase I the aLk varied by no more than six linking numbers, i.e. between )3 and +3 linking numbers relative to the )13 active links of the same plasmid in wild-type cells. Figure 2A shows that at very low activities of topoisomerase I the DNA supercoiling depended even more weakly, if at all, on the enzyme. At wild-type expression levels, the dependence appeared to be stronger.
(cid:211) FEBS 2002
Control of DNA supercoiling by topoisomerase I (Eur. J. Biochem. 269) 1665
daLk
(cid:1) aLk ktgyrase
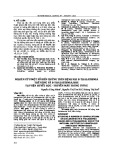
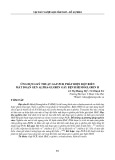
Fig. 3. DNA gyrase expression as a function of aLk. The concentration of DNA gyrase is plotted at di(cid:128)erent aLk values obtained by incu- bation of strain HWA36 with di(cid:128)erent concentrations of IPTG. Data from five independent experiments are shown using di(cid:128)erent symbols for each. Data points are averages of three measurements. The error bars denote the standard error of the mean. Wild-type is shown as a closed circle. The elasticity coe(cid:129)cient defined as ektgyrase supercoiling (cid:136) dktgyrase was calculated by multiplying the derivative of the fitted curve at each point of the graph with the quotient of the respective x/y coordinates. At wild-type level of supercoiling an elasti- city coe(cid:129)cient of )1.6 was calculated.
At the physiological level of expression the control of DNA supercoiling by topoisomerase I amounted to no more than )0.14 ((cid:139) 0.03), i.e. for a 10% increase in topoisomerase I activity, supercoiling decreased by only 1.4%. The negative sign of the coefficient expresses that the aLk decreased with increasing topoisomerase activity, as expected. Throughout the vast range of expression levels tested, topoisomerase I never had a high control on DNA supercoiling. Also when the DNA became quite relaxed, its control remained well below 0.2: DNA supercoiling is not readily compromised by extra topoisomerase I.
Homeostasis of growth rate
less than the factor of perhaps 500 required to counteract the effect of topoisomerase I and explain that supercoiling only varied by 50% (Fig. 2). This lack of response of gyrase expression to the modulation of the topoisomerase I activity implies that, notwithstanding the indications [6] that strong interference with DNA supercoiling induces gyrase expres- sion, in the physiological state topoisomerase I has little control over gyrase gene expression.
Under the conditions tested the specific growth rate of E. coli strain MC1000 was 0.93 h)1 ((cid:139) 0.03) and was observed to be almost insensitive to a modulation of topoisomerase I around its wild-type expression level. Only at very low and very high expression levels was the growth rate reduced by at most 25% (data not shown). The dependence of growth rate on topoisomerase activity around the physiological state was estimated as precisely as possible: the corresponding control coefficient was as low as 0.03, reflecting that a doubling of the topoisomerase activity decreased growth rate by a mere 3%.
How strong or weak the effect of topoisomerase I on supercoiling actually was, can be quantified in terms of the control coefficient of metabolic control analysis [20,21]. With respect to the control of DNA supercoiling by topoisomerase I this coefficient (csupercoiling topoisomerase I) corresponds to the percentage change in aLk upon a 1% change in topoisomerase I activity. Because it depends on the ratio of small differences, this coefficient is subject to substantial experimental error and this required us to be careful in its estimation. Three types of curve were therefore fitted to the data points of Fig. 2A. The types of curve were selected such that they should provide bounds for the true dependence of aLk on topoisomerase concentration at the wild-type level (see figure legend for details on the curves used). The slopes of these curves were then calculated at each point and normalized by the ratio of aLk to the topoisomerase activity of that point. In this manner an upper ()0.09) and a lower ()0.16) boundary for the control coefficient at wild-type concentration was obtained. The same procedure gave estimates for the control coefficient at all other topoisom- erase I concentrations (cf. Figure 2B).
Homeostasis through supercoiling dependent DNA gyrase expression
The purported mechanism for such a control of gyrase gene expression is the effect that topoisomerase I has on DNA supercoiling in connection with the dependence of gyrase gene expression on DNA supercoiling. This promp- ted us to ask whether this lack of control by topoisomerase I on DNA gyrase expression was due to a low sensitivity of the gyrase promoters to supercoiling. The variation of the expression level of DNA gyrase with DNA supercoiling when modulating topoisomerase I is shown in Fig. 3. There was a weak dependence of gyrase expression on DNA supercoiling, which was evaluated in terms of the elasticity coefficient of metabolic control analysis. The derivative of the plot in Fig. 3 was taken and normalized to the ratio of expression to supercoiling. In this way the overall [11,22] elasticity of gyrase expression with respect to supercoiling was estimated, i.e. the percentage change in expression rate of gyrase upon a 1% change in aLk. At the aLk observed in the wild-type strain, i.e. )12.7 (cid:139) 0.3, an elasticity of )1.6 was calculated. Accordingly, the absolute magnitude of this elasticity coefficient suggests that gyrase gene expression was sufficiently sensitive to DNA supercoiling to respond to significant changes in supercoiling (cf. below). Therefore, the lack of control of topoisomerase I on gyrase expression must again have been due to, rather than caused by, the small effect the former had on DNA supercoiling. Clearly
The expression of the DNA gyrase genes is altered by mutations that strongly affect DNA supercoiling [6,9]. If in our experiments the concentration of DNA gyrase changed in proportion to the change in concentration of topoisom- erase I, one should expect supercoiling to be virtually unaffected by the modulation of topoisomerase expression levels; indeed such a compensation mechanism could explain the observed homeostasis. Accordingly we meas- ured the cellular concentration of DNA gyrase at the various expression levels of topoisomerase I.
However, over the thousand-fold range of expression levels of topoisomerase I the DNA gyrase concentration changed by a factor of 2 only (data not shown), i.e. much
1666 J. L. Snoep et al.
(Eur. J. Biochem. 269)
(cid:211) FEBS 2002
D I S C U S S I O N
(cid:1)
supercoiling (cid:136) dkttopoisomerase I
daLk
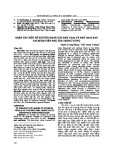
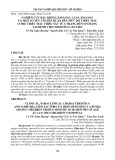
Fig. 4. Topoisomerase I expression as a function of aLk. The concen- tration of topoisomerase I is plotted at di(cid:128)erent aLk values obtained by incubation of strain PJ4273 [11] with di(cid:128)erent concentrations of IPTG. Data from two independent experiments are shown using three di(cid:128)erent symbols for each. Data points are averages of measurements. The error bars denote the standard error of the mean. Wild-type is shown as a closed circle. The elasticity coe(cid:129)cient defined as ekttopoisomerase I aLk was calculated by multiplying kttopoisomerase I the derivative of the fitted curve at each point of the graph with the quotient of the respective x/y coordinates. A wild-type level of super- coiling an elasticity coe(cid:129)cient of 0.56 was calculated.
the supercoiling-dependence of gyrase expression was not the dominant homeostatic mechanism for DNA supercoiling.
Homeostasis through supercoiling dependent topoisomerase-I expression?
Homeostatic control of DNA supercoiling in prokaryotes has been proposed previously [6]: the enzyme that causes negative supercoiling, i.e. DNA gyrase, was repressed by highly negative supercoiling. This observation showed homeostatic control of DNA gyrase expression but not of DNA supercoiling itself, as the implications for DNA supercoiling were not determined. In addition the strength of the homeostatic control and whether it also occurred in and around the physiological state, had not yet been addressed.
system at steady state
DNA gyrase and topoisomerase I are considered to be the most important enzymes in controlling the level of supercoiling in E. coli [23]. This suggests two mechanisms of homeostasis [6,9]. One is that decreased supercoiling may enhance the expression level of DNA gyrase that then leads to an increase of supercoiling. The second is that the decreased supercoiling diminishes the expression level of topoisomerase I, which leads to enhanced supercoiling. There should be two additional, more direct mechanisms. One consists of the phenomenon that the rate at which DNA gyrase supercoils DNA may decrease with the extent to which that DNA is supercoiled, with zero activity at the static head situation [24]. The other relies on a more than proportional dependence of the catalytic rate of topoisom- erase I on the extent of DNA supercoiling. Homeostasis of DNA supercoiling could be called (cid:212)subtle(cid:213) if all four of these mechanisms were involved. It could be called (cid:212)simple(cid:213) if only one mechanism was operative. In our analysis we focus on topoisomerase I and DNA gyrase as the main topoisom- erases controlling DNA supercoiling in wild-type E. coli. Recently it was found that also topoisomerase IV plays a role in controlling DNA supercoiling most importantly in DNA that is less negatively supercoiled [5]. Our analysis method can be extended to also include topoisomerase IV but this would make it unnecessarily complicated (see later). We have here quantified experimentally the control of topoisomerase I on DNA supercoiling. In combination with the results published recently on DNA gyrase [11] these results can be used to quantify the strengths of these homeostatic mechanisms, in terms of the strengths of the corresponding regulatory loops. In metabolic control ana- lysis the extent to which a parameter controls a variable is quantified by a control coefficient. For instance for the control of aLk by topoisomerase I this ((cid:212)intrinsic(cid:213), see below and [11]) control coefficient is defined as: (cid:18) (cid:19) (cid:133)1(cid:134) csupercoiling topoisomerase I (cid:136) dlnjaLkj dlnVtopoisomerase I
In strain HWA36 the expression of topoisomerase I is controlled by the IPTG concentration in the medium and does not reflect the normal supercoiling sensitivity. Having determined the overall elasticity of DNA gyrase gene- expression to supercoiling, we became interested in quan- tifying the extent to which topoisomerase I gene expression normally depends on DNA structure. Perhaps this depend- ence could contribute significantly to homeostasis of DNA structure in wild-type cells. A strain in which DNA gyrase expression can be modulated by IPTG, and in which the topoisomerase I gene is under control of its normal promoter, was used to address this question (E. coli PJ4273 [11]). Through gyrase modulation, DNA supercoil- ing of the pBR322 probe plasmid could be directed to anywhere between )15 and )6 aLks [11]. Only at highly negative supercoiling was an effect on topoisomerase I expression detected (Fig. 4). The elasticity of the topoisom- erase expression reflects this dependency. At wild-type aLk ()12.7 (cid:139) 0.3) an elasticity of 0.56 was estimated. These results suggest that in the wild-type cells supercoiling dependent expression of topoisomerase I is not a dominant mechanism either for the homeostasis of DNA structure.
where Vtopoisomerase I represents the Vmax of the topoisom- erase I reaction. Note that the lower case c is used for this type of control coefficient. The value of the control coefficient is equal to the percentage change that is observed in the aLk upon a percentage change in the activity of topoisomerase I.
What we are left with is the possibility that there is a third dominant homeostatic mechanism, or that various mecha- nisms contribute, such than none is dominant. In the Discussion we shall address these possibilities in detail. In addition gyrase activity will influence DNA supercoil- ing. The sensitivities (defined as elasticity coefficients by metabolic control analysis) of both enzymes to changes in supercoiling will determine the magnitude of the control coefficients. Using the concentration summation and connectivity theorems (cf. [22]). the intrinsic control by
(cid:211) FEBS 2002
Control of DNA supercoiling by topoisomerase I (Eur. J. Biochem. 269) 1667
supercoiling (cid:255) evgyrase
supercoiling (cid:255) ektgyrase
supercoiling (cid:255) 1
Hsupercoiling topoisomerase I and gyrase can be expressed in terms of elasticities:
topoisomerase I
supercoiling (cid:135) ekttopoisomerase I evtopoisomerase I supercoiling (cid:135) ekttopoisomerase I evtopoisomerase I
supercoiling (cid:255) evgyrase
supercoiling (cid:255) ektgyrase
supercoiling
supercoiling
supercoiling and ektgyrase
(cid:136) (cid:136) (cid:136) (cid:255)csupercoiling (cid:133)2(cid:134) csupercoiling gyrase 1 evtopoisomerase I supercoiling (cid:255) evgyrase (cid:133)4(cid:134)
four of
The elasticities of gyrase activity and gyrase expression for supercoiling are negative (i.e. the activity and expression of DNA gyrase is inhibited not stimulated by higher levels of supercoiling) and those of topoisomerase I positive. Con- these elasticities can contribute sequently all positively to the homeostatic control of supercoiling. The equation suggests that the subtlety of the homeostatic control in the above sense can be determined by inspecting whether all four elasticities are of significant magnitudes.
(cid:136)
Csupercoiling gyrase
supercoiling (cid:135) ekttopoisomerase I evtopoisomerase I
1 supercoiling (cid:255) evgyrase
supercoiling (cid:255) ektgyrase
supercoiling
(cid:136) (cid:255)C supercoiling
(cid:133)3(cid:134)
topoisomerase I
Not only the activity but also the expression level of DNA gyrase and topoisomerase I depend on supercoiling. In the analysis this is expressed in two additional elasticities, as was deduced previously [25]; ekttopoisomerase I supercoiling, reflecting the sensitivity of transcription of topoisomerase I and DNA gyrase for DNA supercoiling. Certain simplifications were made in [25], i.e. grouping of transcription and translation, assuming that transcription/translation is product insensit- ive and mRNA and protein degradation follow first order kinetics (for a more general treatment, see [26]). Expressing the control coefficients in terms of elasticities in such a system leads to the following expression for the (cid:212)global(cid:213) control (hence the capital Cs) by the topoisomerases on supercoiling:
C supercoiling
(cid:136)
ttopoisomerase I Osupercoiling etopoisomerase I
C
t topoisomerase I e topoisomerase I ttopoisomerase I
(cid:133)5(cid:134)
(cid:136)
supercoiling (cid:255) evgyrase
supercoiling
1 evtopoisomerase I supercoiling (cid:255) ektgyrase For the corresponding inherent control by gyrase one finds:
1
(cid:136)
(cid:136)
(cid:133)6(cid:134)
tgyrase Osupercoiling egyrase Csupercoiling tgyrase Cegyrase tgyrase
supercoiling
supercoiling (cid:255)evgyrase
In this paper we have shown that homeostasis of DNA supercoiling is strong; a thousand-fold variation of the topoisomerase I activity has relatively little effect on DNA supercoiling, as indicated by an inherent control coeffi- cients of only )0.14. We attribute this small effect to intracellular mechanisms that work to maintain the DNA supercoiling at its physiological magnitude. Amassing these mechanisms under the single title of (cid:212)homeostatic mech- anisms(cid:213), we aimed at identifying some of them and at determining their relative importance. Especially for the latter issue, we required a quantitative measure of the extent of homeostatic control. We therefore introduce the so-called homeostasis coefficient H, which quantifies the extent to which homeostatic processes annul DNA relaxation activity. It is defined as the percentage change in aLk that is prevented by the homeostatic processes. In exact terms this becomes:
(cid:18)
(cid:19)
H (cid:136) 1 (cid:255)
dln(cid:133)aLk(cid:134) dlnvtopoisomerase I
system at steady state
In the strain used to manipulate the topoisomerase I concentration, expression of topoisomerase I is controlled by IPTG and the elasticity with respect to supercoiling is zero. The transcription rate of topoisomerase I was modu- lated and the effect on topoisomerase I concentration and supercoiling measured, leading to a measured value for the inherent control coefficient of topoisomerase I with respect to DNA supercoiling (in metabolic control analysis terms, a coresponse coefficient):
topoisomerase I
(cid:136) 1 (cid:255) C supercoiling
supercoiling (cid:135)ekttopoisomerase I evtopoisomerase I For topoisomerase I an inherent control of )0.14 ((cid:139) 0.03) was determined experimentally while for DNA gyrase an inherent control of 0.17 ((cid:139) 0.01) was measured [11]. Global control coefficients (Eqn 3) can be calculated from the inherent control coefficients by adding the elasticities of expression of DNA gyrase and topoisomerase I (i.e. )1.6 and +0.56, respectively) for supercoiling in Eqns (6) and (5), respectively. In this manner a global control of supercoiling by activity of 0.13 (absolute value) is obtained both for DNA gyrase and topoisomerase I. The sum of these two control coefficients had to be zero, providing a consistency check of the calculations. Also the inherent ((cid:212)metabolic(cid:213)) control coefficients (Eqn 2) can be calculated: for topoiso- merase I and DNA gyrase a value of 0.18 was calculated (positive for DNA gyrase, negative for topoisomerase I). The consistency (i.e. both the inherent and the global control coefficients of topoisomerase I and DNA gyrase must add up to zero) indicates that the assumption made in the analysis (i.e. that topoisomerase I and DNA gyrase are the main contributors to the steady state wild-type level of supercoiling) is correct within the error of measurement.
With this definition, when a 10% increase in relaxation activity leads to a 10% decrease in linking number, no relaxation is prevented and H becomes equal to 0; there is no homeostasis. When there is no decrease in linking number, H equals 1, i.e. there is complete homeostasis. The utility of the definition is that we can now evaluate intermediary cases between no and complete homeostasis. Homeostasis of DNA supercoiling in E. coli is such an intermediary case: in terms of this definition, it is quantified as 1 ) 0.13 (cid:136) 0.87, i.e. 87% of complete homeostasis. This shows that home- ostasis of DNA supercoiling is quite strong.
Via the elasticity coefficients the contribution of the two regulatory loops, i.e. via enzyme activity or via gene expression regulation, to this homeostasis can be quantified. From Eqn (3) and the definition of H, it follows that this coefficient is independent of whether topoisomerase I is activated or DNA gyrase is inhibited to compromise DNA, and equal to:
1668 J. L. Snoep et al.
(Eur. J. Biochem. 269)
(cid:211) FEBS 2002
supercoiling (cid:136) ektgyrase
supercoiling (cid:255)
e topoisomerase I
The sum of elasticities of the gene expression loops equal 2.2 (i.e. 1.6 + 0.56). The sum of the kinetic elasticity coeffi- cients can be calculated from Eqn (5): promoter fusions were plasmid constructs while in the the native chromosomal present study we looked at promoter activities. The location of the promoter might very well have an effect on its sensitivity for supercoiling. evtopoisomerase I supercoiling (cid:255) evgyrase 1 ttopoisomerase I Osupercoiling
(cid:136) (cid:255)1:6 (cid:135) 7:2 (cid:136) 5:6
And from Eqn (6):
supercoiling (cid:136) (cid:255)ekttopoisomerase I
supercoiling (cid:135)
e topoisomerase I
evtopoisomerase I supercoiling (cid:255) evgyrase 1 ttopoisomerase I Osupercoiling
(cid:136) (cid:255)0:56 (cid:135) 6:1 (cid:136) 5:5
The two independent determinations of the sum of the kinetic elasticity coefficients (i.e. 5.6 and 5.5) are in good agreement with each other. Thus, 72% (5.6 of 7.8) of the homeostasis of DNA supercoiling in the wild-type cells is due to regulation at the activity level and 28% (2.2 of 7.8) is due to regulation at the gene expression level. Of the latter 28%, 7% is accounted for by regulation through topo- isomerase I expression levels and 21% through gyrase expression levels. Clearly, homeostasis of DNA supercoiling is regulated in a subtle manner involving at least three different regulatory routes, with the direct effect of super- coiling on enzyme rates being the strongest, although not dominant, homeostatic mechanism. We have shown that for the specific case of DNA supercoiling, homeostatic control resides predominantly (72%) in the metabolic (enzyme activity) level and to a lesser extent (28%) in the gene-expression level of the cellular control hierarchy. Although the specific distribution over these regulatory levels will depend on the system under study, the methods we have used to delineate our system (metabolic and hierarchical control analysis) are generally applicable. Such quantitative analysis tools are essential to understand the working of the multilayered cell. Recent advances in the X-omics and bioinformatics fields make it possible to study the regulation of cell function both comprehensively and fairly quantitatively. Yet it is of crucial importance to evaluate how much of a given regulation is effected at the level of gene expression and how much by metabolic regulation. Although this argument has been clear in principle, it has never been demonstrated experi- mentally to be relevant. One important general aspect of this paper may be that it does furnish this experimental demonstration. That calculations were necessary to show this should not detract from the point that the proof comes from our experimental results; the calculations were just a tool for the interpretation of the data; no modelling was involved.
A C K N O W L E D G E M E N T S
supercoiling
We wish to thank Jan Schouten (MRC, Holland) for supplying us with purified topoisomerase I for the preparation of antibodies. This study was supported by the Netherlands Organization for Scientific Research (NWO), the Association of Netherlands Biotechnological Research Schools (ABON), the Danish Natural Research Council (SNF) and the Danish Centre for Microbiology (CM).
R E F E R E N C E S
1. Pettijohn, D.E. & Pfenninger, O. (1980) Supercoils in prokaryotic DNA restrained in vivo. Proc. Natl Acad. Sci. USA 83, 8952–8956. 2. Wang, J.C. (1996) DNA topoisomerases. Annu. Rev. Biochem. 65,
635–692.
3. Masse, E. & Drolet, M. (1999) Relaxation of transcription- induced negative supercoiling is an essential function of Escher- ichia coli DNA topoisomerase I. J. Biol. Chem. 274, 16654–16658. 4. Masse, E. & Drolet, M. (1999) Escherichia coli DNA topoisome- rase I inhibits R-loop formation by relaxing transcription-induced negative supercoiling. J. Biol. Chem. 274, 16659–16664.
5. Zechiedrich, E.L., Khodursky, A.B., Bachellier, S., Schneider, R., Chen, D., Lilley, D.M.J. & Cozzarelli, N.R. (2000) Roles of top- oisomerases in maintaining steady state DNA supercoiling in Escherichia coli. J. Biol. Chem. 275, 8103–8113.
6. Menzel, R. & Gellert, M. (1983) Regulation of the genes for E. coli DNA gyrase: homeostatic control of DNA supercoiling. Cell 34, 105–113.
7. Wang, J.C. (1971) Interaction between DNA and an Escherichia
coli protein omega. J. Mol. Biol. 55, 523–533.
8. Sugino, A. & Cozzarelli, N.R. (1980) The intrinsic ATPase of
DNA gyrase, J Biol Chem. 255, 6299–6306.
9. Tse-Dinh, Y.C. (1985) Regulation of Escherichia coli DNA top- oisomerase I gene by DNA supercoiling. Nucleic Acids Res. 13, 4751–4763.
Several of the findings of this paper are consistent with existing information. Here we determined the concentra- tions of gyrase and topoisomerase I to calculate the sensitivity of the transcription/translation level for changes in DNA supercoiling. In an previous study [11] we used a lacZ fusion to the gyrB promoter to measure this sensitivity for DNA gyrase. The elasticity of gyrase expression measured with the lacZ fusion eDNAgyrase expression (cid:136) (cid:255)1:7 in that paper is in good agreement with the elasticity determined via gyrase concentration measurements here, i.e. )1.6. In other studies in which the sensitivity of expression of DNA gyrase or topoisomerase I was measured using promoter fusion, always large perturbations in DNA supercoiling were made [9,27]. As can been seen from Figs 3 and 4 the sensitivity of gene expression to supercoil- ing does depend on the level of supercoiling, especially for the topoisomerase I, which is almost insensitive at wild-type levels of supercoiling and much more sensitive at high levels of supercoiling. One can compare the results of these earlier studies with ours by extrapolating our results to larger changes in supercoiling. Fusion of the gyrB promoter to the galactokinase gene showed a two to three fold increase upon inhibition of gyrase with coumermycin [27]. Our results are in good agreement with this: Extrapolation of our fits in Fig. 3 to an aLk of 0 (corresponding to coumermycin inhibition) indicates a 2.8-fold induction. Fusion of the topA promoters to the galactokinase gene showed a twofold to fourfold inhibition of expression upon addition of gyrase inhibitors [9]. With our DNA gyrase modulatable strain we did not observe a strong effect upon decreasing the level of supercoiling below the wild-type level. Rather at higher levels of supercoiling an induction of topoisomerase I was observed. Perhaps topoisomerase I expression becomes more sensitive for supercoiling when the DNA relaxes more than was tested in our strains. In the earlier studies the
(cid:211) FEBS 2002
Control of DNA supercoiling by topoisomerase I (Eur. J. Biochem. 269) 1669
in
supercoiling depends on the phosphorylation potential Escherichia coli. Mol. Microbiol. 20, 351–360.
10. Franco, R.J. & Drlica, K. (1989) Gyrase inhibitors can increase gyrA expression and DNA supercoiling. J. Bacteriol. 171, 6573– 6579.
19. Jensen, P.R., Westerho(cid:128), H.V. & Michelsen, O. (1993) The use of lac-type promoters in control analysis. Eur. J. Biochem. 211, 181–191.
20. Kacser, H. & Burns, J.A. (1973) The control of flux. In Rate Control of Biological Processes (Davies, D.D., ed), pp. 65–104. Cambridge University Press, London, UK.
11. Jensen, P.R., van der Weijden, C.C., Jensen, L.B., Westerho(cid:128), H.V. & Snoep, J.L. (1999) Extensive regulation compromises the extent to which DNA gyrase controls DNA supercoiling and growth rate of Escherichia coli. Eur. J. Biochem. 266, 865– 877.
21. Heinrich, R. & Rapoport, T.A. (1974) A linear steady-state treatment of enzymatic chains. General properties, control and e(cid:128)ector strength. Eur. J. Biochem. 42, 89–95.
12. Yanish-Perron, C., Vieira, J. & Messing, J. (1985) Improved M13 phage cloning vectors and host strains: nucleotide sequences of the M13mp18 and pUC19 vectors. Gene 33, 103–109.
22. Westerho(cid:128), H.V. & van Dam, K. (1987) Thermodynamics and Control. of Biological Free Energy Transduction. Elsevier, Amsterdam, the Netherlands.
23. Drlica, K. (1992) Control of bacterial DNA supercoiling. Mol.
Microbiol. 6, 425–433.
13. Woodcock, D.M., Crowther, P.J., Doherty, J., Je(cid:128)erson, S., DeCruz, E., Noyer-Weidner, M., Smith, S.S., Michael, M.Z. & Graham, M.W. (1989) Quantitative evaluation of Escherichia coli host strains for tolerance to cytosine methylation in plasmid and phage recombinants. Nucleic Acids Res. 17, 3469–3478.
24. Westerho(cid:128), H.V., O’Dea, M.H., Maxwell, A. & Gellert, M. (1988) DNA supercoiling by DNA gyrase. A static head analysis. Cell Biophys. 12, 157–181.
14. Casabadan, M.J. & Cohen, S.N. (1980) Analysis of gene control signals by DNA fusion and cloning in Escherichia coli. J. Mol. Biol. 138, 179–207.
15. Neidhardt, F.C., Bloch, P.L. & Smith, D.F. (1974) Culture me-
dium for Enterobacteria. J. Bacteriol. 119, 736–747.
25. Westerho(cid:128), H.V., Jensen, P.R., Snoep, J.L. & Kholodenko, B.N. (1998) Thermodynamics of complexity – the live cell. Thermo- chimica Acta. 309, 111–120.
16. Jensen, P.R., Westerho(cid:128), H.V. & Michelsen, O. (1993) Excess in capacity of H+-ATPase and inverse respiratory control Escherichia coli. EMBO J. 12, 1277–1282.
26. Hofmeyr, J.H.S.H. & Westerho(cid:128), H.V. (2001) Building the cel- lular puzzle. Control in multi-level reaction networks. J. Theor. Biol. 208, 261–285.
17. Jensen, P.R. & Michelsen, O. (1992) Carbon and energy meta- bolism of atp mutants of Escherichia coli. J. Bacteriol. 174, 7635– 7641.
27. Menzel, R. & Gellert, M. (1987) Fusions of the Escherichia coli gyrA and gyrB control regions to the galactokinase gene are inducible by coumermycin treatment. J. Bacteriol. 169, 1272–1278.
18. Van Workum, M., Van Dooren, S., Oldenburg, N., Molenaar, D., Jensen, P.R., Snoep, J.L. & Westerho(cid:128), H.V. (1996) DNA