
REGULAR ARTICLE
Gamma ray transport simulations using SGaRD code
Philippe Humbert
*
and Boukhmès Méchitoua
CEA DAM Ile-de-France, Bruyères-le-Châtel, 91297 Arpajon cedex, France
Received: 18 November 2016 / Received in final form: 7 February 2017 / Accepted: 15 February 2017
Abstract. SGaRD (Spectroscopy, Gamma rays, Rapid, Deterministic) code is used for the fast calculation of
the gamma-ray spectrum, produced by a spherical shielded source and measured by a detector. The photon
source lines originate from the radioactive decay of the unstable isotopes. The leakage spectrum is separated in
two parts: the uncollided component is transported by ray tracing, and the scattered component is calculated
using a multigroup discrete ordinates method. The pulse height spectrum is then simulated by folding the
leakage spectrum with the detector response function, which is precalculated for each considered detector type.
An application to the simulation of the gamma spectrum produced by a natural uranium ball coated with
plexiglass and measured using a NaI detector is presented. The SGaRD code is also used to infer the dimensions
of a one-dimensional model of a shielded gamma ray source. The method is based on the simulation of the
uncollided leakage current of discrete gamma lines that are produced by nuclear decay. The material thicknesses
are computed with SGaRD using a fast ray-tracing algorithm embedded in a nonlinear multidimensional
iterative optimization procedure that minimizes the error metric between calculated and measured signatures.
1 Introduction
Real-time applications require fast and accurate calculation
of the detected gamma-ray spectra produced by shielded
sources. For this purpose, the SGaRD (Spectroscopy, Gamma
rays, Rapid, Deterministic) code [1] that was used to calculate
the leakage spectra of one-dimensional spherical assemblies
has been updated in order to take into account the response
function of various types of detectors and for the identifica-
tion of gamma-shielded sources geometric characteristics.
SGaRD has two different transport solvers. The first
one is a multigroup discrete ordinates S
N
solver [2] for the
integro-differential transport equation in one-dimensional
spherical geometries using the spherical coordinates (r,m).
The second one is a “Method of Characteristics”or ray-
tracing solver [2] for the integral transport equation along
straight lines through the spherical geometry. The first
solver noted S
N
in the following is used to calculate the
scattered component of the gamma leakage, and the second
component is used to calculate the uncollided leakage of
gamma lines.
In the first part, we recall the methods used in SGaRD to
calculate the leakage spectra. We describethe precalculation
of detector response functions (DRFs) using the Monte Carlo
code MCNP5 [3], and we show some numerical results
concerning the simulation of a natural uranium ball coated
with plexiglass and measured using a NaI detector.
In the second part, we present the identification of
nuclear radiation-source characteristics, which is a subject of
interest for nonproliferation and nuclear safeguard applica-
tions. Gamma spectroscopy is used because of the sensitivity
of these measurements to source isotopic composition and
shielding materials properties. The determination of source
characteristics using known signature measurements is an
inverse transport problem. This subject has been studied by
different authors (see for example [4–8]). In this paper,
we present the determination of the unknown material
interface positions from the measured uncollided gamma line
spectrum obtained by processing high-precision gamma
spectroscopy measurements. For this purpose, SGaRD code
is used as a forward solver for iterative inverse transport
calculations. The material thicknesses are computed using a
nonlinear multidimensional iterative optimization algo-
rithm that minimizes the error metric between calculated
and measured signatures. The optimization is performed
using the gradient-free Powell method [9,10]. For verifica-
tion, numerical results are presented. A synthetic gamma
lines spectrum is used as input to the inverse transport solver,
and the obtained geometry is compared to the original one.
2 Pulse height spectra simulation
2.1 Gamma-ray spectra
The gamma-ray spectrum simulation is the result of
successive steps. The first step is the computation of the
primary gamma source emission rate and spectrum.
* e-mail: philippe.humbert@cea.fr
EPJ Nuclear Sci. Technol. 3, 9 (2017)
©P. Humbert and B. Méchitoua, published by EDP Sciences, 2017
DOI: 10.1051/epjn/2017006
Nuclear
Sciences
& Technologies
Available online at:
http://www.epj-n.org
This is an Open Access article distributed under the terms of the Creative Commons Attribution License (http://creativecommons.org/licenses/by/4.0),
which permits unrestricted use, distribution, and reproduction in any medium, provided the original work is properly cited.
The second step is the photon transport through the
shielding materials up to the external surface of the
detector in order to derive the leakage spectrum. The third
step is the photon transport into the detector used to
evaluate the distribution of the photon energy deposited
inside the detector's sensitive volume.
When the source can be modeled as a set of concentric
one-dimensional spherical shells, the second step can
be handled very effectively using deterministic solvers
[1,4]. The first and third steps can be performed using
precalculated sources and DRF.
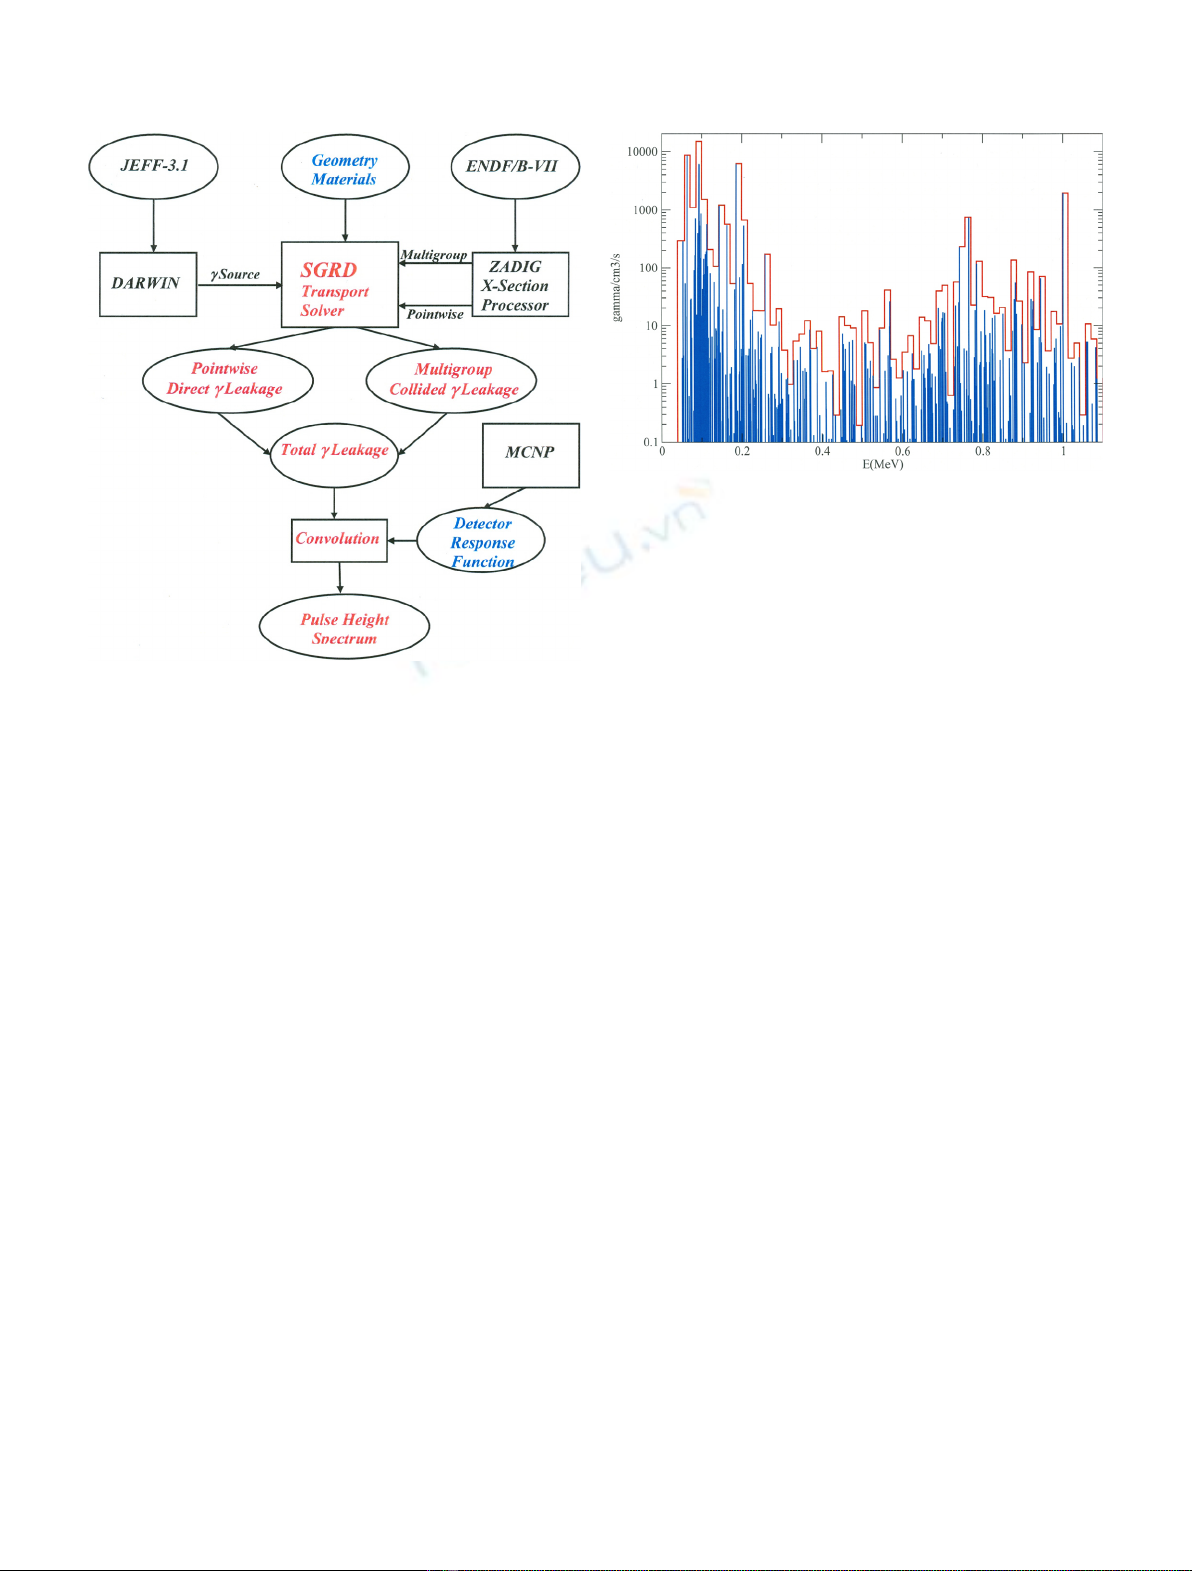
The SGaRD input/output flow diagram for gamma
spectra simulation is presented in Figure 1.
2.1.1 Primary source
The primary photon source has several components: the
gamma lines due to the radioactive decay of unstable
isotopes, the gamma resulting from spontaneous fission,
the bremsstrahlung radiation produced by charged par-
ticles slowing down and the neutron-induced gamma
production.
The radioactive decay source line spectrum and
emission rate are precalculated using DARWIN code
[11]. The treatment with SGaRD of the other components
of the primary source terms are under study. The
contribution of these components may not be negligible.
In particular, the continuum spectrum in depleted
uranium is dominated by the bremsstrahlung radiations
asshownin[4]. This component will be included in
SGaRD for future comparisons with measured gamma
spectra.
2.1.2 Leakage spectra
The leakage Lis the number of particles leaving the
external surface of the source per unit time and solid angle.
L¼∫
~
r∈∂X
d2r∫
~
n~
V≥0
d2Vð~
n~
VÞcð~
r;~
V;EÞ:ð1Þ
The angular flux cð
~
r;~
V;EÞis solution of the transport
equation. It has a discrete energy part due to the uncollided
transport of gamma lines and a continuous part due to the
scattering. The discrete component is calculated using a
1-D ray-tracing transport solver, presented in Section 3.1.2.
The continuous component is transported using a 1-D
multigroup discrete ordinates (S
N
) solver.
The flux computation is performed using three
transport calculations.
The first step is the uncollided transport of each source
line with energy Eusing the ray-tracing algorithm with
typically N= 64 directions.
~
V~
∇cUNCðE;~
VÞþsTðEÞcUNCðE;~
VÞ¼qðEÞ:ð2Þ
The second step is the total multigroup S
N
transport
taking into account the scattering term. The multigroup
calculations are performed using the conventional discrete
ordinates method in spherical curvilinear coordinates with
Legendre polynomial expansion of the scattering source.
The angular quadrature is an evenly spaced discretization
of the direction cosine m(equiweight quadrature), and
the number of directions is typically N= 16.
~
V~
∇cTOT
gþsT
gcTOT
g¼
X
G
g0¼1
∫sg0gð~
V0~
VÞcTOT
g0ð~
V0ÞdV0þqg:ð3Þ
The multigroup source is obtained by condensing the
gamma lines into groups (cf. Fig. 2). Thesource intensity in a
givengroup is equal to the sum of theintensitiesof all thelines
whose energies are included in the group energy boundaries.
Fig. 1. SGaRD input/output flow diagram for gamma spectra
calculation.
Fig. 2. Gamma source lines (blue) are condensed into groups
(red) for multigroup S
N
calculations.
2 P. Humbert and B. Méchitoua: EPJ Nuclear Sci. Technol. 3, 9 (2017)
The third step is the uncollided multigroup S
N
transport of the multigroup source.
~
V~
∇cUNC
gþsT
gcUNC
g¼qg:ð4Þ
The scattered component is given by subtracting the
uncollided multigroup flux to the total multigroup flux.
cCOL
g¼cTOT
gcUNC
g:ð5Þ
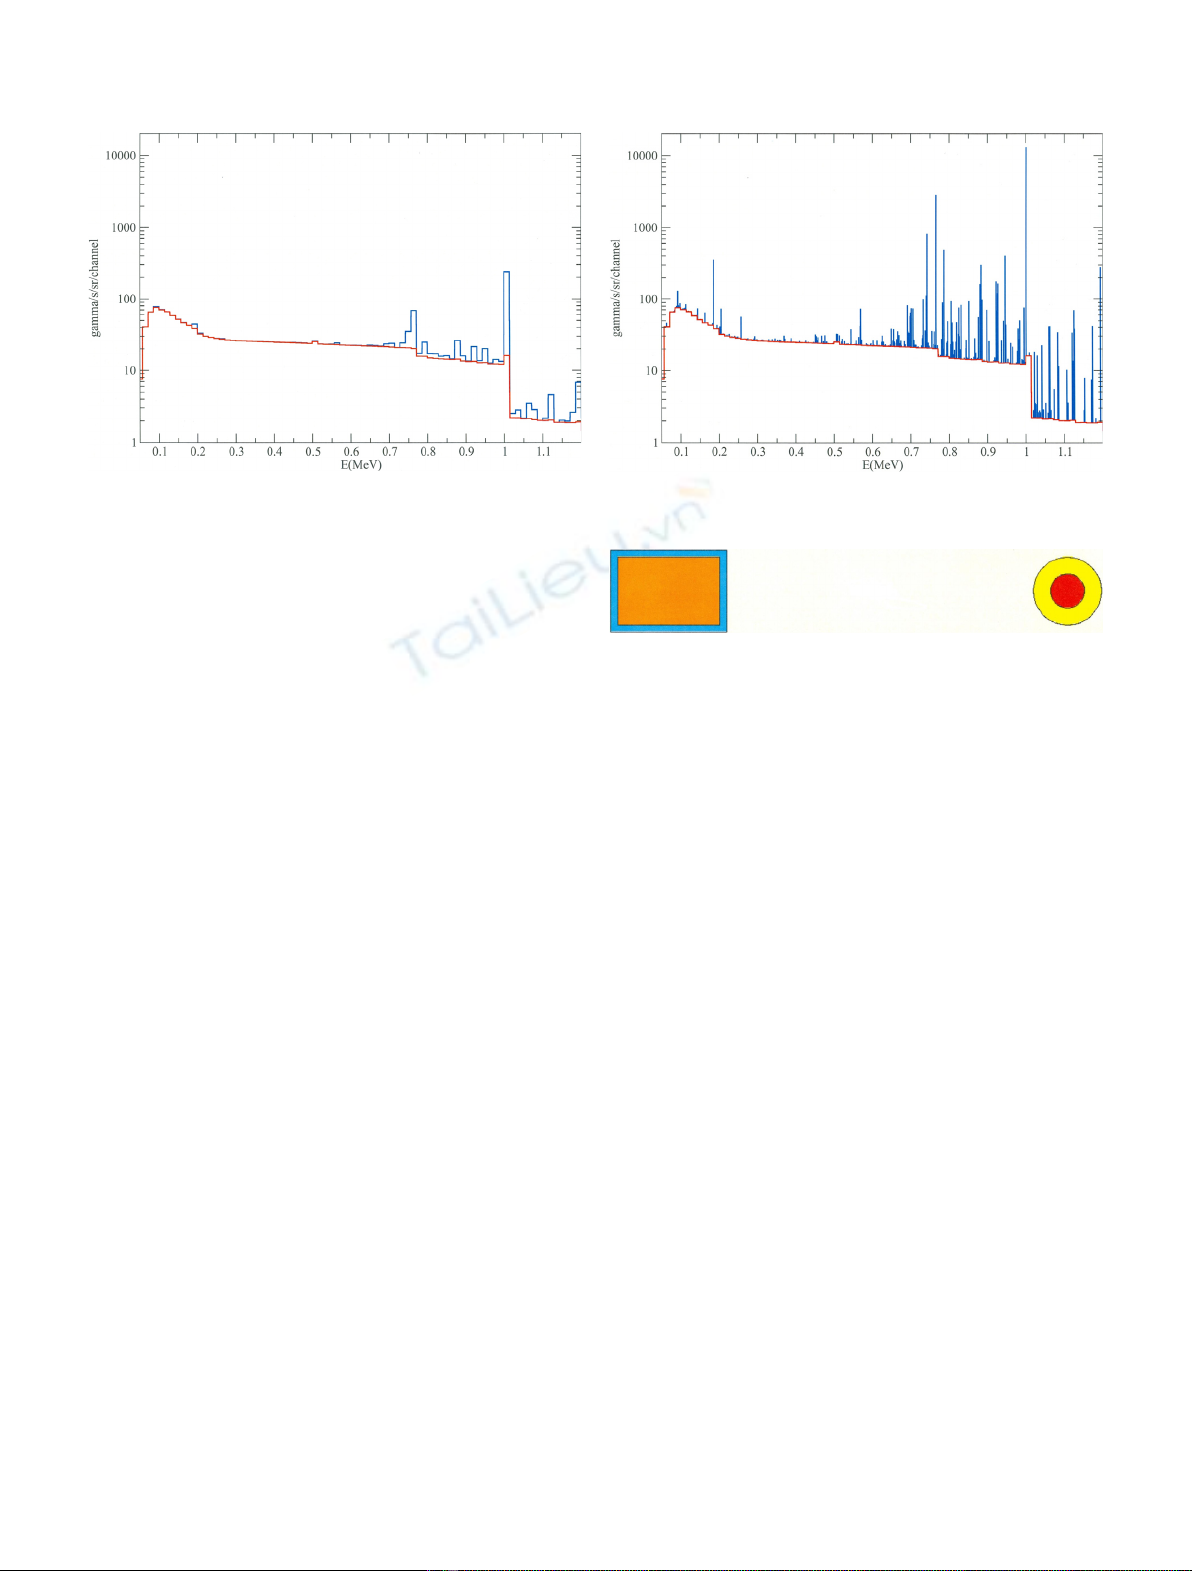
In Figure 3, the uncollided part has been added to the
scattered background to produce the total multigroup
leakage. The blue/red curve is the total leakage. The blue
part of the curve is the contribution of the uncollided
leakage, which has been added to the scattered background
in red.
Finally, the total leakage spectrum is the superposition
of the discrete uncollided and multigroup scattered
components on a very fine multigroup grid (cf. Fig. 4).
2.1.3 Detector response function
The DRF is used to convert the leakage spectrum into
a pulse height spectrum using equation (6) assuming that
the pulse height and leakage spectra have the same energy
discretization into nchannels.
Notations
–Dt: Duration of the measurement.
–DV: Solid angle of the detector viewed from the center of
the source.
–L
j
: Leakage spectrum = number of gamma particles
leaving the source with energy in channel jper unit
time and solid angle.
–N
i
: Pulse height spectrum = number of counts in channel i.
–R
ij
: Detector response matrix = number of counts in
channel idue to one gamma entering the detector with
energy in channel j.
Ni¼DVDtX
n
i¼1
RijLj:ð6Þ
The response matrix is obtained by Monte Carlo
simulations of the energy deposition within the detector
using the same methodology as in [12]. A set of gamma ray
incident energies E
j
is chosen. For each of these energies,
the detector response to a parallel beam normal to the
detector is calculated using MCNP5. The DRF for a given
energy channel is obtained by linear interpolation between
the two nearest calculated responses.
The experimental spectra have a Gaussian distribution
shape for the photons energy lines. We take this effect into
account by modifying the MCNP5 simulation results. We
use a fitting technique to approximate the resolution of
the detector which is an experimentally measured data.
With MCNP5, we use an “FT8 Gaussian Energy
Broadening”card in order to simulate the full width at half
maximum (FWHM) around the peak.
The response matrix can then be used in conjunction
with the SGaRD 1-D leakage using equation (6) to
determine the number of counts in each detector channel.
An example of NaI DRFs calculated with MCNP5 is
presented in Figure 7.
2.2 Application to a scintillation NaI detector
As an example, we present the simulation of a pulse
height spectra obtained with a scintillation sodium
iodide detector and a spherical source made of a natural
uranium ball surrounded by a plexiglass shell as shown
in Figure 5.
The example geometry is detailed in Table 1. The
distance between the center of the source and the detector
is 10 cm. Even if this geometry is two-dimensional, SGaRD
calculations stay one-dimensional because the detector
is taken into account by using the precalculated DRF.
Fig. 3. Multigroup S
N
leakage spectra for both scattered
background (red) and uncollided component (blue).
Fig. 4. Discrete uncollided lines (blue) with multigroup
scattered background (red).
Fig. 5. Detector and source geometry.
P. Humbert and B. Méchitoua: EPJ Nuclear Sci. Technol. 3, 9 (2017) 3
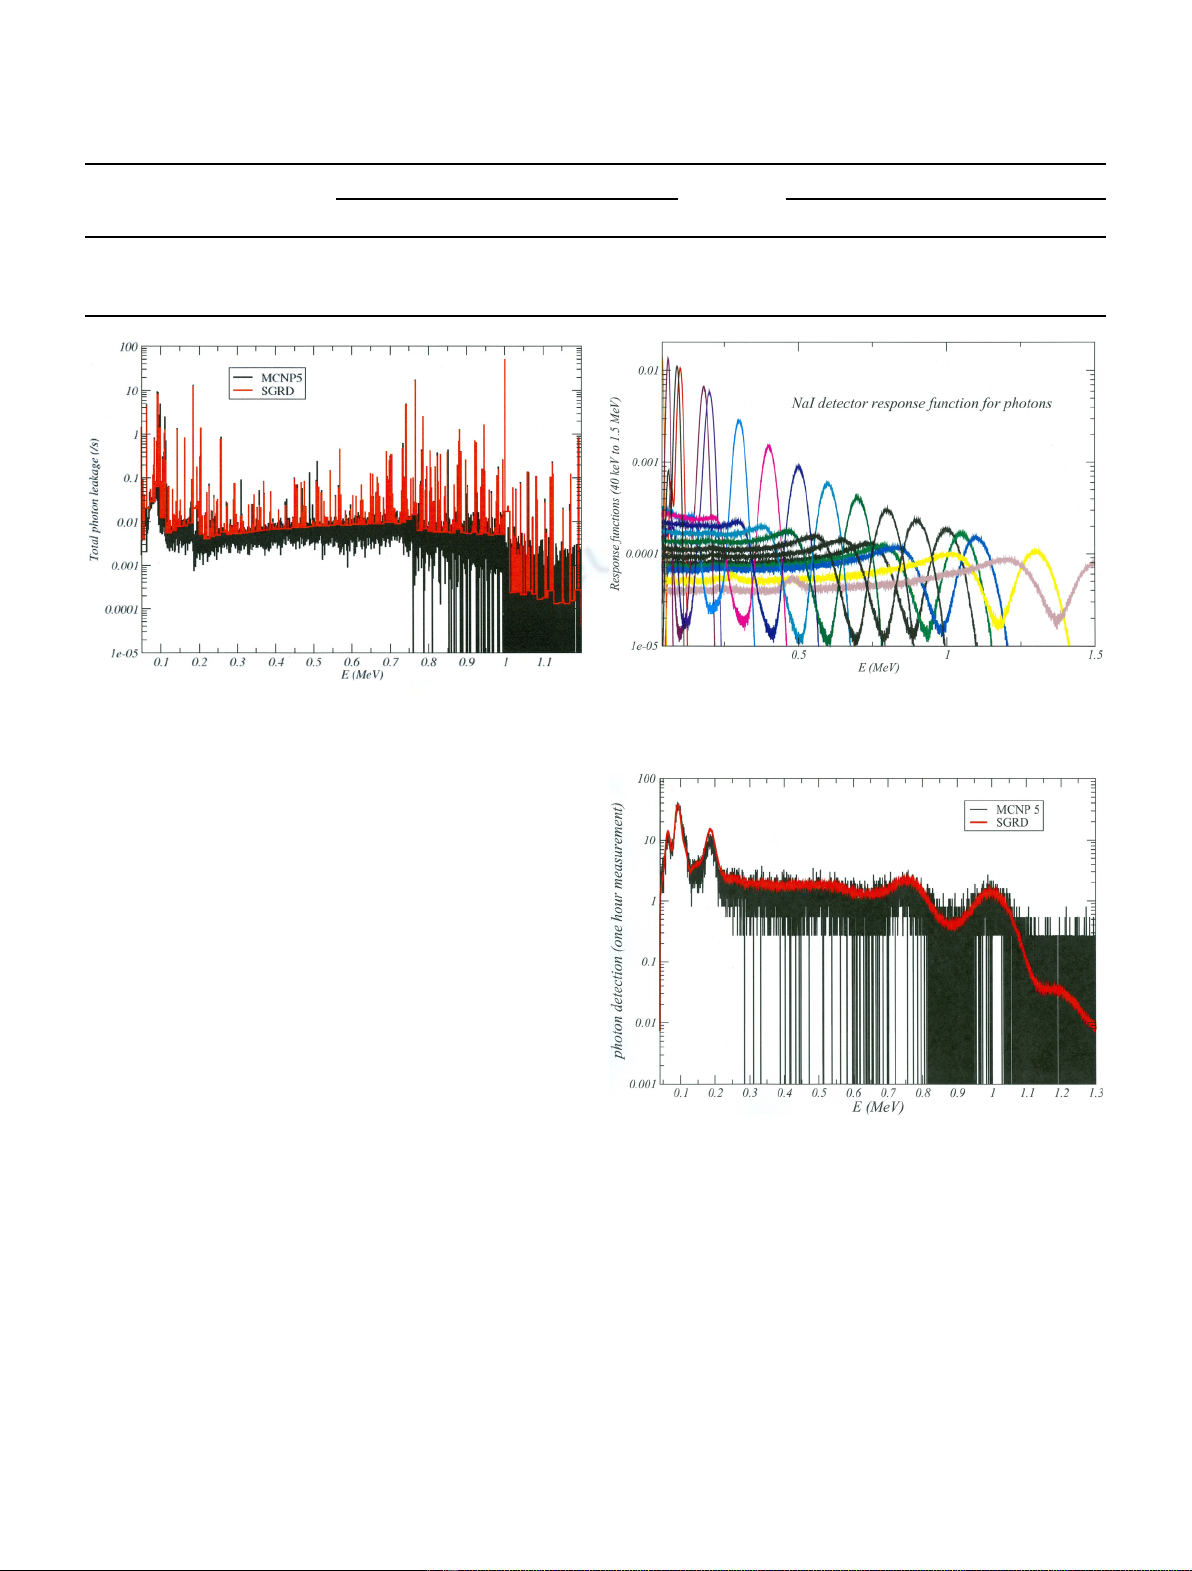
The leakage spectrum of gamma particles leaving the
source is calculated using SGaRD. As shown in Figure 6,
there is a good agreement with the corresponding MCNP5
calculation.
The pulse height spectrum is obtained by folding the
SGaRD leakage spectrum with the DRF calculated with
MCNP5 using the pulse height tally and Gaussian
broadening to take into account the detector resolution.
As explained in [12], a nonlinear function is applied to
estimate the values of the triplet (a,b,c) used to fit the
FWHM in function of the photon energy.
Let FWHM ¼aþbffiffiffiffiffiffiffiffiffiffiffiffiffiffiffiffiffiffi
EþcE2
pwhere Eis the incident
gamma rays energy in MeV, and a,band care constants
derived from FWHM measurements.
The triplet used is: (a, b, c)=(0.002, 0.05, 2.86).
These values are typical of a NaI detector and are close to
those given in [12]. A set of response functions is presented
in Figure 7 for different incident energy of the gamma
particles entering the NaI detector. The incident energy
range is between 40 keV and 1.5 MeV, and the energy
intervals extend from 50 keV at low energy up to a few
100 keV above 1 MeV. The DRFs which are between two
calculated ones are interpolated.
For verification purpose, the same calculation was
performed using MCNP5 only. The bremsstrahlung
gamma source is not simulated in the MCNP simulation
in order to stay consistent with the SGaRD calculation.
Both spectra are presented in Figure 8. They show a
very good agreement, although the SGaRD calculation is
much faster and less prone to statistical artifacts. The
computer time for SGaRD is of several seconds compared
to 1 h for the MCNP simulation with 10
9
particles studied.
3 Material thickness identification
The identification of the source geometrical characteristics
is performed by inverse transport using an optimization
method which iterates on the ray-tracing simulations of
the gamma lines leakage.
3.1 Uncollided leakage gamma current calculation
3.1.1 Gamma leakage
The observable is the uncollided gamma ray leakage line
spectrum, produced by the radioactive decay gamma
source.
Fig. 7. Scintillation NaI detector response functions. The
different colors correspond to different incident energies of the
gamma particles entering the detector.
Table 1. Example specification.
Materials Source Detector
Natural uranium Plexiglass NaI Aluminum
Density (g/cm
3
) 18.9 1.2 3.7 2.7
Dim. (cm) R= 0.5017 R= 1.0 R= 1.0
H= 3.0
Thickness 0.2 cm
Fig. 6. Source leakage spectra calculated using MCNP5 and
SGaRD.
Fig. 8. Pulse height spectra calculated using MCNP5 and SGaRD.
4 P. Humbert and B. Méchitoua: EPJ Nuclear Sci. Technol. 3, 9 (2017)
The number Lof gamma particles leaving a sphere of
radius Rper unit time and solid angle without collision is
calculated using the uncollided angular flux c(R,m).
L¼2pR2∫1
0mcðR;mÞdm:ð7Þ
3.1.2 Ray tracing
The direct flux is solution of the transport equation without
scattering. It is solved by SGaRD code using an accurate
and fast ray-tracing method, also called Method of
Characteristics (MoC [2]). When the source is a step
function as in our application, this method gives the exact
solution of the integral transport equation along discrete
directions.
The shielded source is made of concentric spherical
shells, each with a constant source intensity Q
i
and total
macroscopic cross section s
i
. The outgoing flux at the
external surface boundary is discretized in Ndirections.
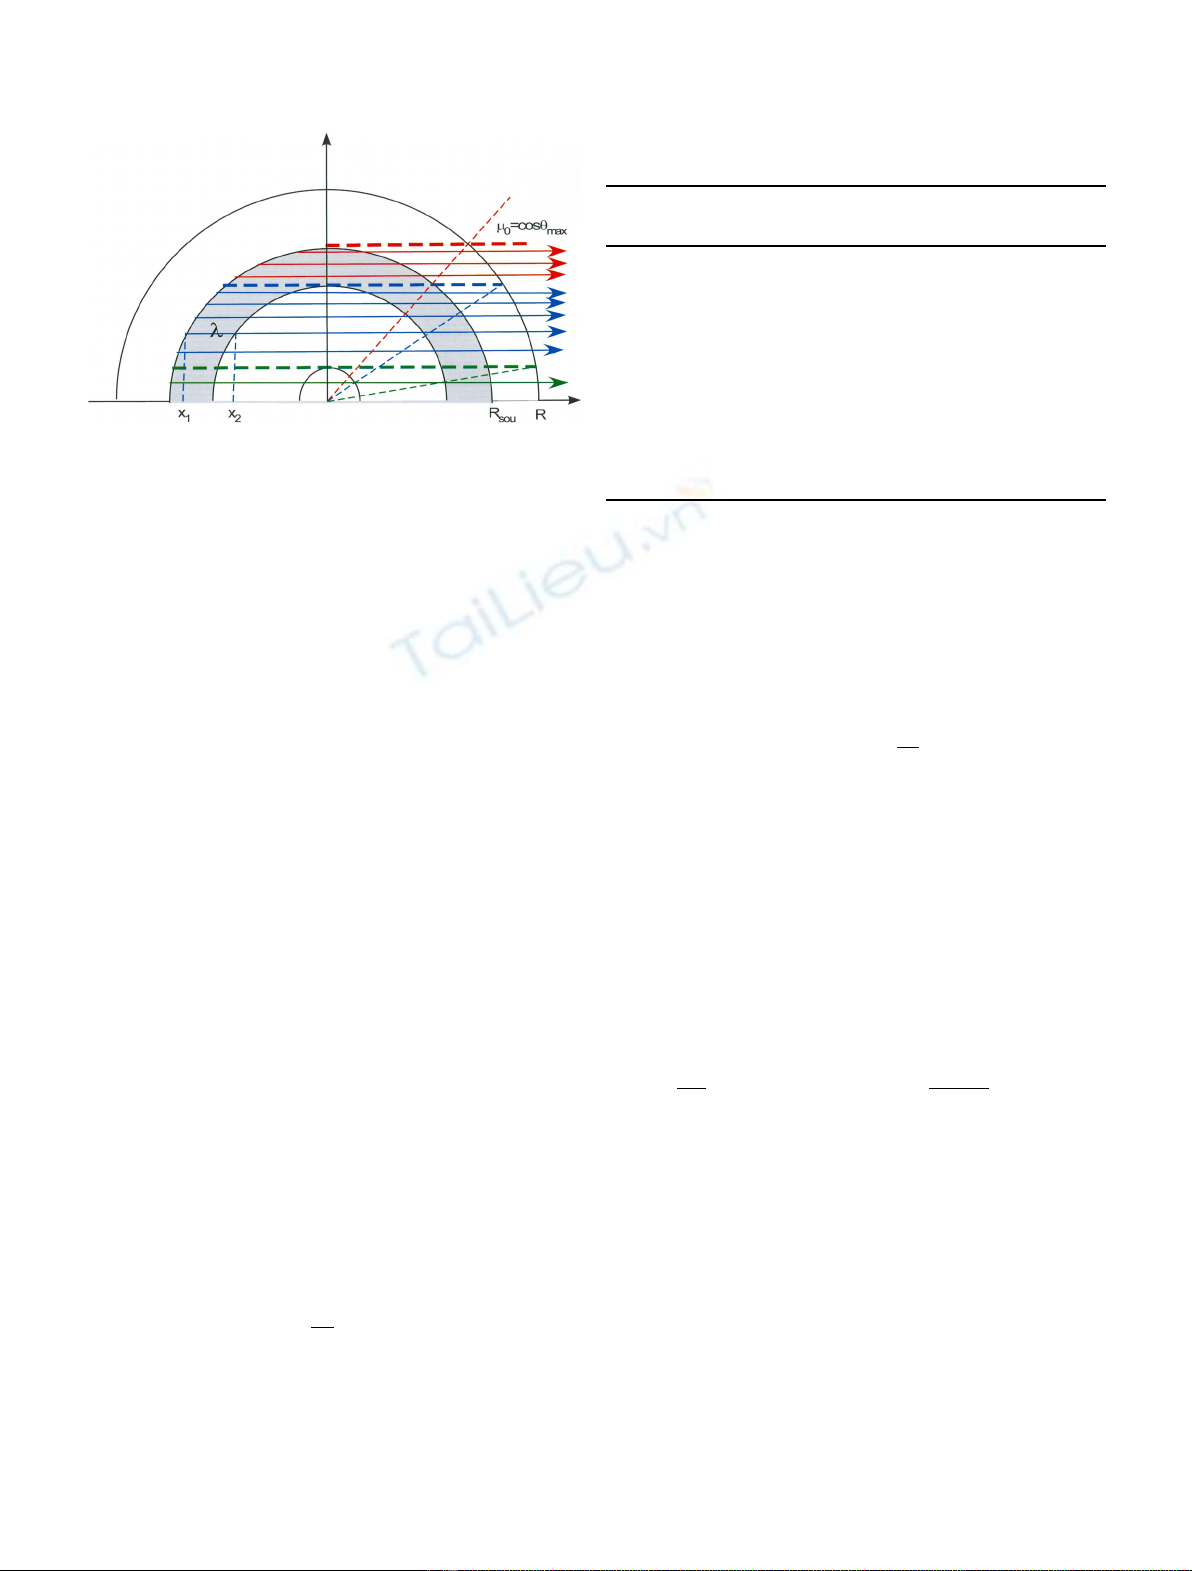
The angular discretization is illustrated in Figure 9. A set of
N
i
characteristic rays is associated to each shell, from the
most internal (i= 1) to the most external shell with a
nonnull source (i=I).
In Figure 9, the lines are the boundaries of the angular
discretization. The arrows show the directions of neutron
travel. The dotted lines are the upper angular boundaries
associated with each material shell. There is a different
color for each material shell. The gsource is in the shaded
shell. The direction of flight of the rays is characterized by
the cosine of the angle ubetween this direction and the
spatial radial vector on the external surface with radius R.
The maximum value of ucorresponding to a nonzero
outgoing flux is u
max
.
The unscattered leakage is given by
L¼2pR2X
I
i¼1
mi
NiX
Ni
j¼1
mijcðR;mijÞ;ð8Þ
where m
ij
characterizes the direction of flight associated
with the jth ray crossing the ith shell.
m
i
is the cosine associated with the upper boundary of
shell iand Dm
i
=m
i
m
i1
.
Each shell is evenly discretized, and the rays within a
given shell have the same weight. The number of rays in
a shell is proportional to its thickness with at least one
ray by shell.
The angular flux cis calculated using the following
transmission equation, taking into account a constant
source approximation:
cðxiþ1Þ¼cðxiÞesiliþQi
si
ð1esiliÞ:ð9Þ
The l
i
are the intersection lengths of the characteristics
with the spherical shells.
li¼xiþ1xiwith xi¼ffiffiffiffiffiffiffiffiffiffiffiffiffiffiffiffiffiffiffiffiffiffiffiffiffiffiffiffiffiffiffiffiffiffiffi
R2
iR2ð1m2Þ
q:ð10Þ
3.1.3 Validation
The particle leakage from a homogeneous spherical source
of radius R, opacity sand intensity Qhas an analytic
expression [13].
L¼Q
8s3ð1þ2sRÞexpð2sRÞþð2sRÞ2
21
"#
:ð11Þ
The convergence of the ray-tracing algorithm with the
number of directions is compared to the discrete ordinates
S
N
method in Table 2. The calculations use the following
values: R= 5 cm, s= 1.484673 cm
1
and Q= 1948.531
cm
3
/s.
The discrete ordinates S
N
and ray-tracing calculations
are both performed using SGaRD. The S
N
solver is a one-
dimensional spherical finite difference solver, using an
equiweight angular quadrature and a 100-cell spatial
discretization. Considering the ray tracing, there is no
spatial discretization; one spherical shell is associated with
each material region.
As shown in Table 2 and Figure 10, the ray-tracing
method is faster and more accurate than the S
N
discrete
ordinates for unscattered transport.
Fig. 9. 1-D spherical ray tracing. The gsource is in the shaded
shell.
Table 2. Convergence of the ray-tracing and S
N
solvers
with the number of directions.
Number of
directions
S
N
leakage
(100 cells)
Ray-tracing
leakage
8 8188.1891 8120.3737
16 8142.4987 8125.7923
32 8131.6601 8127.6136
64 8129.0541 8128.1026
128 8128.4142 8128.2270
256 8128.2552 8128.2583
512 8128.2155 8128.2661
1024 8128.2056 8128.2680
Analytic 8128.2679
P. Humbert and B. Méchitoua: EPJ Nuclear Sci. Technol. 3, 9 (2017) 5


![Ngân hàng trắc nghiệm Kỹ thuật lạnh ứng dụng: Đề cương [chuẩn nhất]](https://cdn.tailieu.vn/images/document/thumbnail/2025/20251007/kimphuong1001/135x160/25391759827353.jpg)