INTERNAL MEDECINE JOURNAL OF VIETNAM|NO 22/2021
13
CLINICAL RESEARCH
CONCENTRATIONS OF GLUCAGON-LIKE PEPTIDE-1
(GLP-1) IN NEWLY-DIAGNOSED TYPE 2 DIABETES
MELLITUS PATIENTS WITH OVERWEIGHT OR OBESITY
Le Dinh Tuan1, Nguyen Thi Phi Nga2, Nguyen Thi Tam3, Nguyen Tien Son2
Tran Thi Thanh Hoa3, Nguyen Thi Ho Lan3, Ngo Van Manh1, Le Duc Cuong1
Nguyen Thi Hien1, Vu Thanh Binh1, Nguyen Trung Kien1
1Thai Binh University of Medicine and Pharmacy, Thai Binh, Vietnam
2Military Hospital 103, Vietnam Military Medical University
3National Hospital of Endocrinology
ABSTRACT
Objectives: To survey fasting plasma glucagon-like peptide-1 concentrations in newly-diagnosed type 2
diabetes mellitus patients having overweight or obese status. Subjects and methods: A cross-sectional
descriptive study on 92 subjects, divided into 3 groups. Group 1 included 32 newly-diagnosed diabetic
patients with overweight or obese comorbidity (nDM with OB). Group 2 included 30 newly-diagnosed
diabetic patients without overweight or obese comorbidity (nDM with non-OB). The third group is the
control group consisting of 30 healthy individuals at the National Hospital of Endocrinology. GLP-1 hormone
was quantified by ELISA at Biomedical and Pharmaceutical Research and Application Center - Vietnam
Military Medical University. Result: The concentration of GLP-1 in the group of nDM with OB was 24.98 ±
10.36 pg/mL which was statistically significantly lower than the group of nDM with non-OB [32.15 ± 11.22
pg/mL] and control group [49.74 ± 18.24 pg/mL; p < 0.001]. The proportion of patients with decreased GLP-1
levels in the group of nDM with OB was higher than that in the group of nDM with non-OB and the control
group (71.9% vs 66.7% and 23.3%, respectively, p < 0.001). The mean concentration of GLP-1 in nDM with OB
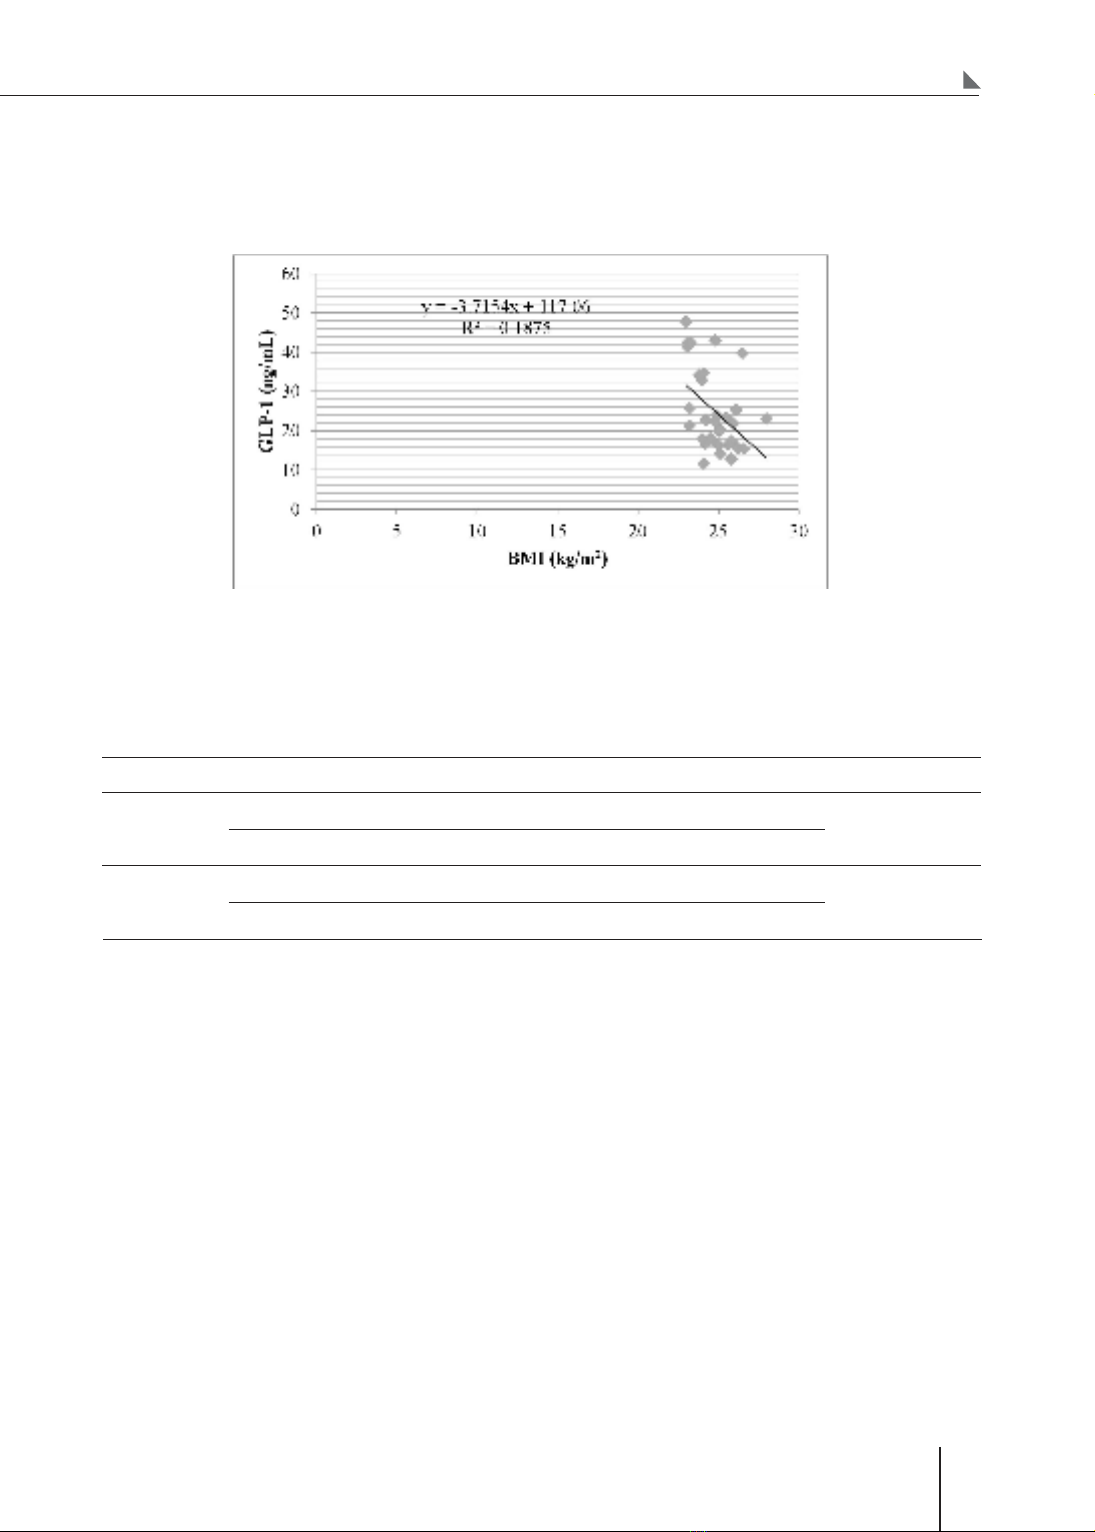
who were central was lower than that in male patients without central obesity (p < 0.05). There is a moderate
negative correlation between GLP-1 concentration and BMI (r = - 0.433; p < 0.05). The mean concentration
of GLP-1 in the male group of nDM with OB was statistically significantly higher than that of the female
group (28.99 ± 12.01 vs. 21.44 ± 7.30 pg/mL, respectively, p < 0.05). Conclusion: In overweight or obese
diabetic patients, the average concentration of GLP-1 was lower, and the proportion of patients with a
decrease in GLP-1 concentration was significantly higher than that of diabetic patients without overweight
or obese comorbidity and of healthy individuals. There is a moderate negative correlation between GLP-1
concentration and BMI (r = -0.433; p < 0.05).
* Keywords: Newly-diagnosed type 2 diabetes; Glucagon-like peptide-1; Overweight or obesity.
Corresponding author: Nguyen Thi Phi Nga (ngabv103@yahoo.com.vn)
Date received: 10/5/2021
Date accepted: 01/6/2021
INTERNAL MEDECINE JOURNAL OF VIETNAM|NO 22/2021
14
CLINICAL RESEARCH
INTRODUCTION
Research studies and clinical practices have shown
that oral glucose stimulates insulin secretion more
than intravenous glucose infusion at the same
dose. This difference is due to the role of incretin
[4]. Incretins are peptide hormones, including
glucagon-like peptide-1 (GLP-1) and glucose-
dependent insulinotropic polypeptide. GLP-1 is
formed in the small intestine and colon, which
stimulates glucose-dependent insulin secretion
to reduce blood glucose. Studies have shown
that GLP-1 has many other beneficial effects,
such as stimulating the pancreas for regeneration
and proliferation, preventing β-cell apoptosis,
protecting the nervous system and heart, etc. [4,
5]. Obesity, especially abdominal obesity, is an
important risk factor for insulin resistance, which
causes metabolic disorders and diabetes.
According to the National Basic Survey of Nutrition
and Health in the United States, the prevalence of
diabetes in overweight people is 3.8 times higher
than in normal-weight subjects aged 45 - 75 [8].
Other global studies also show that the effect
of incretin decreases in overweight and obese
people, and this is also an important mechanism
in metabolic disorders in overweight and obese
people, including diabetes [5, 8]. In Vietnam,
although incretin therapy has been used clinically for
several years, the most commonly used medicines
are the ones with Dipeptidyl peptidase-4 inhibitors.
However, very few scholars have studied the GLP-
1 concentration. For patients with overweight and
obesity T2DM, especially first-time diagnosed
patients, how is GLP-1 concentration different from
that for the non-obese group? Attempting to answer
the question, we conducted this study: To analyze
and study fasting plasma glucagon-like peptide-1
concentrations in newly-diagnosed type 2 diabetes
mellitus patients with overweight or obese status.
SUBJECTS AND METHODS
1. Subjects
92 subjects, divided into 3 groups: 32 patients
with nDM with OB in the study group; 30 patients
with nDM with non-OB, with ages and sexes
equivalent to those of the study group; and 52
healthy individuals in the control group, with
ages and sexes equivalent to those of the study
group. These diabetes patients, who were at the
Outpatient Department or were treated at the
National Hospital of Endocrinology, have been
diagnosed with T2DM for the first time.
* Exclusion criteria:
- Diabetes mellitus group: Patients with T1DM, with
other underlying diseases (such as coma, heart
failure, etc.), patients with infectious diseases, with
pregnancy, with mental disorders, with cancer, and
alcohol addiction. Patients who had digestive surgery
and were being treated for digestive diseases, patients
who were being treated for diabetes. People who did
not want to participate in the study and people whose
information had not been fully collected.
- Healthy people: People who had gastrointestinal
surgery before, who were addicted to alcohol, who
were being treated for peptogaster diseases, who
were being treated for other acute diseases, who
had blood lipid disorders, hypertension, overweight,
and obesity. People who did not want to participate
in the study and people whose information had not
been fully collected.
2. Methods
* Study design: A prospective and cross-sectional
study and comparison with the control group.
Patients were taken by the cumulative method until
the sample size was sufficient.
All subjects were asked and went through a detailed
clinical examination, detection of risk factors
and complications of diabetes, laboratory tests,
functional exploration, and registration of research
records in accordance with the systematic form.
Comprehensive clinical examination: digestive,
cardiovascular, respiratory, urological, etc.
All patients had fasting blood samples quantitative:
triglyceride, cholesterol, HDL-C, LDL-C, glucose,
HbA1c, and GLP-1.
INTERNAL MEDECINE JOURNAL OF VIETNAM|NO 22/2021
15
CLINICAL RESEARCH
* Quantification of glucagon-like peptide-1:
- Principle: based on the specific reaction of the
antibody attached at the ELISA bottom and the
GLP-1 antigen in the patients’ serum, combined
with the color change of the specific substrate in
the ELISA reaction, and color measurement based
on a 450 nm wavelength spectrophotometer [4].
- Location: Biomedical and Pharmaceutical
Research and Application Center - Vietnam Military
Medical University.
- Implementation process: take a venous blood
sample 2 times and put them into the EDTA test
tubes (containing DDP-4 inhibitor). The first time
is taken after fasting; the patient has to fast for at
least 8 hours (overnight). The second time is taken
after 2 hours of taking 75 grams of glucose. Then,
the test tube is centrifugally and well shaken to
separate the serum. Finally, an ELISA reaction is
carried out. The calculation unit is ng/mL.
- Result assessment: based on the values of the
quartiles of the control group: Increase if the GLP-
1 concentration was higher than the upper quartile
cutoff point of the control group; decrease if the
GLP-1 concentration was lower than the lower
quartile of the control group, and normal if the
GLP-1 concentration was within the control range.
Diagnosis of overweight when the patient has 23
BMI < 25 kg/m2; and diagnosis of obesity, BMI
25 kg/m2 (The Asia-Pacific Diabetes Association,
2000) [1].
Diagnostic criteria for diabetes according to ADA
recommendations in 2012 [3].
Diagnosis of type 2 diabetes according to WHO
1999 applied by Vietnam [1].
* Data processing: SPSS 16.0 software.
RESULTS
Table 1: Characteristics of subjects.
Characteristics nDM with OB
(n = 32)
nDM with non-OB
(n = 30)
Healthy
(n = 30) p
Age
(years)
<60 [n;(%)] 20 (62.5) 25 (83.4) 24 (80.0) > 0.05
≥60 [n;(%)] 12 (37.5) 5 (16.6) 6 (20.0)
Mean 56.2 ± 9.9 54.6 ± 11.1 53.6 ± 11.1 > 0.05
Sex Male [n;(%)] 15 (46.9) 14 (46.7) 10 (33.3) > 0.05
Female [n;(%)] 17 (53.1) 16 (53.3) 20 (66.7)
BMI
Obesity [n;(%)] 14 (43.8) 0 (0.0) 0 (0.0)
< 0.001
Overweight [n;(%)] 14 (43.8) 0 (0.0) 0 (0.0)
Normal [n;(%)] 0 (0.0) 27 (90.0) 17 (56.7)
Thin [n;(%)] 0 (0.0) 3 (10.0) 13 (43.3)
Mean 25.1 ± 2.0 20.2 ± 1.6 20.2 ± 1.6 < 0.001
Average waist circumference
(cm) 85.9 ± 7.9 80.5 ± 7.9 80.1 ± 5.5 < 0.05
Average hip circumference (cm) 94.4 ± 6.5 86.7 ± 7.2 83.4 ± 5.9 < 0.001
Waist/hip 0.91 ± 0.06 0.91 ± 0.05 0.87 ± 0.01 > 0.05
Glucose (mmol/L) 11.13 ± 3.98 12.23 ± 5.05 5.33 ± 0.55 < 0.001
HbA1c (%) 9.6 ± 2.2 10.3 ± 2.3 - > 0.05
INTERNAL MEDECINE JOURNAL OF VIETNAM|NO 22/2021
16
CLINICAL RESEARCH
The mean waist and hip circumference, BMI of the nDM with OB group were statistically higher than that
of the control group. There was no difference in age and gender of the three groups (p > 0.05).
Table 2: Characteristics of GLP-1 concentration in 3 groups.
GLP-1 (ng/mL) nDM with OB
(n = 32)
nDM with non-OB
(n = 30)
Healthy
(n = 30)
Minimum value 11.70 19.8 25.6
Maximum value 47.90 63.8 80.1
Lower quartile cutoff - - 32.55
Interquartile cutoff - - 45.60
Upper quartile cutoff - - 66.95
GLP-1
Mean 24.98 ± 10.36 32.15 ± 11.22 49.74 ± 18.24
p p (Anova test) (abc) < 0.001
p(ab) < 0.05; p(ac) < 0.001; p(bc) < 0.001
The concentration of GLP-1 in the group of nDM with OB was 24.98 ± 10.36 pg/mL which was statistically
significantly lower than the group of nDM with non-OB (32.15 ± 11.22 pg/mL) and the control group (49.74
± 18.24 pg/mL; p < 0.001).
Table 3: The rate of increase (decrease) of the GLP-1 concentration in 3 groups.
GLP-1
(pg/mL)
nDM with OB
(n = 32)
nDM with non-OB
(n = 30)
Healthy
(n = 30) p
Decrease [n;(%)]
(GLP-1 < 32.55) 23 (71.9) 20 (66.7) 7 (23.3)
< 0.001
Normal [n;(%)]
32.55 ≤ GLP-1 ≤ 66.95 9 (28.1) 10 (33.3) 16 (53.3)
Increase [n;(%)]
(GLP-1 > 66.95) 0 (0.0) 0 (0.0) 7 (23.4)
The proportion of patients with decreased GLP-1 in the group of nDM with OB was higher than that in the
group of nDM with non-OB and the control group (71.9% vs 66.7% and 23.3%, respectively, p < 0.001).
Table 4: Relationship between GLP-1 and waist circumference and BMI in the nDM with OB group.
Characteristics GLP-1 (pg/mL) (n = 32) p
Waist circum-
ference
Male
Increase (n = 4) 27.87 ± 12.84 < 0.05
Normal (n = 11) 34.05 ± 9.90
Female
Increase (n = 8) 19.90 ± 9.41 > 0.05
Normal (n = 9) 22.81 ± 4.96
BMI
Obesity (n = 14) 20.13 ± 6.83 < 0.05
Overweight (n = 18) 28.74 ± 11.20
INTERNAL MEDECINE JOURNAL OF VIETNAM|NO 22/2021
17
CLINICAL RESEARCH
The mean concentration of GLP-1 in nDM with OB who were centrally obese was lower than that in male
patients without central obesity (p < 0.05). The average concentration of GLP-1 in the patients with obesity
was statistically significantly lower than that of the overweight group (p < 0.05).
Figure 1: Correlation between GLP-1 and BMI.
There is a moderate negative correlation between GLP-1 concentration and BMI
(r = - 0.433; p < 0.05).
Table 5: Relationship between GLP-1 and age and sex.
Characteristics GLP-1 (pg/mL) p
Age (years) < 60 (n = 20) 25.51 ± 8.20 > 0.05
≥ 60 (n = 12) 23.24 ± 9.81
Sex
Female (n = 17) 21.44 ± 7.30 < 0.05
Male (n = 15) 28.99 ± 12.01
The mean concentration of GLP-1 in the male group of nDM with OB was statistically significantly higher
than that in the female group (28.99 ± 12.01 vs. 21.44 ± 7.30 pg/mL, respectively, p < 0.05). The average
GLP-1 concentration in the 2 age groups did not differ significantly and statistically (p > 0.05).
DISCUSSION
The results of this study showed that the concentration of GLP-1 in the group of nDM with OB was 24.98 ±
10.36 pg/mL, which was statistically significantly lower than the group of nDM with non-OB [32.15 ± 11.22
(pg/mL)] and the control group [49.74 ± 18.24 pg/mL; p < 0.001]. Research by Nguyen Thi Ho Lan (2015)
found that the average concentration of GLP-1 in the group of patients with type 2 diabetes (31.43 ± 13.00
pg/mL) was statistically significantly lower than the control group (49.74 ± 18.24 pg/mL), (p < 0.001) [2].
L. Pala et al. (2010) studied 56 research subjects, including 15 patients with impaired glucose tolerance,
13 patients with type 2 diabetes, and 28 with normal blood glucose tolerance. 30 minutes after all subjects
took orally 75 grams of sugar, the GLP-1 concentrations in patients with type 2 diabetes and patients with
impaired glucose tolerance were lower than those with normal glucose tolerance. However, there was no
statistically significant difference between GLP-1 levels in subjects with impaired glucose tolerance and
subjects with type 2 diabetes (p > 0.05) [7]. Minako Yamaoka et al. (2010) studied 97 Japanese patients,