Page 1
Risk Assessment
and Risk Management, II
Principles of Environmental Toxicology
Instructor: Gregory Möller, Ph.D.
University of Idaho
Principles of Environmental Toxicology
2
Modeling Risks
• “All models are wrong; some models are useful.”
George Box
Principles of Environmental Toxicology
3
Why Model Risks?
• Generally, modeling is performed to:
– Better understand a system.
– Make predictions.
• Specifically, risk modeling is often necessary
because:
– Acceptable risk levels are
not measurable.
– Direct sampling is not
feasible.
Principles of Environmental Toxicology
4
Point-Deterministic Approach
0.00 11.75 23.50 35.25 47. 00
Exposure Duration (years)
ED
0 2,000 4, 000 6,000 8,000
Exposure (EF*ET -hr/yr)
EF
29.26 30.69 32.11 33. 54 34.96
Concent ration
CC
36.53 61.22 85.92 110.61 135.30
Body Wei ght (kg)
BW
1.53e-7 1.35e-5 2.6 7e-5 4.00e-5 5.33e-5
Toxici ty Factor (mg/kg d)
TF
CR
RISK
2.39 298.68 594.98 891.27 1,187.57
Contact Rate
Risk = TF x CC x CR x EF x ED
BW
Principles of Environmental Toxicology
5
Monte Carlo Simulation
Definition
• A technique by which a prediction is calculated
repeatedly using randomly selected what-if trials.
• The results of numerous trials are plotted to
represent a frequency distribution of possible
outcomes allowing the
likelihood of each such
outcome to be estimated.
Principles of Environmental Toxicology
6
Monte Carlo Simulation
History
• Games of chance were used in the late 19th and
early 20th centuries to infer outcomes.
– e.g., πwas estimated by how often a haphazardly tossed
pin intersected lines on a grid.
• The term, “Monte Carlo,” came
into use to describe this process
at Los Alamos National Laboratory
in the late 1940s. Intensive
application of the process started
in the 1950s.

Page 2
Principles of Environmental Toxicology
7
Available Tools
• Excelor LotusMonte Carlo simulation add-
in programs.
•Crystal Ball
– User friendly.
– Good graphics.
• @Risk
– Powerful.
– Large selection of distributions.
Principles of Environmental Toxicology
8
Stochastic Approach
0.00 11.75 23.50 35.25 47. 00
Exposure Duration (years)
ED
0 2,000 4, 000 6,000 8,000
Exposure (EF*ET -hr/yr)
EF
29.26 30.69 32.11 33. 54 34.96
Concent ration
CC
36.53 61.22 85.92 110.61 135.30
Body Wei ght (kg)
BW
1.53e-7 1.35e-5 2.6 7e-5 4.00e-5 5.33e-5
Toxici ty Factor (mg/kg d)
TF
CR
RISK
2.39 298.68 594.98 891.27 1,187.57
Contact Rate
Risk = TF x CC x CR x EF x ED
BW
0.00 0.00 0.00 0.00 0.0 0
A1
Principles of Environmental Toxicology
9
Stochastic vs. Deterministic
• Similarities
– Both approaches operate on the same fundamental
model structure.
– Both approaches generally utilize the same data.
Principles of Environmental Toxicology
10
Stochastic vs. Deterministic, 2
• Differences.
– Stochastic approach utilizes complete distributions;
deterministic approach utilizes a single point from each
(specified or unspecified) distribution.
– Stochastic approach quantifies uncertainty; deterministic
approach does not.
Principles of Environmental Toxicology
11
Stochastic vs. Deterministic, 3
• Differences.
– Stochastic approach is generally more time and resource
intensive than the deterministic approach.
– Stochastic approach is capable of providing more realistic
predictions; deterministic approach is more general.
Principles of Environmental Toxicology
12
Comparison
RobustNon-robustRobustness
CompleteIncompleteCompleteness
Statistics are
comparable
Not comparableComparability
Statistics are
representative
No informationRepresentative-ness
Relatively unbiasedConservatively biasedAccuracy
QuantifiedNo informationPrecision
StochasticDeterministicParameter
Page 3
Principles of Environmental Toxicology
13
Case Histories
• As-contaminated mine site in British Columbia,
Canada.
• Pb-contaminated smelter site in Utah.
•226Ra-contaminated smelter site in Idaho.
• Catacarb release at a refinery in California.
Principles of Environmental Toxicology
14
As-Contaminated Mine Site
•Mean 2x10
-6 (2 in one million)
•Median 5x10
-7 (5 in ten million)
•95
th%ile 8x10⁻⁶ (8 in one million)
• Pt.-det. estimate 1.0x10⁻³ (1 in one thousand)
>> 99.9th%ile (bounding est.)
• Difference 120x
6.7e-9 1.5e-5 3.0e-5 4.5e-5 6.0e-5
ILCRocc
ILCRres
ILCRres,0.95
Probability
Principles of Environmental Toxicology
15
Pathway-Specific Contribution
0
0.2
0.4
0.6
0.8
1
1.2
fd,inh
lt,ing
lt,dc
sw,ing
rt,ing
hd,inh
s,ing
rt,dc
hd,ing
hd,dc
sw,dc
s,dc
Exposure Pathway
Relative Contribution to Risk
Principles of Environmental Toxicology
16
Pb-Contaminated Smelter Site
• Mean 2 ug/dL
• Median 1.2 ug/dL
•95
th%ile 9 ug/dL
• Pseudo-sto. est. 17 ug/dL
> 98th%ile (potential bounding est.)
• Overestimation 1.9x
0.0 10.1 20.1 30.2 40.2
PbB3(ug/dL)
PbB3,0.95
Probability
Principles of Environmental Toxicology
17
226Ra-Contaminated Smelter
•Mean 8x10
-6 (8 in 1 million)
•Median 6x10⁻⁷ (6 in 10 million)
•95
th%ile 4x10⁻⁵ (4 in 100 thousand)
• Pt.-det. estimate 2x10⁻³ (2 in 1 thousand),
>> 99.9th%ile (bounding est.)
• Overestimation 50x
1.5e-8 7.2e-5 1.4e-4 2.2e-4 2.9e-4
ILCRocc
ILCRocc
ILCRocc,0.95
Probability
Principles of Environmental Toxicology
18
Catacarb Release at a Refinery
•Mean 3
•Median 2
•95
th%ile 8
• Pt.-det. estimate 60
>> 99.9th%ile (bounding est.)
• Difference 8x
0 6 12 18 23
HQpi,ty
HQpi,ty,0.95
Probability
Page 4
Principles of Environmental Toxicology
19
Principles of Environmental Toxicology
20
Common P. Distributions
• Normal
• Lognormal
•Uniform
• Loguniform
•Beta
• Gamma
• Exponential
•Custom
• Triangular
Principles of Environmental Toxicology
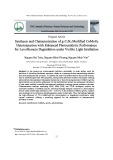
21
Normal Distribution
• Bell-shaped curve.
• Unbounded.
• Most commonly known
distribution due to extensive
use in classical statistics.
– Definition: N(µ, σ).
-3.00 -1.50 0.00 1.50 3.00
Standardized Normal Distribution
Probability
Principles of Environmental Toxicology
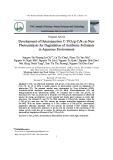
22
Lognormal Distribution
• Logarithms of values are normally distributed.
• Used to represent positively
skewed data.
• Commonly used to describe
environmental and biological variables.
– Definition: LN(µ, σ, λ).
0.05 5.06 10.07 15.08 20.09
Lognormal Distribution
Probability
Principles of Environmental Toxicology
23
Uniform Distribution
• All values between the bounds
occur with equal likelihood.
– Definition: U(λ, υ).
0.00 0.25 0.50 0.75 1.00
Standardized Uniform Distribution
Probability
Principles of Environmental Toxicology
24
Stochastic vs. Deterministic
• Virtually all non-trivial models, which are simplified
representations of reality, are inherently uncertain.
• Deterministic modeling is relatively simple and is less
demanding of time and resources.
• Stochastic modeling is
more realistic and quantifies
uncertainty.
• Monte Carlo simulation is
a standard stochastic
modeling algorithm.

Page 5
Principles of Environmental Toxicology
25
Stochastic vs. Deterministic, 2
• Monte Carlo simulation software and compatible
hardware are readily available.
• Deterministic modeling is a good screening tool.
• Most valid concerns about Monte Carlo simulation
apply equally or more so to deterministic techniques.
• Deterministic risk models
are an easier task in
risk communication.
Principles of Environmental Toxicology
26
Principles of Environmental Toxicology
27
Assessment vs. Management
• Integrated, but separate, processes.
• Different missions.
– Risk manager—be protective.
– Risk assessor—be unbiased.
• Precaution required so
as to not confuse the two
missions and processes.
Principles of Environmental Toxicology
28
Risk Management
• Decision criteria.
• Value-of-information analysis and further site
characterization.
• Decision analysis and remedy selection.
Principles of Environmental Toxicology
29
Decision Criteria
USEPA’s Nine-Criteria Decision Model
• Threshold criteria
– Protection of human health and the environment.
– Compliance with legally applicable or relevant and
appropriate standards, requirements, criteria, or limitations.
• Balancing criteria
– Long-term, short-term performance.
– Reduction of waste volume or toxicity.
– Implement-ability; cost.
• Modifying criteria
– State acceptance.
– Community acceptance.
Principles of Environmental Toxicology
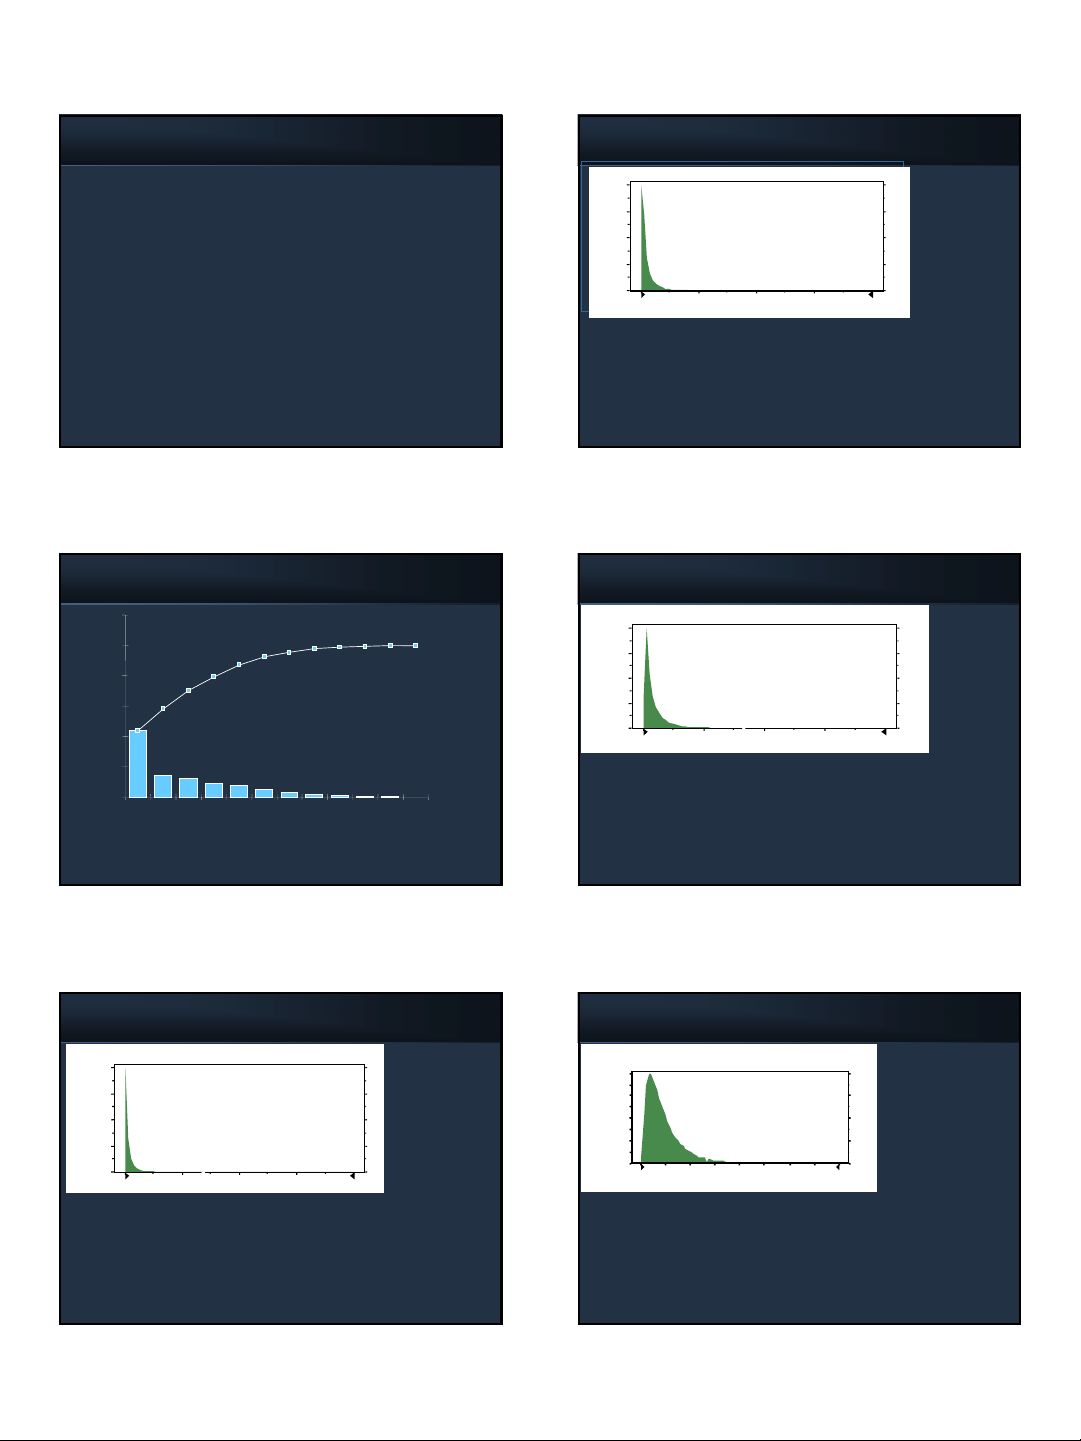
30
Valid High-End Risk Estimate
p0.50 p0.90
p0.95
p0.98
p0.99
p0.999
High-End
Estimate
Bounding
Estimate
Reasonable
Worst-Case
Estimate
Probability
![Bài giảng Hóa nước vi sinh [chuẩn nhất]](https://cdn.tailieu.vn/images/document/thumbnail/2025/20250522/phongtrongkim2025/135x160/193_bai-giang-hoa-nuoc-vi-sinh.jpg)