
72 Phuong T.K. Doan
MODELLING OF SEDIMENT DIAGENESIS AND ITS LINKAGE WITH
THE WATER COLUMN. THE CASE STUDY OF BAY OF QUINTE, CANADA
Phuong T.K. Doan*
The University of Danang - University of Science and Technology, Vietnam
*Corresponding author: dtkphuong@dut.udn.vn
(Received: August 22, 2024; Revised: September 26, 2024; Accepted: October 15, 2024)
DOI: 10.31130/ud-jst.2024.561E
Abstract - In this study, the Aquasim model has been applied
and developed to simulate the processes occurring in the
sediments of the eutrophic system at Quinte Bay, Canada. The
findings reveal that phosphorus (P) retention varies both
spatially and temporally across the three basins of the Bay.
These variations are influenced by factors such as sedimentation
history, the chemical form of P, topography, and historical land
use. According to the model, recent data indicates a decline in
accumulated P at two shallow sediment sites (B and N),
potentially leading to increased P release from these sediments.
In contrast, the deeper sediment site (HB) continues to show
high and stable P accumulation, resulting in consistently low
and relatively unchanged P release. This explains why P levels
in the Bay remain high, contributing to the growth of algae. The
study also highlights the importance of adequately reducing
external P loading. Internal P loads only play a supportive role
in achieving the desired ecological conditions of the Bay.
Key words - P released from sediments; P retention; Sediment
model; Aquasim.
1. Introduction
Phosphorus (P) serves as a primary limiting nutrient in
many lakes and reservoirs. However, increased P levels
from human activities such as urban growth, mining,
industrial processes, agricultural runoff, and internal
recycling can significantly impact these water bodies. This
heightened P loading often triggers excessive algae
growth, causes hypoxic conditions in deeper waters, and
ultimately degrades overall water quality [1].
The concentration of P in the water column depends on
the balance between external input loads, losses through
surface water, and the processes of release and burial
within sediments. Internal loading, or the release of
reactive phosphorus from sediments, is a significant
concern due to its potential to greatly elevate the levels of
bioavailable phosphorus in a lake [2, 3]. Thus,
investigation of P mechanisms in the sediments is
indispensable to understand P budgets of lakes [4, 5].
Study on sediment modeling has not been extensively
studied in Vietnam and faces many challenges. Sediment
modeling research is still underdeveloped in Vietnam and
encounters several challenges. A primary challenge in
numerical modeling is striking a balance between the
complexity of the model and the availability of data. The
aim is to optimize model performance while minimizing
the risk of adding excessive uncertainty [6]. To implement
sediment diagenesis models, a detailed dataset of vertical
profiles for both dissolved and solid components is
essential [7].
The distinct sediment and pore-water datasets available
for the Bay of Quinte [8, 9] provide a valuable opportunity
to model the dynamics of P and better understand its role
in controlling the release of P from sediments. Specifically,
our objectives are (i) to assess the temporal and spatial
trends of P release and retention in sediments, and (ii) to
simulate P fluxes in three basins of Quinte Bay when
sediment flux is reduced by 20% in the future.
2. Methods and Model Application
2.1. Study site
The Bay of Quinte lies along the northeastern shore of
Lake Ontario in Canada, bordered by a watershed that
spans 18,604 km². Extending approximately 100 km in
length, the Bay covers an area of about 254 km² and
contains a water volume of 2.67 km³ (see Figure 1).
Figure 1. Map of the Bay of Quinte highlighting three sampling
sites: B, N, and HB
In this study, we focus on three distinct locations with
varying nutrient loading histories: Belleville (B) and
Napanee (N) in the upper Bay, and Hay Bay (HB) in the
middle Bay (Figure 1c). The average water depths at the
three stations are: B, N and HB are 5.3 m, 5.6 m and
15.3 m, respectively [10].
ISSN 1859-1531 - THE UNIVERSITY OF DANANG - JOURNAL OF SCIENCE AND TECHNOLOGY, VOL. 22, NO. 11C, 2024 73
2.2. Field data
The calibration of the sediment diagenesis model was
carried out using sediment and pore-water data collected in
2013 and 2014. All data from the stations B, N, and HB
have been measured and analyzed in detail in previously
published papers [11, 12].
2.2.1. State variables
The model simulated both dissolved components and
solid components.
2.2.2. Model equations
The Aquasim non-steady state reaction-transport
diagenetic model used the following two differential
equations that were presented in detail in [6].
𝜕(𝜑𝑆𝑖)
𝜕𝑡 =𝜕
𝜕𝑧(𝐷𝐵𝜕(𝜑𝑆𝑖)
𝜕𝑧 + + 𝜑𝐷𝑆𝑖𝜕(𝑆𝑖)
𝜕𝑧 )
+ 𝑟𝑆𝑖− 𝛼𝑏𝑖𝑜𝑖𝑟𝑟𝑖𝑔 ∗∅∗(𝑆𝑖− 𝑆𝑖𝑆𝑊𝐼)
𝜕𝑋𝑖
𝜕𝑡 = −𝜕(𝜐𝑠 𝜖 𝑑𝑋𝑖)
𝜕𝑧 + 𝜕
𝜕𝑧(𝐷𝐵,𝑋𝑖 𝜕(𝑋𝑖)
𝜕𝑧 ) + 𝑟𝑋𝑖
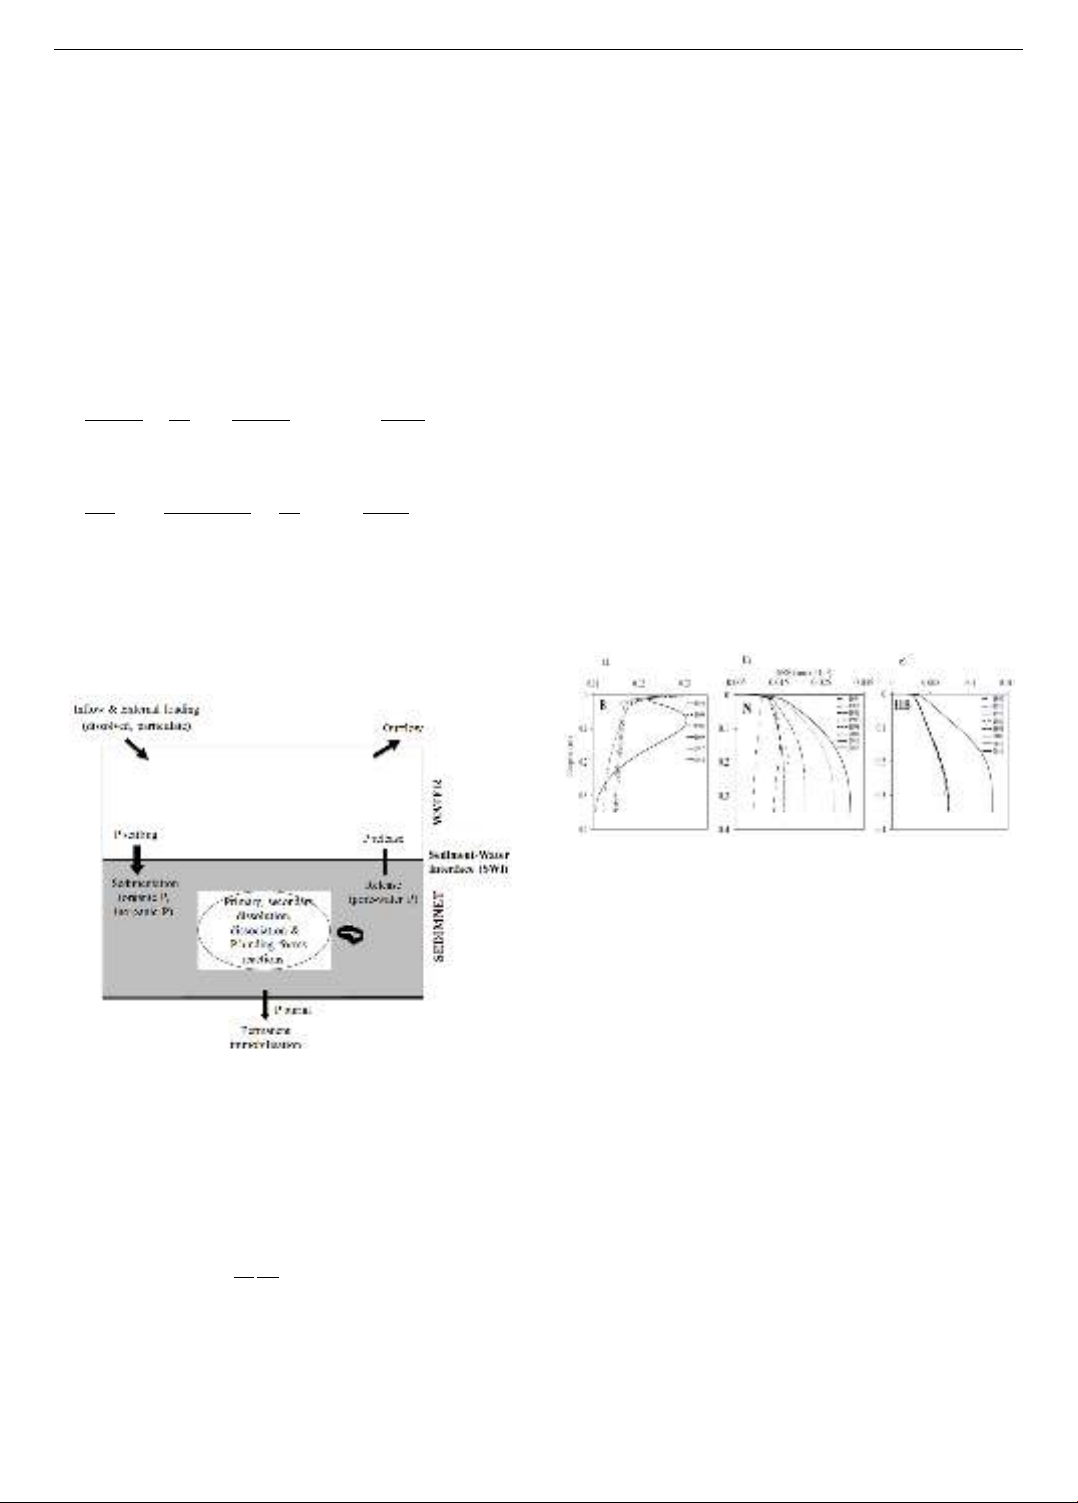
2.2.3. Model processes
A conceptual diagram illustrating the processes
incorporated into our diagenetic reaction transport model. The
model encompasses a range of geochemical reactions (Figure
2). The different reactions in Aquasim sediment model have
been described in detail in our previous study [13].
Figure 2. Conceptual diagram of the diagenetic model
2.3. P release and retention
2.3.1. P release
The concentration profiles of soluble reactive
phosphorus (SRP) in porewater can be utilized to estimate
P release from sediments into the overlying water by
applying Fick's diffusion law [14].
Prelease =Dsw φ
θ2∂C
∂z
Where Frelease is the release of phosphorus (mg m-2 d-1);
z is the depth coordinate within sediments (m); C is the
concentration of substances at the SWI (mg m-3); φ is
the sediment porosity (dimensionless); θ = 1−ln(φ2) is
the sediment tortuosity; D0 = f (T, φ) is the solute
diffusion coefficient (m2 d-1); T is the sediment
temperature (oC) [15].
2.3.2. P retention
The retention percentage of P is the ratio between
fluxes of P burial (Fburial) and settling (Fsettling)
Pretention (%) = 100 Fburial / Fsettling
The burial flux of dissolved and particulate P (Fburial)
[17, 18] is:
Fburial (mg m-2 d-1) = Sedacc. Pd-sed
The P settling flux (Fsettling) [16] is calculated by:
Fsettling (mg m-2 d-1) = Sedacc. Pt-sed
Where Sedacc (g m-2 d-1) is the sediment accumulation
rate calculated from the excess 210Pb, 226Ra profiles
measured through the sediment cores in the Bay of Quinte.
3. Results and Discussion
After successfully calibrating and validating the model
with measured data from 2013 and 2014, the results were
detailed in our previous study [8]. In this study, the authors
evaluate and propose scenarios from both the past and the
future.
3.1. Inter-annual variability of P fluxes in 70 past years
3.1.1. Inter-annual variability of soluble reactive
phosphorus (SRP)
Figure 3. Inter-annual variability of SRP at three stations
Pore-water SRP concentrations are influenced by many
of the model parameters: phosphate concentration gradient,
oxygen concentration, organic matter flux, iron oxide
presence, organic matter reactivity. The results from our
reaction-transport diagenetic model reveal spatial and
temporal variability in SRP concentrations in the Bay of
Quinte over the past years (Figure 3). The modelled SRP
profiles offer a reasonable representation of phosphate
concentration gradients at the sediment-water interface
(SWI) and enable an estimation of the variability in internal
phosphorus loading. The station N provided highest
phosphate concentration gradient at the SWI and highest P
release (Figure 3b). The sediment P release links to redox
condition at the SWI that are controlled by DO
concentration at the SWI. When the SWI is oxic, strong
adsorption of dissolved phosphate to solid iron
oxyhydroxides prevents phosphate diffusion into water
columns from sediments, limiting sediment P release. In
contrast, when the SWI is anoxic iron oxyhydroxides
reductively dissolve and phosphate is released into water
columns, increasing sediment P release [4].
3.1.2. Inter-annual variability of P release and P retention
From previous studies in the Bay of Quinte at three
stations (B, N, and HB), point-source P loads were cut to
74 Phuong T.K. Doan
< 80 kg d-1 in 1978 and have been steadily reduced since.
The current recommended cap is 15 kg d-1 (Minns and
Moore, 2004). In 2014, P loadings into the Bay were
estimated to be 5.3 kg d-1 during the May to October period.
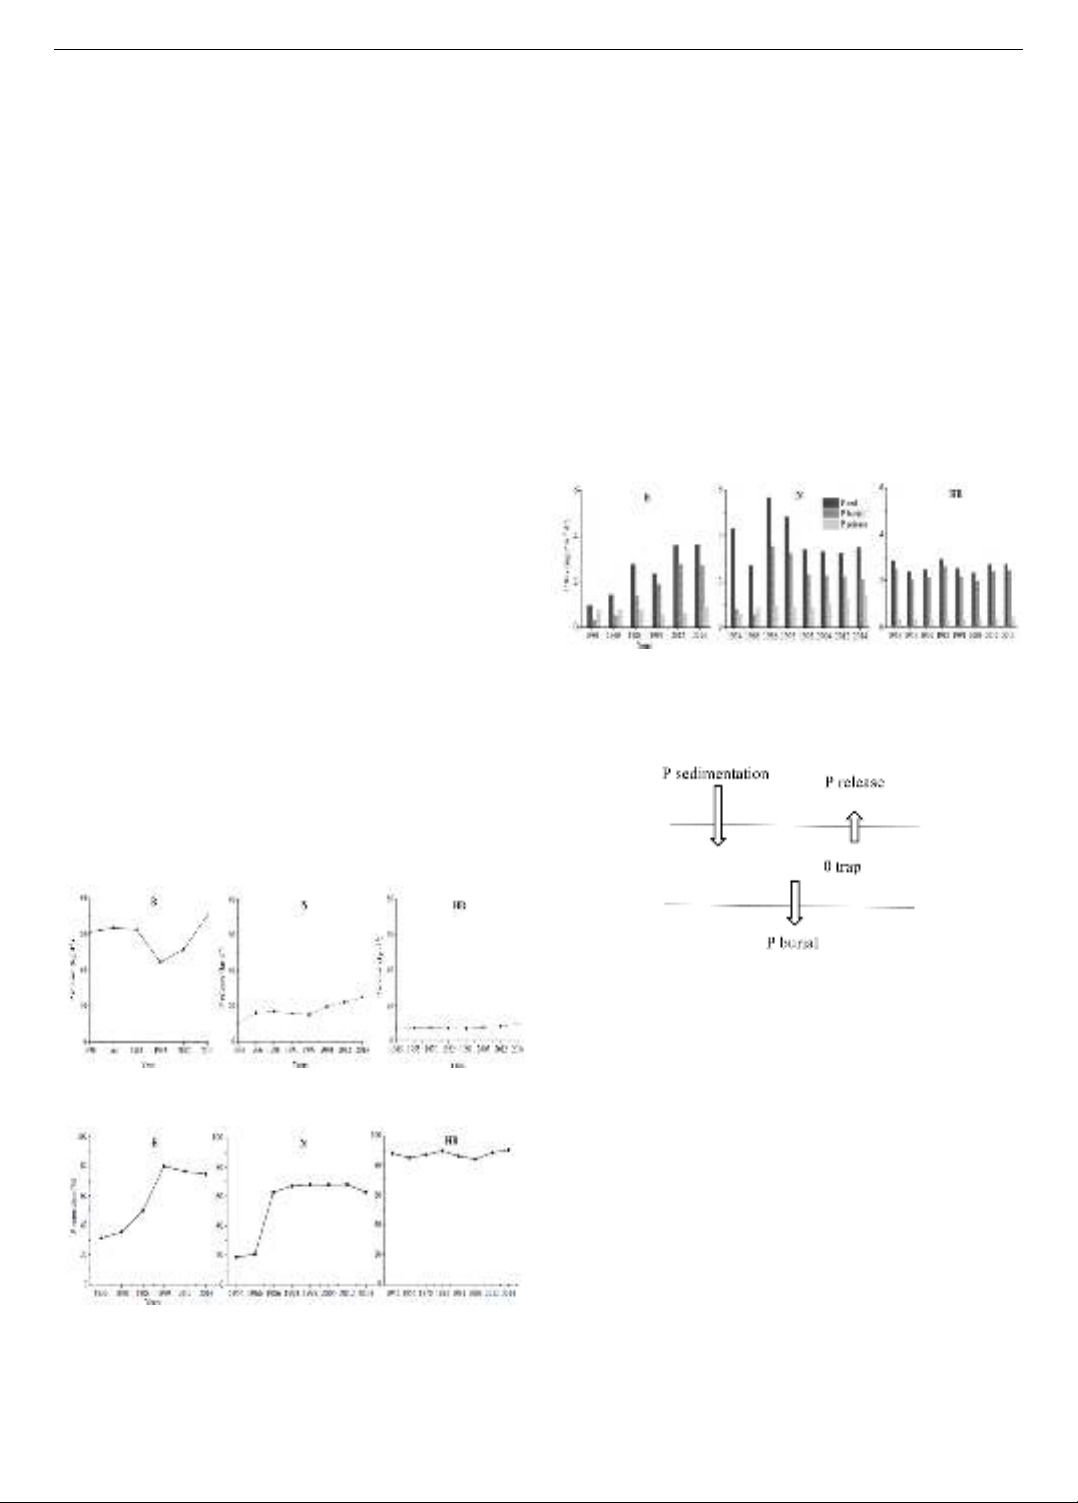
The amount of P release (kg d-1) at the three stations (B,
N and HB) in the past years was showed in Figure 4. High
amount of P release (ranged between 44 to 71 kg d-1) was
observed at the station B (Figure 4a) and lowest amount of
P release was observed at the HB station (from 7 to 10 kg
d-1; Figure 4c) in the past years. At the station N, the
amount P released was between 10 and 25 kg d-1 over the
period 1954 to 2014 (Figure 4b).
Figure 5 shows the temporal trends of P retention at the
three stations (B, N and HB). The P retention levels at both
stations (B and N) showed an increasing trend before 1999,
similar to the early stages of eutrophication in the 1950s.
These levels rose sharply following the reduction of
external phosphorus loading in 1978.
Our model results demonstrated decreasing trends of P
retention at these two stations after 2012, as well after the
arrival of zebra mussels in the system (Figure 5a, b).
Notably, for the station N, the lowest P retention with 19%
was observed in 1954, and it considerably increased to 63%
in 1986. The highest P retention around 68% was observed
in 2012 and it appeared to be decreasing later on. There are
about 63% of P currently was retained in the sediments at
the station N (Figure 5b). Similarly, for the station B, the
lowest P retention was estimated at 31% in 1930. It
significantly increased after the reduction of external P
loading. The P retention increased from 50% in 1983 to
80% in 1999, as a consequence of the point source P
loading reduction initiated in late 1970s (Figure 5a). In
contrast, the P retention at the HB station was quite high,
ranging from 84% to 91% (Figure 5c). This implies a high
retention efficiency of P in the area.
Figure 4. Long-term trends of P release at three stations
Figure 5. Long-term trends of P retention at three stations in
the past years
Based on the model results of long-term total P in
sediments and SRP in pore-water, P settling, burial and
release for annual averages in the past years at each station
were estimated. Our model results demonstrate strong
dynamics of P settling fluxes at the two stations B and N
(Figure 6a, b). High P settling was observed at the station
N (2.7 - 5.6 mg P m-2 d-1; Figure 6b). A peak of P settling,
exceeding 5 mg m-2 d-1, was shown in 1986 at the station N
(Figure 6b). Lower values of P settling were observed at
the station B (1.0 - 3.6 mg m-2 d-1; Figure 6a). At the station
HB, the P settling fluxes did not change significantly in all
the past years (2.4 - 2.9 mg m-2 d-1; Figure 6c).
The trend in P burial flux varies from site to site in the
Bay. The strong dynamics of P burial were observed at the
stations B and N, varying from 0.3 to 2.7 mg m-2 d-1 and
from 0.8 to 3.5 mg m-2 d-1, respectively (Figure 6a, b).
Interestingly, low P burial was presented in the deep
sediment layers of the two stations B and N earlier
the 1970s (0.3 - 0.8 mg m-2 d-1; Figure 6a, b). At the station
HB, the P burial flux did not change significantly
(2.0 - 2.6 mg m-2 d-1; Figure 6c).
Figure 6. Year-to-year variability of P settling, burial,
and release in the three stations
The P loadings over time can be generalized through
mass balance analysis (Figure 7).
Figure 7. Mass balance considerations and the recycling of P
Our calculation pointed out that in a steady state at three
stations, the sediment P release is linked to the permanent
P burial flux so that
P release = P settling - P burial
Exceptionally for the station N, the P settling flux was
much higher than the sum of P burial and P release before
the point-source P loading reduction in 1978 (Figure 9b).
3.2. Linking sediment diagenesis model results with
water column data over the period 2002-2009
3.2.1. Internal P fluxes and water column data in past years
We have enough data including external P loading and
water column data over the period 2002-2009 [19].
Therefore, we can link and discuss our sediment model
results with water column data in more detail over this
period. The figures below (Figure 8-11) present the water
column data and our sediment diagenesis model results
over the period 2002-2009. The external P loading data and
total P concentration in the water column of the Bay during
ISSN 1859-1531 - THE UNIVERSITY OF DANANG - JOURNAL OF SCIENCE AND TECHNOLOGY, VOL. 22, NO. 11C, 2024 75
the period 2002-2009 were applied from [19]. The P
release and retention were estimated by our sediment
diagenesis model.
From 2002 to 2009, the average external P loading was
5.6, 25.1, and 23.5 mg m⁻² d⁻¹ at the B, N, and HB stations,
respectively (Figure 8). Among the five rivers (Trent River,
Moira River, Salmon River, Napanee River, and Wilton
Creek), the Napanee River had the highest total P
concentration, contributing the greatest external P flux of
25.1 mg m⁻² d⁻¹ at station N (Figure 8b). The lowest
external P flux of 5.6 mg m⁻² d⁻¹ at station HB mainly came
from Wilson Creek (Figure 8c).
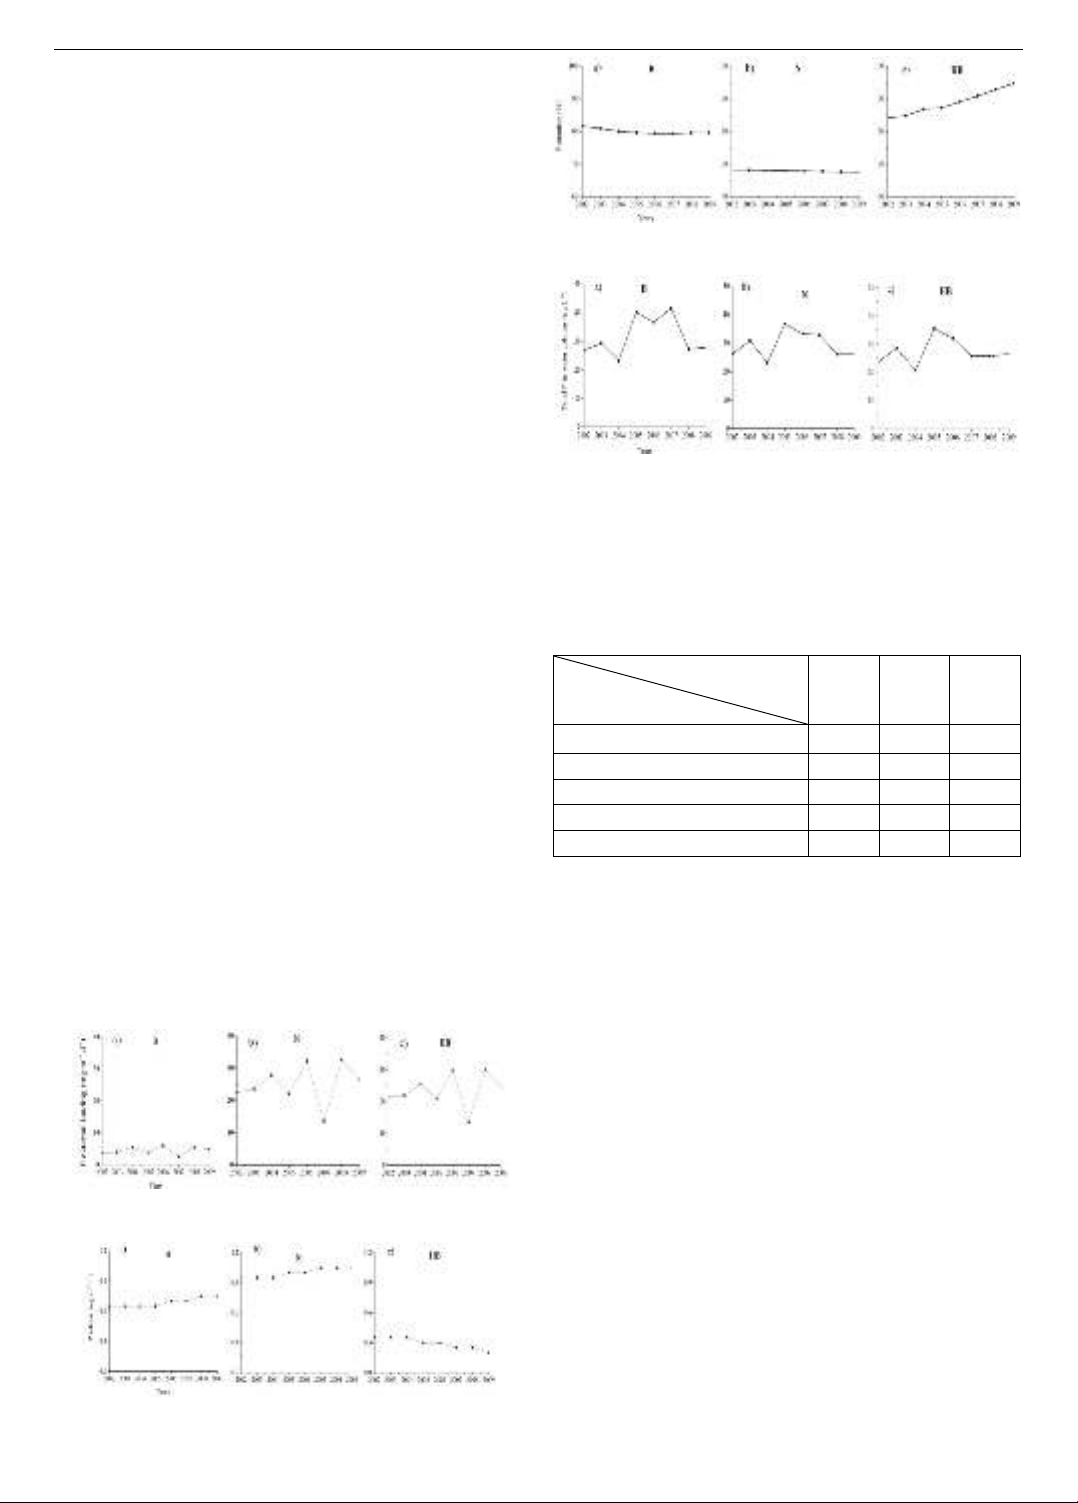
The internal P loadings (P release) at three stations over
2002-2009 are showed in Figure 9. The P release
demonstrated small increasing trends at B and N over this
period (Figure 9a, b), but appears to be decreasing slightly
in HB basin (Figure 9c). Highest P release (0.95 – 1.05 mg
m-2 d-1; Figure 9. b) was observed at the station N and
lowest P release (0.2 -0.35 mg m-2 d-1; Figure 9c) was
observed at the station HB. The P release at station B was
between 0.65 and 0.75 mg m-2 d-1 (Figure 9a). In 2007,
higher P release was observed at the stations B and N, but
lower P release was observed at the station HB (Figure 9).
In contrast with P release, P retention demonstrated
small increasing trends at B and N over time, but appears
to be decreasing in HB basin (Figure 10). At the station B,
the P retention was between 79.3 and 81.7% (Figure 10a).
Highest P retention (84.1 – 94.8 %) was observed at the
station HB (Figure 10c) and lowest P retention (67.5 – 68.2
%) was observed at the station N (Figure 10b).
High total P concentrations in the water column were
observed at all three stations of the Bay although there has
been considerable variability (Figure 11). At all three
stations, high total P was observed in 2005 (Figure 11). For
instance, the highest total P reached 36.8 μg l-1 in 2005 at
the station N (Figure 11b). At the station HB, the maximum
total P concentration (35.5 μg l-1) was observed in 2005
(Figure 11c). Whilst at the station B, the total P
concentration reached 41.6 μg l-1 in 2005 (Figure 11a). In
2007, high total P was observed at B and N stations but low
total P was observed at HB station (Figure 11).
Figure 8. External P loading at three stations over the period
2002-2009
Figure 9. Internal P loading (P release) at three stations over
the period 2002-2009
Figure 10. P retention at three stations over
the period 2002-2009
Figure 11. Total P in the water column at three stations
The fluxes represent the mass of P associated with
various compartments (water column, sediments),
averaged over the study period from 2002 to 2009. The
spatial variability of the different external and internal P
flux rates is shown in Table 1.
Table 1. Average flow rate P at three stations during the period
2002-2009
Station
P flux
components (mg m-2 d-1)
B
N
HB
Inflow & External loading
5.6
25.1
23.5
Outflow
5.1
24.5
23.2
Release
0.7
1.0
0.3
Sedimentation
2.9
3.3
2.4
Burial
2.3
2.3
2.1
Our model calculation pointed out that long-term mass
balance of P in the Bay of Quinte sediments was equilibrium
at a steady state (P release = P settling - P burial).
3.3. Model scenarios
To support the water quality management strategy for
Quinte Bay aimed at reducing P from agricultural sources
by 20% in the future, we ran model scenarios by reducing
sediment flux (Xflux) by 20%, corresponding to a 20%
reduction in both organic and inorganic P. The objectives
are to: (i) assess the time required to establish a new
sediment equilibrium in the future, and (ii) investigate the
impact of organic loading on changes in P release and
retention processes in the three basins of the Bay. In this
section, the authors reduce sediment flux by 20% for five
scenarios in 2034 and compare them with the current
condition in 2014 (keeping sediment flux constant).
3.3.1. Soluble reactive phosphorus profiles at three
stations in different years
After reducing 20% total sedimentation flux, the
concentrations of SRP were decreased (Figure 12). A large
reduction of SRP concentration was observed at the station
B (Figure 12a), while a smaller reduction of SRP
concentration was observed at the stations N and HB
(Figure 12b, c).
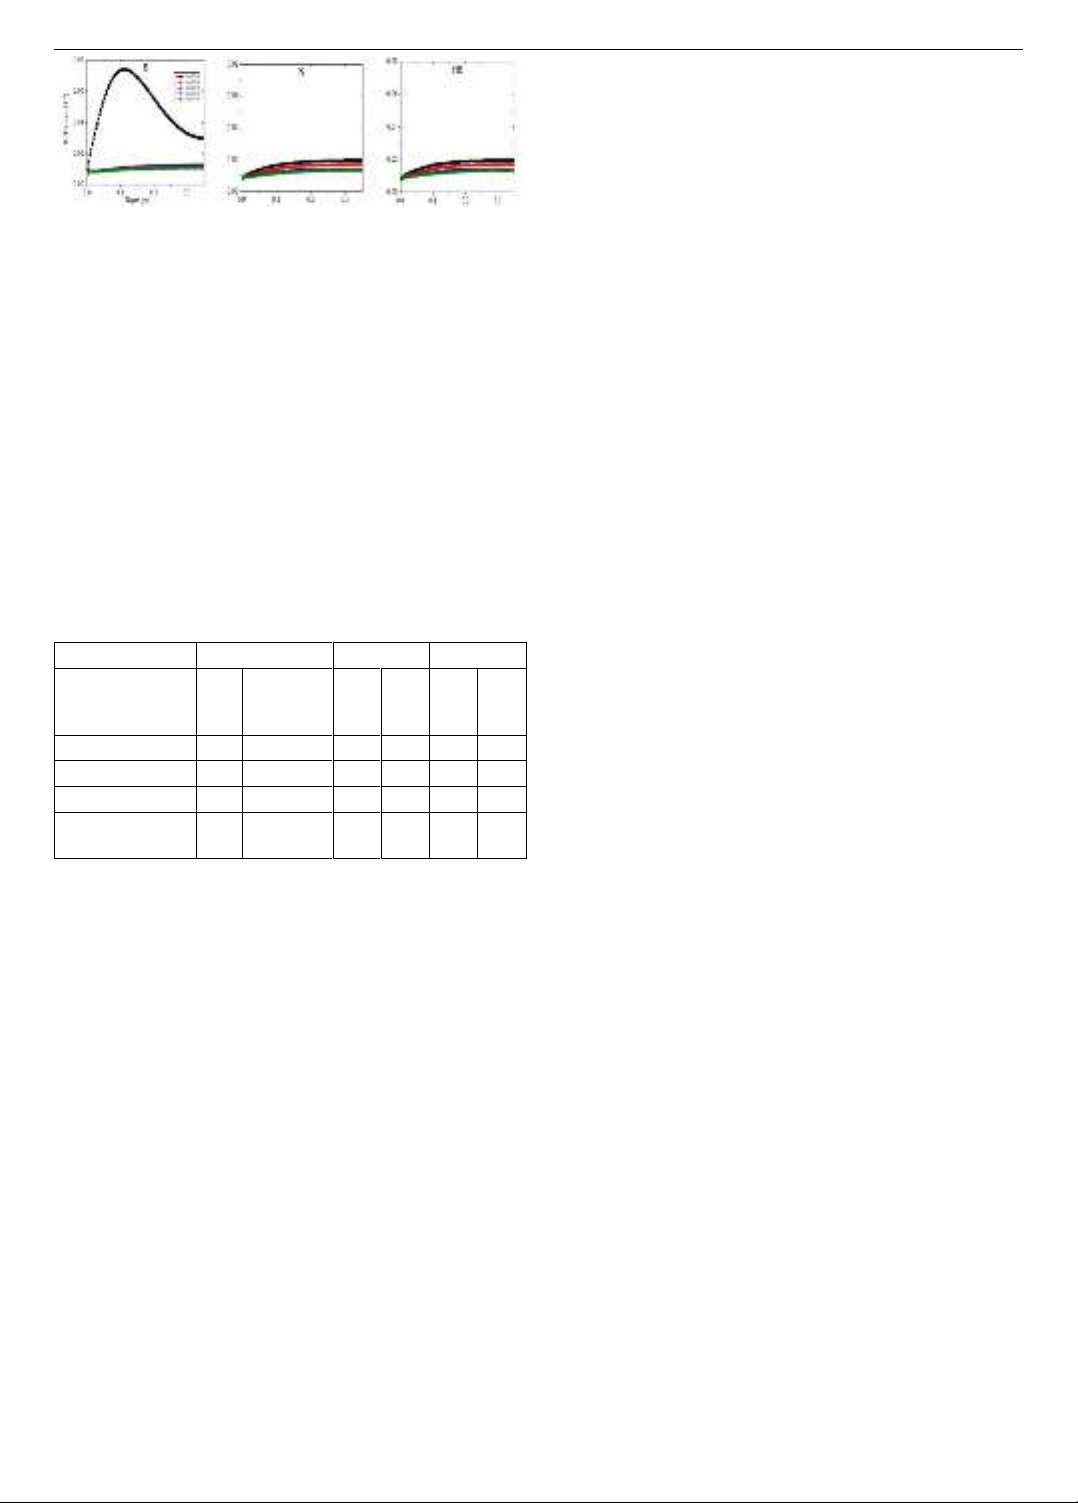
76 Phuong T.K. Doan
Figure 12. Simulated vertical profiles of SRP at three stations in
the different scenario years after reducing 20% Xflux
3.3.2. The mass balance of P for the current condition in
2014 and the scenario year 2034
Spatial variability of the various internal P fluxes and
P burial efficiency at three stations is presented in Table
2. The average P flux components (P settling, burial, and
release) represent the mass of P associated with the
sediment compartment in the present condition 2014 and
the scenario year 2034 (20% total sedimentation flux was
reduced). The internal P fluxes at each station consist of
the variability of P in the sediment pool, driven by
P inputs via settling from the water column (P settling),
P outputs via sediment release to the water column
(P release) and losses to deeper sediment layers through
burial (P burial) (Table 2).
Table 2. Spatial variability of the various internal P fluxes for
the present condition 2014 and the scenario year 2034
Station
B
N
HB
P flux
components
(mg m-2 d-1)
Year
2014
2034
(-20% Xflux)
Year
2014
Year
2034
Year
2014
Year
2034
P settling
3.83
2.77
3.43
2.51
4.01
3.53
P burial
2.77
2.12
2.34
1.77
2.83
2.46
P release
2.31
0.91
2.84
2.23
1.33
1.25
P burial
efficiency (%)
72
78
68
70
70.5
72.4
For station B:
After reducing 20% flux of total sedimentation, the P
fluxes at station B were reduced significantly. For instance,
the P settling was reduced from 3.83 mg m-2 d-1 in the
present condition (2014) to 2.77 mg m-2 d-1 in the scenario
year (2034). The P buried into the deep sediments were
responsible for 2.77 mg m-2 d-1 in the present condition and
2.12 mg m-2 d-1 in the scenario year. Similarly, after
reducing 20% total flux of sedimentation, the P release
from sediments was reduced considerably, from 2.31 to
0.91 mg m-2 d-1.
Our analysis suggests that at the station B, in the present
condition 2014, the P burial and P release were much
higher than the P settling flux. After reducing 20% total
flux, the new sediment P release is almost linked to the P
settling and the permanent P burial fluxes so that P release
~ P settling - P burial. It means that the new sediment-based
equilibrium may be established in 2034 after reducing 20%
flux of total sedimentation at station B.
For station N:
After reducing 20% flux of total sedimentation, the P
settling, burial and release fluxes at station N were reduced.
For example, the P settling flux was 3.43 mg m⁻² d⁻¹ in the
present condition (2014) and 2.51 mg m⁻² d⁻¹ in the scenario
year (2034). The P burial fluxes were 2.34 mg m⁻² d⁻¹ in the
present condition and 1.77 mg m⁻² d⁻¹ in the scenario year.
The P release from sediments was reduced, from 2.84 to
2.23 mg m-2 d-1 after reducing 20% total flux of
sedimentation. Our analysis suggests that at the station N,
in the present condition 2014, the P burial and P release
were higher than the P settling flux. After reducing 20%
total flux, the P burial and P release were still higher than
the P settling flux, thus the new sediment has still not
established an equilibrium.
For station HB:
The P settling, burial and release fluxes at station HB
were reduced slightly after reducing 20% flux of total
sedimentation. In two cases (the present condition and 20%
reduction of total flux), the P release is linked to the P
settling and the P burial fluxes so that P release = P settling
- P burial. This could be drawn that the sediments in the
station HB are close to an equilibrium state.
Our model calculation pointed out that long-term
mass balance of P in the Bay of Quinte sediments was
equilibrium at a steady state (P release = P settling - P
burial). We hope augers well for a self-cleansing of the
Bay in the future. Exceptionally for the station N, the P
settling flux was much higher than the sum of P burial and
P release before the point-source P loading reduction in
1978. This may be P was accumulated at the station N
before 1978.
Our results showed that the fluxes of P settling and
burial are higher and the P release is lower than those
reported in previous studies [19]. This is because, after
adjusting for the excessively high sedimentation rates used
in earlier models [19], our results align with the conclusion
of Kim et al, which suggests that the sediments in the Bay
of Quinte do not consistently act as a net source of P.
4. Conclusion
Our result indicated the spatio-temporal heterogeneity
with respect to the P retention in the studied three basins of
the Bay. P retention demonstrated decreasing trends at the
two stations B and N over time, this may increase P release
and maximize the likehood of refueling primary production
in the water column. Meanwhile, the P retention appears to
be increasing at the station HB leading to decrease P
release into the overlying water.
P release and P retention were somewhat inversely
correlated, indicating the dynamics of P binding forms
influence on P retention and release in the sediments and
seem to be connected with the eutrophication in the Bay.
Specifically, the station N exhibited the lowest P retention
with the amount of 63% of P retained in 2014, and
greatest P release from sediments (1.3 mg P m-2 d-1 in
2014). Highest P retention (91% in 2014) and lowest P
release (0.4 mg P m-2 d-1 in 2014) were observed at the
station HB due to high erosion and agriculture activities
in the watershed.
In summary, our results at the Bay of Quinte confirm
the importance of a sufficient reduction of external
loadings. The internal loadings were at best supportive for
reaching the target trophic lake condition.


![Giáo trình Vật lý đất Phần 1: [Mô tả chi tiết hơn về nội dung phần 1 nếu có]](https://cdn.tailieu.vn/images/document/thumbnail/2024/20240306/virabbit/135x160/446087973.jpg)


![Giáo trình Tài nguyên năng lượng và bảo vệ môi trường - Trường CĐ Cơ điện Hà Nội [Mới nhất]](https://cdn.tailieu.vn/images/document/thumbnail/2026/20260323/lionelmessi01/135x160/8121774378783.jpg)
![Đề cương bài giảng Kỹ thuật xử lý môi trường - Trường Cao đẳng Cơ điện Hà Nội [Chuẩn nhất]](https://cdn.tailieu.vn/images/document/thumbnail/2026/20260323/lionelmessi01/135x160/75051774429892.jpg)


![Giáo trình Bảo vệ môi trường (Nghề Bảo vệ thực vật CĐ/TC) - Trường Cao đẳng Gia Lai [Mới Nhất]](https://cdn.tailieu.vn/images/document/thumbnail/2026/20260224/hoacattuong2026/135x160/61741772002861.jpg)
