Journal of Pharmaceutical Research and Drug Information, 2024, 15: 18-25
Journal homepage: jprdi.vn/JP
Journal of Pharmaceutical Research and Drug Information
An official journal of Hanoi University of Pharmacy
*Corresponding author: Quoc Thang Nguyen; e-mail address: thangnguyenquoc1003@gmail.com 18
https://doi.org/10.59882/1859-364X/107
Research Article
2D-QSAR and molecular docking studies of hydroxamic acid derivatives
bearing Benzimidazole scaffold as histone deacetylase 6 inhibitors
Quoc Thang Nguyena,b,*, Tien Anh Duonga, Thi Mai Dung Doa, Thanh Tung Truongc, Hai Nam
Nguyena
aFaculty of Pharmaceutical Chemistry and Technology, Hanoi University of Pharmacy, 13-15 Le Thanh Tong,
Hanoi, Vietnam
bNuclear Medicine and Radiology Department, Vinmec Times City International Hospital, 458 Minh Khai,
Hanoi, Vietnam
cFaculty of Pharmacy, PHENIKAA University, Nguyen Trac, Hanoi, Vietnam
A R T I C L E I N F O
A B S T R A C T
Article history
Received 11 Oct 2023
Revised 29 Jan 2024
Accepted 9 Feb 2024
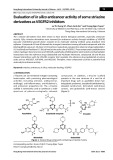
In this study, 2D-QSAR analysis and molecular docking were
performed to investigate the relationship between the hydroxamate-
based HDAC inhibitors with benzimidazole scaffold and the activity
toward HDAC6. A dataset of 55 N-hydroxybenzamide, N-
hydroxypropenamide derivatives containing benzimidazole structure
with HDAC6 in vitro activity were collected. The MLR (multiple
linear regression) method was used to build a 2D-QSAR model when
internal (leave-one-out cross validation) and external validation were
also tested. In addition, the molecular docking study was performed
by using MOE 2008 software to validate the affinity of the inhibitors
at the active site of HDAC6 enzyme (PDB ID: 5EEN). The model
was developed using 7 molecular descriptors from 55 compounds
with results of R2 = 0.905, RMSE = 0.343 and the concordance
correlation coefficient (CCC) = 0.950. The molecular docking results
also demonstrated the favorable binding interactions of compounds
into the active site on the structure of HDAC6 and the essential
residues in the pocket and the key interactions of benzimidazole ring
with these residues. Notably, the study enables a reliable model to
predict the inhibition activity of new benzimidazole-containing
inhibitors in HDAC6.
Keywords
QSAR
Molecular docking
Histone deacetylase inhibitor
Benzimidazole
Introduction
HDAC6 is a unique member of the histone
deacetylase (HDAC) family that regulates the
acetylation and deacetylation of histones and non-
histone proteins, such as α-tubulin, cortactin, and heat
shock protein 90 (HSP90) [1]. HDAC6 is essential for
several cellular functions that are involved in cancer
development and progression, such as cell
Quoc Thang Nguyen et al.
19
proliferation, apoptosis, senescence, DNA damage,
genomic stability, and cell motility. HDAC6 is
overexpressed in many types of cancer, such as breast
cancer, malignant melanoma, lung cancer, and ovarian
cancer, and its expression level correlates with tumor
aggressiveness and poor prognosis [2]. HDAC6
inhibitors are found to induce cancer cell death and
sensitize cancer cells to conventional
chemotherapeutic agents (Figure 1). HDAC6
inhibitors also influence the immune system by
altering the expression of program death receptor-1
(PD-1) and program death receptor ligand-1 (PD-L1),
which are two key targets for cancer immunotherapy.
Therefore, HDAC6 is a prospective therapeutic target
for cancer treatment and combination therapy [3].
Figure 1. IC50 values of some compounds for HDAC6 and other HDAC
Benzimidazole is a heterocyclic scaffold that
exhibits various biological activities and applications
in medicinal chemistry [4]. An example of a
benzimidazole-based HDAC inhibitor is Pracinostat
(Fig. 1) that has been approved by the FDA for the
treatment of hematologic malignancies [5]. Several
researchers also reported that benzimidazole
derivatives are promising inhibitory activity against
histone deacetylase enzymes [6, 7].
QSAR models and molecular docking have been
used widely to evaluate the association between
chemical structure and biological activity as well as
the binding modes of studied compounds at the active
sites. By using these approaches, that could help
researchers to orientate the design of new drugs. In our
study, we conducted a 2D-QSAR analysis and a
molecular docking study on a series of HDAC
inhibitors with the benzimidazole scaffold located at
the capping groups to identify the key interactions with
the surface residues of active site for high activity,
especially on HDAC6.
Materials and methods
Data set
A series of 55 hydroxamic acid derivatives using
benzimidazole as the capping group and their in vitro
HDAC6 activities (nM) were collected from some
published articles (Table S1 in the supporting
information file) [6-9]. The IC50 activities of HDAC6
were converted to minus logarithmic (-log) values
(pIC50). The 2D chemical structures of compounds
were drawn by ChemAxon MarvinSketch, and their
energy was minimized by the function in Molecular
Operating Environment (MOE) software [10]. The
sets of compounds were then divided into a test set (11
compounds) and a training set (44 compounds) using
the Kennard Stone method in the Dataset Division
software v1.2 [11].
Calculation, selection of 2D descriptors and 2D-
QSAR construction
A total of 938 2D descriptors were calculated with
MOE and Dragon v5.5 software [12]. The process for
selection of suitable descriptors was as follows: (i)
removal of descriptors with more than 20% of
compounds have missing or 0 values; (ii) removal of
descriptors with standard deviation less than 0.001;
Quoc Thang Nguyen et al.
20
(iii) removal of descriptors with a pair correlation
greater than 0.8 by using Microsoft Excel and
RapidMiner; (iv) normalization of the descriptors in
the range of [0, 1] (iv) selection of descriptors by GA-
PLS algorithm in Matlab software v2017a [13]. The
multiple linear regression (MLR) methods is used to
build a 2D-QSAR model by using XLSTAT software
version 2023. Internal validation involved parameters
of squared of the correlation coefficient (R2), adjusted
R2, leave one out cross validation coefficient (L.O.O
Q2). Finally, the developed model is validated by
external validation utilizing predictive R2 value
(R2pred).
Applicability Domain
In this work, the compounds that were not reliably
predicted were visualized by Williams plot using
Applicability Domain toolbox in Matlab program. The
leverage values for each compound were calculated
[14]. The compound is outside the range of
applications which has a negative impact on the
developed model.
Y-randomization test
The Y-randomization test was applied to the
developed QSAR model was not made by chance. The
training set was used for Y-randomization test by
YRandomization v1.2 program from the DTC lab. The
values of R2 for several random trials (10 times) are
lower than the non-random model and cR2p value is
greater than 0.5 then the given QSAR model is thought
to be robust [15].
Molecular docking study
Compound structures were generated by
ChemDraw version 9.0 and subsequently subjected to
minimize energy within an rms gradient of 0.1 kcal-
1.mol-1-1 by MOE 2015 package. The force field was
set to the 94s variant of the Merck Molecular force
field (MMFF94s). The hydroxamic acid groups were
deprotonated according to the previous reports [16].
The X-ray crystallographic structure of HDAC6 in
complex with belinostat was taken from Protein Data
Bank with ID of 5EEN [17]. The structure was
prepared using the QuickPrep tool in MOE for adding
hydrogen, protonating, deleting water, and editing
atom types, assigning AMBER FF99 charges
according to the same procedures mentioned before
[16]. For the docking setting, simulations of flexible-
ligand rigid-protein were performed using the method
of MOE Triangle matcher placement with retaining 30
poses for analysis. The results that showed appropriate
binding geometry with Zn2+ ion were considered. The
finally selected conformations were scored using
London dG (score1) and GBVI/WSA dG functions
(score2) to estimate the free binding energy between
the ligands and the enzyme. All the selected poses
were visualized using BIOVIA Discovery Studio v3.5
program.
Results and discussions
Development of 2D-QSAR model by MLR
The compounds involved in this research
possessed a similar benzimidazole core in the structure
of cinnamoyl or benzyl hydroxamates. 55
benzimidazole derivatives displayed the IC50
activities in the range from 0.0167 nM to 3500 nM.
There were 7 molecular descriptors that were selected
after processing 206 of 2D structural descriptors
including h_pstates, PEOE_VSA+2, PEOE_VSA+3,
Q_VSA_FPPOS, SlogP_VSA2, C-043 and F03[C-N].
The equation of 2D-QSAR model was built by MLR
as below:
pIC50 = 10.6468 - 0.8733 * h_pstates - 1.0908 *
PEOE_VSA+2 - 1.8804 * PEOE_VSA+3 + 0.6166 *
Q_VSA_FPPOS - 1.4465 * SlogP_VSA2 - 0.9185 *
C-043 - 1.7655 * F03[C-N]
The detail of selected descriptors was shown in
the Table 1:
Table 1. The descriptors of 2D-QSAR model
No.
Code of descriptors
Description
1
hˍpstates
The entropic state count or fractional number of protonation states
(pH=7).
2
PEOE_VSA+2
The Partial Equalization of Orbital Electronegativities (PEOE)
method of calculating atomic partial charges: Total positive 2 vdw
surface area.
3
PEOE_VSA+3
The Partial Equalization of Orbital Electronegativities (PEOE)
method of calculating atomic partial charges: Total positive 3 vdw
surface area.
4
Q_VSA_FPPOS
Fractional positive polar van der Waals surface area.
5
SlogP_VSA2
An approximate accessible van der Waals surface area (in Å2)
Quoc Thang Nguyen et al.
21
calculation for each atom
6
C-043
Carbon-centred fragments: XCRX: R represents any group
linked through carbon; X represents any heteroatom.
7
F03[C-N]
2D frequency fingerprints: frequency of C-N at the topological
distance 3.
Internal and external validation
The developed 2D-QSAR were evaluated by
utilizing the following parameters: the square of
correlation coefficient (R2), the root mean square of
deviation (RMSE), standard errors of training and test
sets [14]. For internal validation, the results showed
that R2train = 0.905, R2adj = 0.887 (>0.5) and RMSE =
0.379 (<0.5). The cross-validation with L.O.O method
expressed the Q2train = 0.850. Moreover, the model was
applied to the test set for external validation with the
values of R2pred = 0.680 (Fig.3). The results confirmed
QSAR model reliability and the correlation between
experimental and predicted activities. Additionally,
the Roy external validation was carried out by
calculating some metrics such as 𝑟
𝑚
2
(>0.5), ∆𝑟
𝑚
2
(<0.2), and CCC - concordance correlation coefficient
(>0.85) [18]. These metrics indicated that the values of
0.797, 0.012 and 0.985 for 𝑟
𝑚
2
, ∆𝑟
𝑚
2, and CCC,
respectively, confirmed that the model is suitable for
prediction.
Figure 2. The relationship between the predicted and experiment activities from the QSAR model of training (blue dots)
and test (yellow dots) datasets.
Y-randomization test
The results of Y-randomization test and the parameters are presented in the table below.
Table 2. The results of Y-randomization of the training set
Model
R
R2
Q2
Original
0.951
0.905
0.850
Random 1
0.356
0.126
-0.273
Random 2
0.478
0.228
-0.097
Random 3
0.450
0.202
-0.439
Random 4
0.386
0.149
-0.214
Random 5
0.259
0.067
-1.351
Quoc Thang Nguyen et al.
22
Table 3. Random model parameters
Average R:
0.402
Average R2:
0.166
Average Q2:
-0.393
cR2p:
0.821
The low average values of R2 and Q2 of 0.166 and
-0.393, respectively as well as the high value of cR2p
(>0.5) indicate that the developed model is robust and
was not given by a chance of correlation [15].
Applicability domain
The applicability domain was used to investigate
the relationship between the standardized residual and
the leverage values. Data was obtained from the
training and test sets and predicted pIC50 values from
the MLR model. The threshold value of the leverage is
set at h* = 0.55. The applicability domain was
displayed in the William’s plot as shown in Figure 4.
There are 02 compounds (compound 46 and 47, one
from training set and one from test set) that are defined
as outliers having higher leverage values than the
warning h* value. As a result, these compounds are
likely to be structural outliers.
Figure 3. William’s plot of the QSAR model developed by MLR method.
Significance of the descriptors in the model
The negative coefficient of the descriptors:
h_pstates, PEOE_VSA+2, PEOE_VSA+3,
SlogP_VSA2, C-043 and F03[C-N] reveal that the
biological activity of the compounds increase with the
decrease in the values of these descriptors. The only
positive coefficient of Q_VSA_FPPOS is an indicator
that the value of this descriptor varies directly with its
activity. Among seven descriptors, PEOE_VSA+3 has
the highest percentage contribution with 21.8% that
makes it play the most dominant role in the QSAR
model. PEOE_VSA+3 is a descriptor of van der Waals
surface area [10, 19]. The reduction of PEOE_VSA+3
values suggests a decrease in the polarity and increase
in hydrophobic properties of the compound that could
enhance the binding affinity of the compound to the
active site of protein.
Molecular docking study
To validate the docking procedures, redocking
experiments were performed with the native ligands
and the crystal structures of the HDAC6 enzyme (PDB
ID: 5EEN). Belinostat showed a high degree of
similarity with the co-crystal ligands in the active sites
of the enzyme, with an RMSD value of 0.8814 and
docking score (∆Gbind) of -8.069 kcal/mol. The key
hydrogen bonds with the residues His141, Gly339,
Tyr341, and π-π stacking interactions with Phe151,
Phe216 were maintained, as shown in the figure (Fig.
5). The hydroxamate group of belinostat formed the
stable chelate complexes with the ion Zn2+ in the
channels of the two proteins.