HUE JOURNAL OF MEDICINE AND PHARMACY ISSN 3030-4318; eISSN: 3030-4326 45
Hue Journal of Medicine and Pharmacy, Volume 14, No.4/2024
Evaluating the accuracy and reliability of fonseca anamnestic index
(FAI) in screening temporomandibular disorders
Nguyen Minh Quan1, Nguyen Cong Sinh1, Nguyen Gia Kieu Ngan1*
(1) Faculty of Odonto-Stomatology, Hue University of Medicine and Pharmacy, Hue University
Abstract
Background: Temporomandibular disorders (TMD) are a common medical condition in Vietnam and
around the world. Fonseca Anamnestic Index (FAI) is a quick and simple questionnaire to diagnose TMD.
Objectives: (1) To evaluate the accuracy and reliability of FAI in the diagnosis of TMD and (2) to suggest
adjustments to enhance the clinical value of FAI. Material and method: This study included 198 students (69
males, 129 females) from the Faculty of Odonto-Stomatology, Hue University of Medicine and Pharmacy. This
study is conducted from 06/2022 to 12/2022. Participants initially filled out FAI questionnaire, then followed
by questionnaire and clinical examination using Diagnostic Criteria for Temporomandibular Disorder (DC/
TMD) as a gold standard. Results: According to DC/TMD, the prevalence of TMD among students was 34.8%.
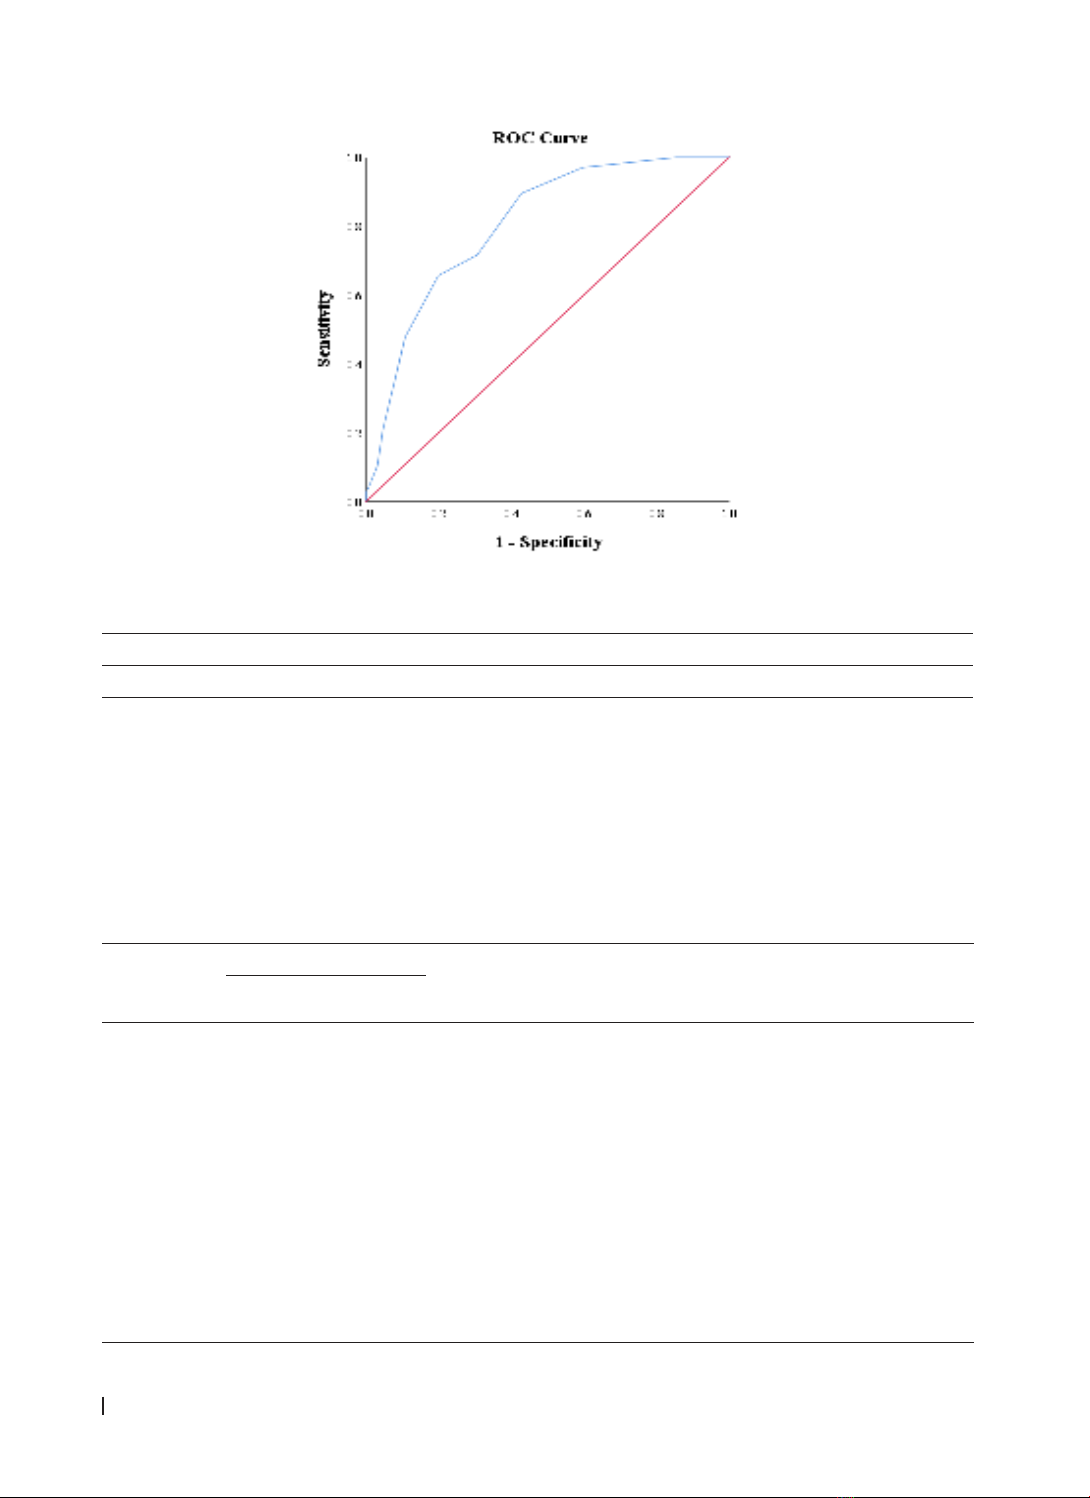
FAI had high sensitivity (97.1%) but low specificity (40.46%) (cutoff point = 17.5), Cronbach Alpha value was
0.684. The suggested cutoff point was calculated at 22.5. Only Question 8 from FAI questionnaire showed
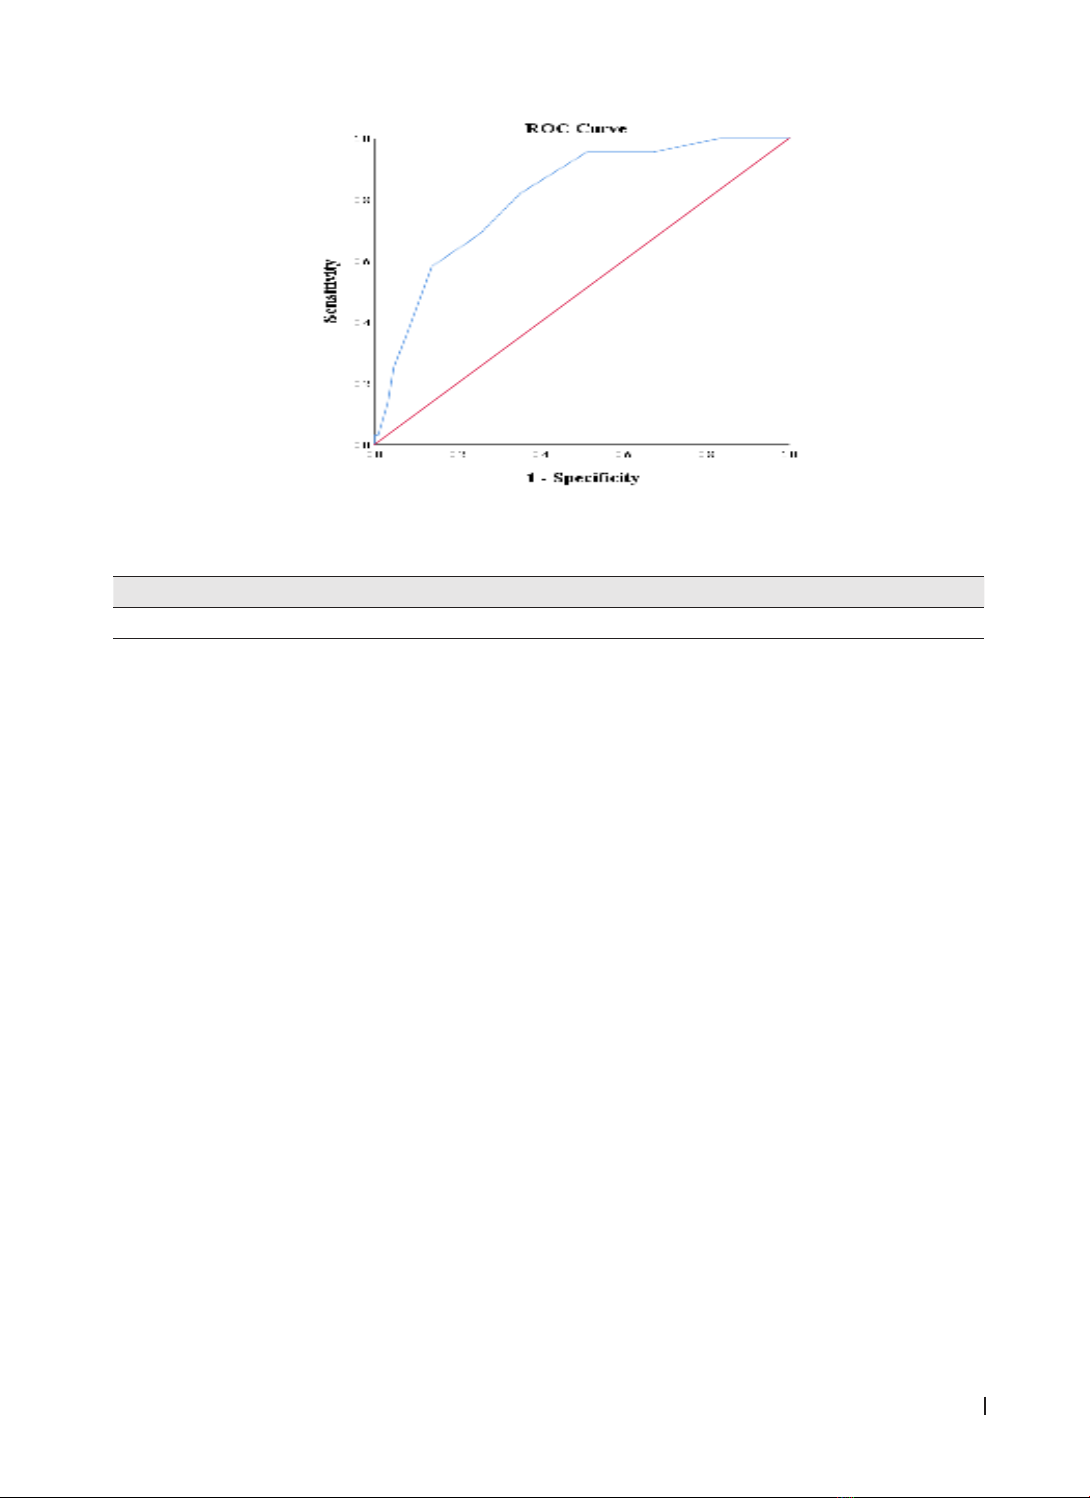
insignificant difference between TMD and non-TMD group. By extracting the 8th question with the cutoff
point at 22.5, the sensitivity and specificity of the modified questionnaire was 82.1% and 64.9% respectively
and the Cronbach Alpha value mildly increased to 0.692. Conclusion: The FAI is suited for screening patients
with TMD because of its high sensitivity. However, FAI low specificity makes it not optimal for efficiently
diagnosing TMD. It is suggested to modify the FAI by eliminating the 8th question in the questionnaire and
have a higher cutoff point (23).
Keywords: accuracy, reliability, Fonseca Anamnestic Index, Temporomandibular disorders, adjustments.
1. INTRODUCTION
Temporomandibular disorders (TMD) are a
medical condition that affect the masticatory muscle,
temporomandibular joints (TMJs), and other related
structures [1]. The three main symptoms of TMD
includes orofacial pain, movement reduction of the
jawbone (mandibular movement dysfunction), and
abnormal temporomandibular joint sound [2]. The
most common group age of TMD is between 20 - 40
years old. The incidence rate of TMD in women is
higher than men [3, 4]. A number of epidemiological
studies have indicated that TMD is the most prevalent
non-dental cause of orofacial pain. Approximately
40-60% of the general population exhibit signs
and symptoms of TMD; 41% of this group report
experiencing at least one symptom related to TMD,
while 56% show at least one clinical sign [1]. The
results of various studies, both in the world and in
Vietnam show that TMD is a common issue. A study
by Bertoli F. (2018) on Brazilian adolescents found
that 34.9% had symptomatic TMD [5]. Wieckiewicz
M.s research (2014) on university students in Poland
reported a TMD prevalence of 54% [6]. In Vietnam,
Hoang A. carried out a research in 2015 that
examined 201 Dental students at Hue University of
Medicine and Pharmacy, uncovering that 72.6% of
the students demonstrated the presence of at least
once indications or symptoms of TMD [7].
As TMD are a multifactorial disorders [4], a
comprehensive tool is required to assess TMD in
all perspectives. There are several instruments
currently used around the world, but the current
accepted golden standard for diagnosing TMD
is the Diagnostic Criteria of Temporomandibular
Disorder (DC/TMD). DC/TMD is a comprehensive
tool with 2 axes: Axis I is for clinical examination
and Axis II provides assessment for pain behavior,
psychological status and psychosocial functioning.
However, it is not suitable to apply DC/TMD in
epidemiological studies and clinical classification,
due to its prolonged procedure, requirement for
training and complex diagnosing process. Therefore,
to facilitate the need of a quick and simple
assessment tool, Fonseca Anamnestic Index (FAI)
was proposed to examine the prevalence of TMD in
clinical and community samples [8, 9].
Corresponding author: Nguyen Gia Kieu Ngan. Email: ngkngan@huemed-univ.edu.vn
Received: 30/11/2023; Accepted: 10/6/2024; Published: 25/6/2024
DOI: 10.34071/jmp.2024.4.6
HUE JOURNAL OF MEDICINE AND PHARMACY ISSN 3030-4318; eISSN: 3030-4326
46
Hue Journal of Medicine and Pharmacy, Volume 14, No.4/2024
FAI was created based on the Helkimo Anamnestic
Index [10], including 10 questions that categorize
patients into 4 groups according to the severity of
TMD: TMD-free, mild TMD, moderate TMD and severe
TMD. FAI was originally in Portuguese [10] and then
translated into English [11] and Chinese [12]. For FAI to
be used in Vietnam, it must be validated and assessed.
Therefore, this research was conducted to achieve the
following purposes:
1. To evaluate the accuracy and reliability of the
FAI in diagnosing Odonto-Stomatology students with
TMD at Hue University of Medicine and Pharmacy;
2. To suggest adjustments to enhance the clinical
value of FAI.
2. MATERIALS AND METHODS.
2.1. Subjects
The study was conducted with 198 students from
year 1 to year 6, majoring in Odonto-Stomatology
at Hue University of Medicine and Pharmacy. The
data was collected from August 2022 to December
2022. The exclusion criteria include students
who were experienced orofacial swelling or pain
caused by infection or trauma of the head and face,
systemic diseases such as rheumatoid arthritis and
polyarthritis, a history of joint trauma or mandibular
condyle fracture or students who were undergoing
orthodontics treatment.
2.2. Study method:
This was a cross-sectional study on total 198
students.
(n = Z2
1-α/2 )
In which:
ese: Expected sensitivity. Since this study
examined the screening value of two diagnostic
questionnaires and was based on the study of Min-
juan Zhang and colleagues on the sensitivity of the
Fonseca questionnaire [12], pse = 0.96 should be
chosen.
p: Prevalence of TMD in previous studies. In the
study on subjects and the same evaluation criteria,
the rate of dental students with TMD was 30%,
p = 0.3 [13])
Each patient initially filled out the Fonseca
Questionnaire (FAI), then underwent a complete
DC/TMD diagnosing procedure by filling in the
Symptom Questionnaire (SQ), getting clinically
examined by doctors with the Examine Form (EF) of
DC/TMD. Signs and symptoms were analyzed based
on the DC/TMD Decision Trees to classify patients
into subtypes of TMD [2]. Results from FAI were
accordingly compared with the diagnosis of DC/
TMD as a golden standard to assess the sensitivity,
specificity of the FAI, and calculated the degree
of agreement between FQ and DC/TMD using
Cohen’s Kappa. Additionally, receiver operating
characteristics (ROC) curve would be analyzed to
determine the optimal cutoff point and calculate the
Area under curve (AUC).
SQ, EF and FAI were translated into Vietnamese
by a TMJ specialist with an eligible English level.
Only one doctor, who got the certificate of DC/
TMD Clinical Training and Calibration, performed
the translating DC/TMD documents and assessing
all the patients in this study. The FAI answers were
scored as follows: “yes = 10”; “sometimes = 5”; “no
= 0”. All participants were then classified into 4
groups accordingly: TMD-free (0 - 15), having mild
TMD (20 - 40), moderate TMD (45 - 65) and severe
TMD (70 - 100) [10].
Investigated variables consists of:
- (1) Gender: male or female
- (2) Schoolyear: 6 groups - from 1st to 6th year.
- (3) Diagnosis of TMD based on DC/TMD: TMD
and TMD-free
- (4)-(13) Answers of Question 1-10 of the FAI:
“Yes”, “Sometimes”, “No” was equivalent to the
score 10, 5, 0 respectively.
- (14) Classification of TMD into 4 groups based
on total point of FAI: TMD-free (0 - 15), mild TMD
(20 - 40), moderate TMD (45 - 65) and severe TMD
(70 - 100).
- (15) Diagnosis of TMD based on FAI: TMD
(including 3 group from mild to severe TMD) and
TMD-free
- (16) The agreement between DC/TMD and
FAI was calculated with Cohen’s Kappa. Kappa
coefficient (k) values of 0.40, 0.41 - 0.60, 0.61 -
0.80 and > 0.80 indicated poor, moderate, good and
excellent agreement, respectively.
- (17) Receiver operating characteristics (ROC)
curves were implemented to calculate the accuracy
(area under the curve - AUC) of the FAI for the TMD
group. The following AUC classification was applied:
attributable to chance (≤ 0.5), low (> 0.5 - 0.7),
moderate (> 0.7 - 0.9), and high (> 0.9 - 1.0) levels
of accuracy.
- (18) Sensitivity (Sensitivity = True Positive/(True
Positive + False Negative)), specificity (specificity =
True Negative/(False Positive + True Negative)),
PPV (positive predictive value; PPV = True Positive/
(True Positive + False Positive)), NPV (negative
predictive value; True Negative/(False Negative +
HUE JOURNAL OF MEDICINE AND PHARMACY ISSN 3030-4318; eISSN: 3030-4326 47
Hue Journal of Medicine and Pharmacy, Volume 14, No.4/2024
True Negative)).
The collected data were processed and
statistically analyzed using SPSS 20.0 software.
Descriptive data were shown in numbers,
percentages, mean, and standard deviation. A
p-value less than 0.05 is statistically significant.
The accuracy of the FAI questionnaire was assessed
using the following metrics: sensitivity, specificity,
NPV, PPV, area under the curve (AUC), and Cohen’s
kappa value. The reliability of the FAI questionnaire
was evaluated by calculating its internal consistency
using the Cronbach’s alpha value.
3.2 Sensitivity and specificity of FAI Questionnaire
Based on FAI, patients diagnosed with TMD
can be respectively divided into 3 subgroups: mild,
moderate and severe (Table 2). Patients within the
Mild TMD group are the most common, accounting
for 55.6%. Followed by 27.8% classified into TMD-
free group. 15.7% had moderate level while severe
level consisted of 1%.
The FAI Questionnaire demonstrated high
sensitivity (97.01%) and high NPV (96.36%).
Conversely, it exhibited low specificity and PPV
(45.46%) (Table 3). The Kappa coefficient, calculated
using Cohen’s Kappa, was 0.293. The internal
consistency of the FAI, assessed using Cronbach’s
alpha, yielded a value of 0.684.
Analyzing the ROC curve, the evaluated AUC was
0.806 (p < 0.05). It was suggested that by increasing
the cutoff point to 22.5, the FAI would maintain
high sensitivity (89.6%) while improving specificity
(57.3%) (Figure 1; Table 4).
Table 2. Prevalence and classification of patients with temporomandibular disorders (TMD) according to FAI
Patients with TMD
TMD-free Mild Moderate Severe Total
N55 110 31 2 198
%27.8 55.6 15.7 1.0 100.0
Table 3. Sensitivity, specificity, positive predicted values and negative predicted values of FAI in
accordance with DC/TMD.
Sensitivity Specificity PPV NPV Cohen Kappa Cronbach Alpha
97.01% 40.46% 45.46% 96.36% 0.293 0.684
3. RESULTS
3.1. Study sample characteristicss
Students who did not meet the criteria and have incomplete data were excluded.
This study includes a total of 198 students from the Faculty of Odonto-Stomatology at Hue University
of Medicine and Pharmacy, randomly selected from 1st Year to 6th Year with the male: female ratio is 1:2
(based on the actual gender ratio in the Faculty of Ondonto-Stomatology). Specifically, there are 129 females
(65.2%) and 69 males (34.8%) in this study.
According to DC/TMD, the prevalence of TMD in the research sample is 33.8% (Table 1). There’s no
statistical difference between the percentage of patients with TMD between 2 genders (p > 0.05).
Table 1. The prevalence of patients with temporomandibular disorders (TMD) between genders.
Diagnosis
Gender
TMD TMD-free Total p-value
N%N%N%
Male 22 11.1 47 23.7 69 34.8
p > 0.05
Female 45 22.7 84 42.4 129 65.2
Total 67 33.8 131 66.2 198 100.0
HUE JOURNAL OF MEDICINE AND PHARMACY ISSN 3030-4318; eISSN: 3030-4326
48
Hue Journal of Medicine and Pharmacy, Volume 14, No.4/2024
Figure 1. ROC (receiver operating characteristic) Curve for FAI
Table 4. Sensitivity, specificity and AUC (area under curve) of FAI at the cutoff point of 22.5
Cut-off point Sensitivity Specificity AUC
22.5 89.6% 57.3% 0.806
3.3. Reliability of each items in FAI
The highest mean score difference between TMD and TMD-free group is the 7th Question in the FAI (FQ7
- Have you ever noticed any noise in your temporomandibular joint while chewing or opening your mouth?).
The 8th question from FAI (FQ8 - Do you have any habits such as clenching or grinding your teeth?) is the item
had the lowest mean difference and the only item with the insignificant mean score difference between TMD
and TMD-free (p > 0.05) (Table 5).
Executing ROC analysis after eliminating the 8th question, AUC had increased to 0.811 (p < 0.05) (Figure
2). Suggested cutoff point for the modified questionnaire is 22.5. At that cutoff point, the sensitivity and
specificity of FAI questionnaire is 82.1% and 64.9% respectively (Table 6).
Table 5. Meaning of each FAI question in diagnosing TMD and internal consistency.
Question
Mean score Mean difference
between TMD and
TMD-free
Corrected item-total
correlation
Internal consistency
(Cronbach’s alpha) if
item deleted
TMD TMD-free
FQ1 1.42 0.23 1.19 0.32 0.67
FQ2 1.49 0.49 1.00 0.32 0.67
FQ3 4.25 2.18 2.07 0.54 0.63
FQ4 4.70 3.24 1.46 0.43 0.64
FQ5 4.40 3.02 1.38 0.33 0.67
FQ6 2.91 1.18 1.73 0.47 0.64
FQ7 4.55 1.45 3.10 0.41 0.65
FQ8* 2.99 2.33 0.66 0.18 0.69
FQ9 4.03 2.37 1.66 0.17 0.70
FQ10 6.57 5.08 1.49 0.42 0.65
Using Mann-Whitney U Test: for FQ8: p > 0.05; for others: p < 0.05
HUE JOURNAL OF MEDICINE AND PHARMACY ISSN 3030-4318; eISSN: 3030-4326 49
Hue Journal of Medicine and Pharmacy, Volume 14, No.4/2024
Figure 2. ROC curve after extracting the 8th question.
Table 6. Sensitivity, specificity and AUC of the modified FAI questionnaire (After extracting the 8th
question) at the cutoff point of 22.5.
Cut-off point Sensitivity Specificity AUC Cronbach Alpha
22.5 82.1% 64.9% 0.811 0.692
4.DISCUSSION
4.1. Clinical characteristic of TMD.
The research includes 198 students majoring in
Odonto-Stomatology at Hue University of Medicine
and Pharmacy, with the sample age range of 18 - 24.
The prevalence of students with TMD in the study
was 33.8% (Table 1). This result was consistent with
the study by Wu J. (2021) and Srivastava K. (2021),
which the TMD prevalence were 31.7% [14] and
36.9% [15], respectively. This similarity may be due
to the use of the same sample type ( university
students in the medicine and dentistry field) and the
use of DC/TMD as diagnostic instrument. However,
the TMD prevalence in the study by Do H. (2012) on
medical students at Thai Nguyen University reached
83.8%, with a 100% prevalence of joint noises,
possibly due to the use of a stethoscope to detect
joint noises, which may lead to false positives [16].
According to the study by author Hoang A. in 2016,
also including Odonto-Stomatology students at Hue
University of Medicine, the TMD prevalence was
very high at 72.6%, possibly because the authors
diagnostic criteria included at least one symptoms
or signs of TMD, such as joint sounds, jaw fatigue,
pain during movement, pain when palpating the
joint muscles, and reduction in mouth opening [7].
The study also revealed no significant difference
in the TMD prevalence between male and female
groups. The findings align with Do H.s study (2012)
on medical students at Thai Nguyen University
of Medicine, which showed no gender-related
correlation with TMD [16]. Modi P.s study in 2012
also demonstrated a similar result, concluding that
there was no relationship between TMD and gender
in medical and dental students in India [17].
4.2. Evaluation of the FAI Questionnaire’s
accuracy and reliability in diagnosing TMD
Regarding the questionnaire’s accuracy, the FAI
exhibited high sensitivity (97.01%) and high NPV
(96.36%), making it suitable for screening TMD
patients (Table 3). However, its specificity was low
(40.46%), rendering it less effective in identifying
patients without TMD. This finding aligns with Stasiak
G.s study (2020), which used the RDC/TMD as the
diagnostic instrument and reported that sensitivity
and specificity of the FAI were 97.21% and 26%,
respectively [18]. Therefore, the FAI questionnaire
could be utilized as an initial screening tool in the
diagnostic model for TMD. Conversely, Zhang M.s
study (2019), involving 613 TMD patients diagnosed
using DC/TMD and 57 patients without TMD, found
that the Chinese version of the FAI questionnaire
had higher accuracy, with sensitivity at 95.9% and
specificity at 71.9% [12]. This discrepancy may
be attributed to the characteristics of the sample,
specifically the larger number of TMD patients (613)
compared to the control group (57).
The Kappa’s coefficient value indicated