
A functional polymorphism of apolipoprotein C1 detected
by mass spectrometry
Matthew S. Wroblewski
1
, Joshua T. Wilson-Grady
1
, Michael B. Martinez
1
, Raj S. Kasthuri
2
,
Kenneth R. McMillan
3
, Cristina Flood-Urdangarin
4
and Gary L. Nelsestuen
1
1 Department of Biochemistry, Molecular Biology and Biophysics, University of Minnesota, Minneapolis, MN, USA
2 Department of Medicine, University of Minnesota, Minneapolis, MN, USA
3 American Indian Community Development Corporation, Minneapolis, MN, USA
4 St Mary’s Health Clinics, St Paul, MN, USA
Apolipoprotein C1 (ApoC1) is a component of very-
low-density lipoproteins (VLDLs), intermediate classes,
and high-density lipoproteins (HDLs). It has several
potential functions. It helps to maintain HDL structure
and activates plasma lysolecithin acyltransferase. It is
also able to modulate the interaction of apolipoprotein
E with b-migrating VLDLs and inhibit binding of
b-VLDL to low-density lipoprotein receptor-related
protein [1,2]. It is implicated in regulation of several
lipase enzymes [3–5]. An N-terminal 38-residue form of
ApoC1 is able to inhibit cholesterol ester transferase
[6]. ApoC1 accounts for inhibition of cholesterol ester
transferase by HDL [7]. Thus, ApoC1 has a number of
potential functions that may be important in vivo.
Known variants of the ApoC1 gene are limited to un-
translated regions of the gene, synonymous mutations
of the coding sequence and a number of variants of the
intron regions of the gene (NCBI database for ApoC1).
An important functional variant is found in the promo-
ter region where complex factors [8,9] may link ApoC1
expression levels to familial dysbetalipoprotemia, car-
diovascular disease, and Alzheimer’s disease [10–12].
Overexpression of human ApoC1 in the mouse produ-
ces a hyperlipidemic condition [4,13] with possible
beneficial effects for diabetes [14,15]. Hyperlipidemia
may result from increased inhibition of b-VLDL bind-
ing to the receptor and reduced clearance of VLDLs
from the circulation. Variants of ApoC2 and ApoC3
have been linked to metabolic disease [16–18]. This
study reports the first case of a structural variant of
ApoC1 as well as some protein properties that suggest
the functional significance of this residue change. They
Keywords
apolipoprotein C1; mass spectrometry;
polymorphism; protein–lipid contact surface
Correspondence
G. L. Nelsestuen, 6–155 Jackson Hall,
321 Church St SE, Minneapolis, MN 55455,
USA
Fax: +612 625 2163
Tel: +612 624 3622
E-mail: nelse002@umn.edu
(Received 7 July 2006, revised 16 August
2006, accepted 18 August 2006)
doi:10.1111/j.1742-4658.2006.05473.x
A survey of plasma proteins in approximately 1300 individuals by
MALDI-TOF MS resulted in identification of a structural polymorphism
of apolipoprotein C1 (ApoC1) that was found only in persons of American
Indian or Mexican ancestry. MS ⁄MS analysis revealed that the alteration
consisted of a T45S variation. The methyl group of T45 forms part of the
lipid-interacting surface of ApoC1. In agreement with an impact on lipid
contact, the S45 variant was more susceptible to N-terminal truncation by
dipeptidylpeptidase IV in vitro than was the T45 variant. The S45 protein
also displayed greater N-terminal truncation (loss of Thr-Pro) in vivo than
the T45 variant. The S45 variant also showed preferential distribution to
the very-low-density lipoprotein fraction than the T45 protein. These prop-
erties indicate a functional effect of the S45 variant and support a role for
residue 45 in lipid contact and lipid specificity. Further studies are needed
to determine the effects of the variant and its altered N-terminal truncation
on the metabolic functions of ApoC1.
Abbreviations
ApoC1, apolipoprotein C1; ApoC2, apolipoprotein C2; ApoC3-0, ApoC3 that does not contain a carbohydrate chain; ApoC3-1, ApoC3 with a
GalNAc-Gal-sialic acid carbohydrate chain; ApoC3-2, ApoC3 containing the carbohydrate of ApoC3-1 plus an additional sialic acid residue;
DPPase, dipeptidylpeptidase IV; HDL, high-density lipoprotein; TTr, transthyretin; VLDL, very-low-density lipoprotein.
FEBS Journal 273 (2006) 4707–4715 ª2006 The Authors Journal compilation ª2006 FEBS 4707
also suggest approaches that might be used to deter-
mine the role of N-terminal truncation of ApoC1.
Results
Profile analysis
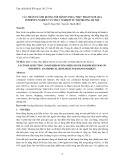
The MALDI-TOF mass spectrometer detects m⁄zval-
ues that generally equate to protonated molecules.
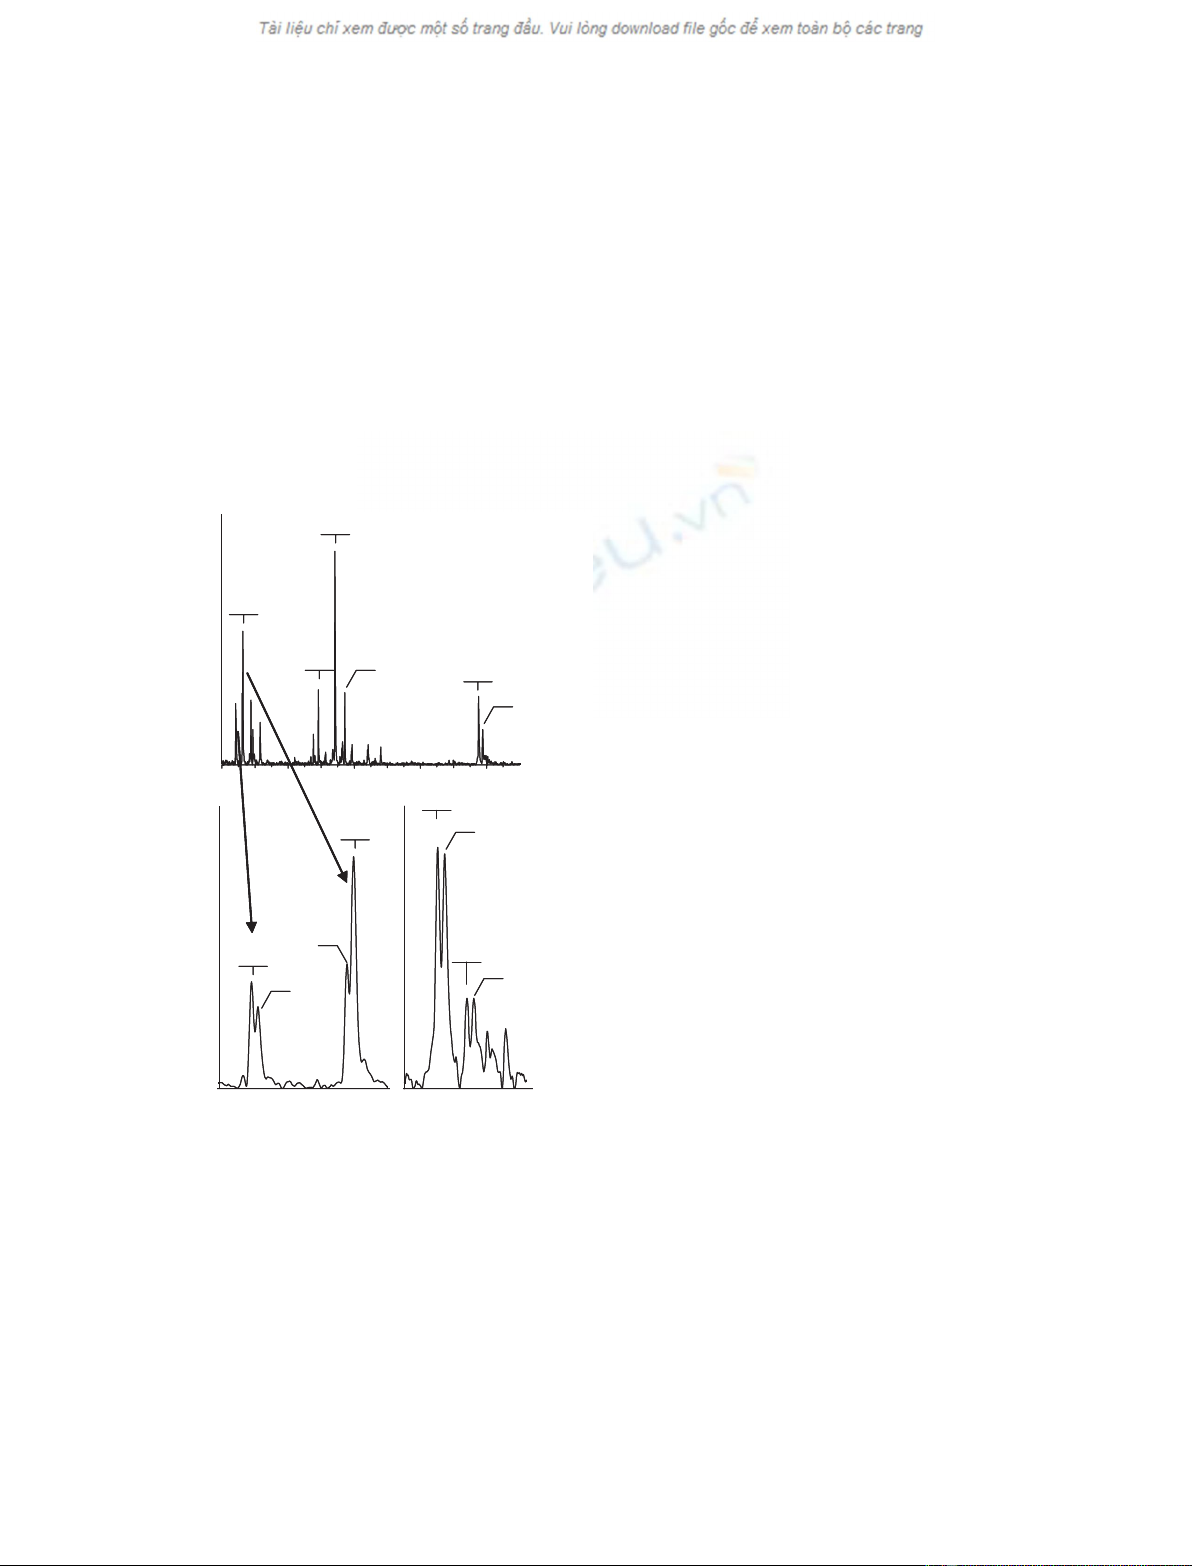
Figure 1A shows an overview of the plasma protein
profile. Briefly, peak identification was accomplished
by comparison of m⁄zvalues with those of known
plasma proteins, Edman degradation of the entire sam-
ple with observed removal of mass appropriate for the
expected N-terminal residue of each component,
and ⁄or C-terminal degradation by carboxypeptidase
with removal of mass appropriate for the expected res-
idues of each protein. An additional approach used
protein reactivity with disulfide reagents such as dithio-
threitol and iodoacetamide, with quantification of Cys
by detection of mass change of a peptide after reduc-
tion and alkylation. These and other approaches have
been described previously [19], and components that
are important to this study are summarized in the
legend to Fig. 1. Figure 1B shows an expanded view of
the ApoC1 proteins from this individual who showed
a double peak for each of the two forms of ApoC1.
This double peak pattern was highly unusual and was
not observed in over 1000 individuals with ancestry of
Europe, Africa and Asia. Forty-four instances of this
pattern were found among 314 people who identified
themselves as having American Indian and ⁄or Mexican
ancestry. Fig. 1C shows an expanded view of the
transthyretin (TTr) components from the profile of a
different individual who displayed a double peak pat-
tern that suggested a common polymorphism of TTr.
Many plasma proteins are present in multiple forms.
For example, ApoC1 is present as the full-length pro-
tein (m⁄z¼6632) and as a truncated form lacking
N-terminal Thr-Pro [19,20] (m⁄z¼6434, Fig. 1). TTr
exists as an unmodified protein (m⁄z¼13762) and as
a form that is disulfide-linked to cysteine (m⁄z¼
13881, Fig. 1). Polymorphisms appear as a double
peak for each form of a given protein. The peaks differ
by the mass change produced by the amino-acid sub-
stitution. Figure 1C shows the example of a commonly
observed double peak for TTr with a second compo-
nent that is 30 atomic mass units (amu) higher than
the common form. This double peak for TTr was
observed in 13% of samples and may represent a
common G6S variant [21].
Of greater interest were the unusual components
occurring at 14 amu below full-length and truncated
ApoC1. All examples of the pattern in Fig. 1 showed
the same general characteristics. That is, the peak
occurring 14 amu below full-length ApoC1 was much
less intense than the peak for full-length ApoC1; the
peak at 14 amu below truncated ApoC1 was equally
as intense as or slightly more intense than the peak
from truncated ApoC1. It is possible that all instances
of this novel profile feature pattern arose from the
same modification and were genetically determined.
Structural change
ApoC1 from a person with the double peak profile in
Fig. 1B was isolated as described in Experimental
13762
m/z
6632
6618
6420
6434
6632
13881
13762
13792
13881
13911
ApoC1 TTr
TTr
Intensity
B
A
C
9422
9713
8915
Fig. 1. MALDI-TOF profile of plasma from an individual containing
the unusual profile. (A) The profile from m⁄z¼6000–15 000. Sev-
eral peaks are labeled with their m⁄zvalues. (B) Expanded view of
the ApoC1 portion of the profile in (A). Important components of
the profile include: ApoC1 (m⁄z¼6632) and its truncated form
(m⁄z¼6434), an ApoC1 variant (m⁄z¼6618) and its truncated
form (m⁄z¼6420). (C) Expanded view of the TTr portion of the
profile from a person who displayed a commonly observed double
peak for TTr. The m⁄zvalues and suggested protein identities are:
13762, the common form of TTr; 13881, the common form of TTr
disulfide-linked to cysteine; 13792, a variant form of TTr that may
consist of G6S change; 13911, the variant protein that is disulfide-
linked to cysteine.
Structural polymorphism of apolipoprotein C1 M. S. Wroblewski et al.
4708 FEBS Journal 273 (2006) 4707–4715 ª2006 The Authors Journal compilation ª2006 FEBS
procedures, digested with Glu-C protease, and the pep-
tides subjected to MS. The peptide mass fingerprint
from MALDI-TOF MS showed m⁄zvalues corres-
ponding to all eight theoretical peptides plus the
peptide of the truncated protein (residues 1–13,
TPDVSSALDKLKE, theoretical mass ¼1402.7 amu;
residues 3–13 (the truncated protein), 1204.7 amu; resi-
dues 14–19, FGNTLE, 680.3 amu; residues 20–24,
DKARE, 618.3 amu; residues 25–33, LISRIKQSE,
1073.6 amu; residues 34–40, LSAKMRE, 834.4 amu;
residues 41–44, WSFE, 568.2 amu; residues 45–51,
TFQKVKE, 879.5 amu; residues 52–57, KLKIDS,
703.4 amu). Only peptide 45–51 showed a second peak
that was 14 ± 0.1 amu lower (Table 1).
The parent peptide (m⁄z¼879.467, residues 45–51
of ApoC1) provided four potential mutations that
would result in loss of 14 amu (T45S, Q47N, K48N,
K50N). Cleavage by Glu-C protease established that
the C-terminal Glu was unaltered. The observed mass
difference (14.003 amu, Table 1) represented a
60 p.p.m. error for peptides of m⁄z¼879 and 865 that
differ by a K ⁄N mutation (theoretical difference ¼
14.056 amu). This was greater than expected for this
instrument when used for internal comparison of two
ions. The theoretical differences for Q47N or T45S
(14.016 amu) were within the expected error (15 p.p.m).
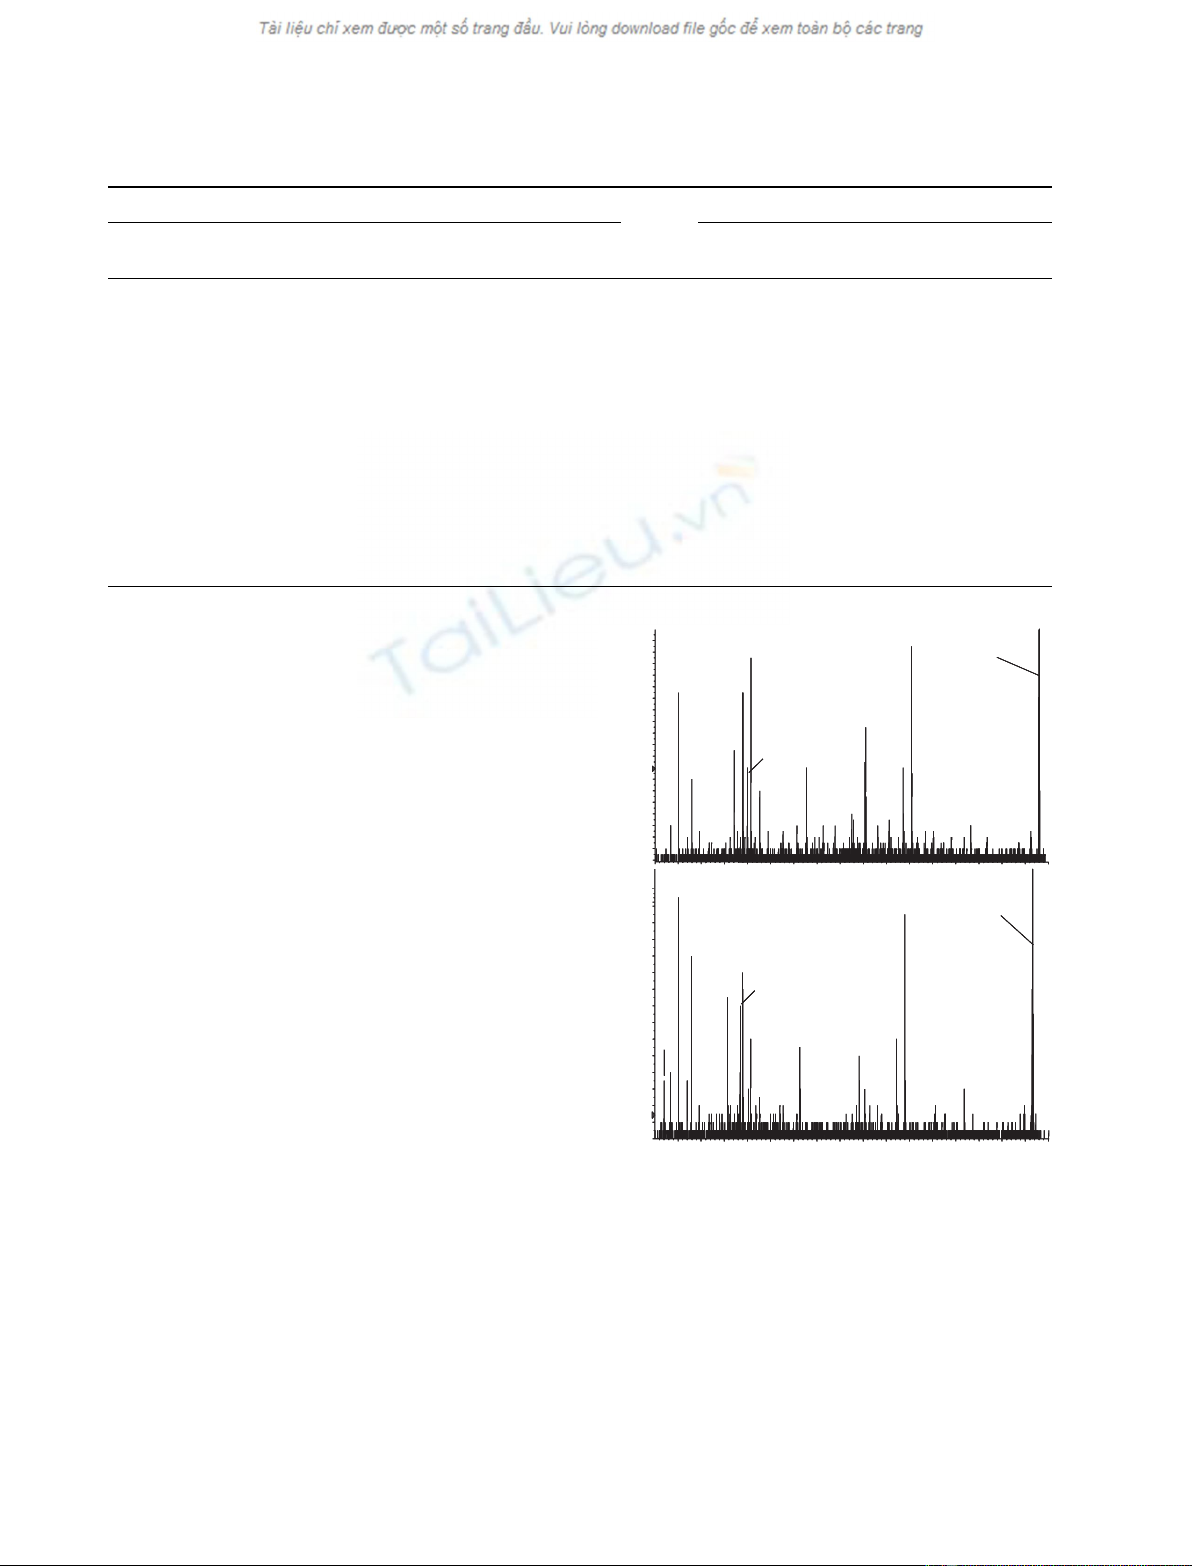
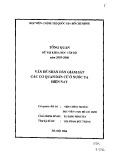
MS ⁄MS analysis (Fig. 2 and Table 1) confirmed the
T45S difference. Peptide fragmentation at the C–N
peptide bond gives b ions from the N-terminus and y
ions from the C-terminus (Table 1). Cleavage at the
C–C bond provides a ions from the N-terminus. All
ions from the N-terminus were 14 amu lower for the
m⁄z¼865.465 peptide, whereas all ions from the
C-terminus as well internal ions were identical for the
two peptides. Detection of the same ions with similar
relative intensities (Fig. 2) established the near identity
Table 1. MS ⁄MS analysis of relevant ApoC1 peptides identified by BIOANALYST software. To conserve space, ions are rounded to 1 decimal
place. The m⁄zvalues were accurate to three places. ND, not determined.
879.468 peptide (TFQKVKE) 865.465 peptide (SFQKVKE)
(N-terminal ions)
observed ⁄theoretical
(C-terminal ions)
observed ⁄theoretical
(N-terminal ions)
observed ⁄theoretical
(C-terminal ions)
observed ⁄theoretical
(b
1
-H
2
O)84.0 ⁄84.0 – (b
1
-H
2
O)ND –
(b
1
)ND (y
6
)ND (b
1
)ND (y
6
)ND
(b
2
)249.1 ⁄249.1 (y
5
)ND (b
2
)235.1 ⁄235.1 (y
5
)ND
(b
3
)377.2 ⁄377.2 (y
4
)503.3 ⁄503.3 (b
3
)363.2 ⁄363.2 (y
4
)503.3 ⁄503.3
(b
4
)505.3 ⁄505.3 (y
3
)ND (b
4
)491.3 ⁄491.3 (y
3
)ND
(b
5
)604.4 ⁄604.4 (y
2
)276.2 ⁄276.2 (b
5
)590.3 ⁄590.3 (y
2
)276.1 ⁄276.2
(b
6
)732.5 ⁄732.4 (y
1
)ND (b
6
)718.4 ⁄718.4 (y
1
)ND
(a
2
)221.1 ⁄221.1 – (a
2
)207.1 ⁄207.1 –
(a
5
)576.4 ⁄576.4 – (a
5
)562.3 ⁄562.3 –
Internal ions common to both peptides
(Immonium of Q) 101.1 ⁄101.1 (Internal QK) 257.2 ⁄257.2
(Immonium of F) 120.1 ⁄120.1 (Internal QK-H
2
O) 239.2 ⁄239.2
(K rearrangement) 129.1 ⁄129.1 (Internal QK-NH
3
) 240.1 ⁄240.1
(Immonium of K-NH
3
) 84.08 ⁄84.08 –
b
5
257
101
239
240
A
300
-
Intensity, counts
0
10
20
30
879
129
a
2
b
6
b
5
-H20
b
4
b
3
b
2
y
2
y
4
100 200 400 500 600 700 800
m/z
0
10
20
30
b
5
b
6
b
4
b
3
b
2
a
2
129
257 b
5
H20
865
y
2
y4
101
239
240
B
70
120
84 861
Fig. 2. MS ⁄MS spectra of peptides of m⁄z¼879.468 (top panel)
and 865.465 (bottom panel). The a, b and y ions are labeled and
presented in Table 1. Internal ions are labeled by m⁄zvalues roun-
ded to the nearest mass unit.
M. S. Wroblewski et al.Structural polymorphism of apolipoprotein C1
FEBS Journal 273 (2006) 4707–4715 ª2006 The Authors Journal compilation ª2006 FEBS 4709
of the two peptides, except for the N-terminus. The
T45S mutation requires a single base change (A267T,
accession number X00570).
Altered distribution of the S45 variant in VLDLs
compared with HDLs
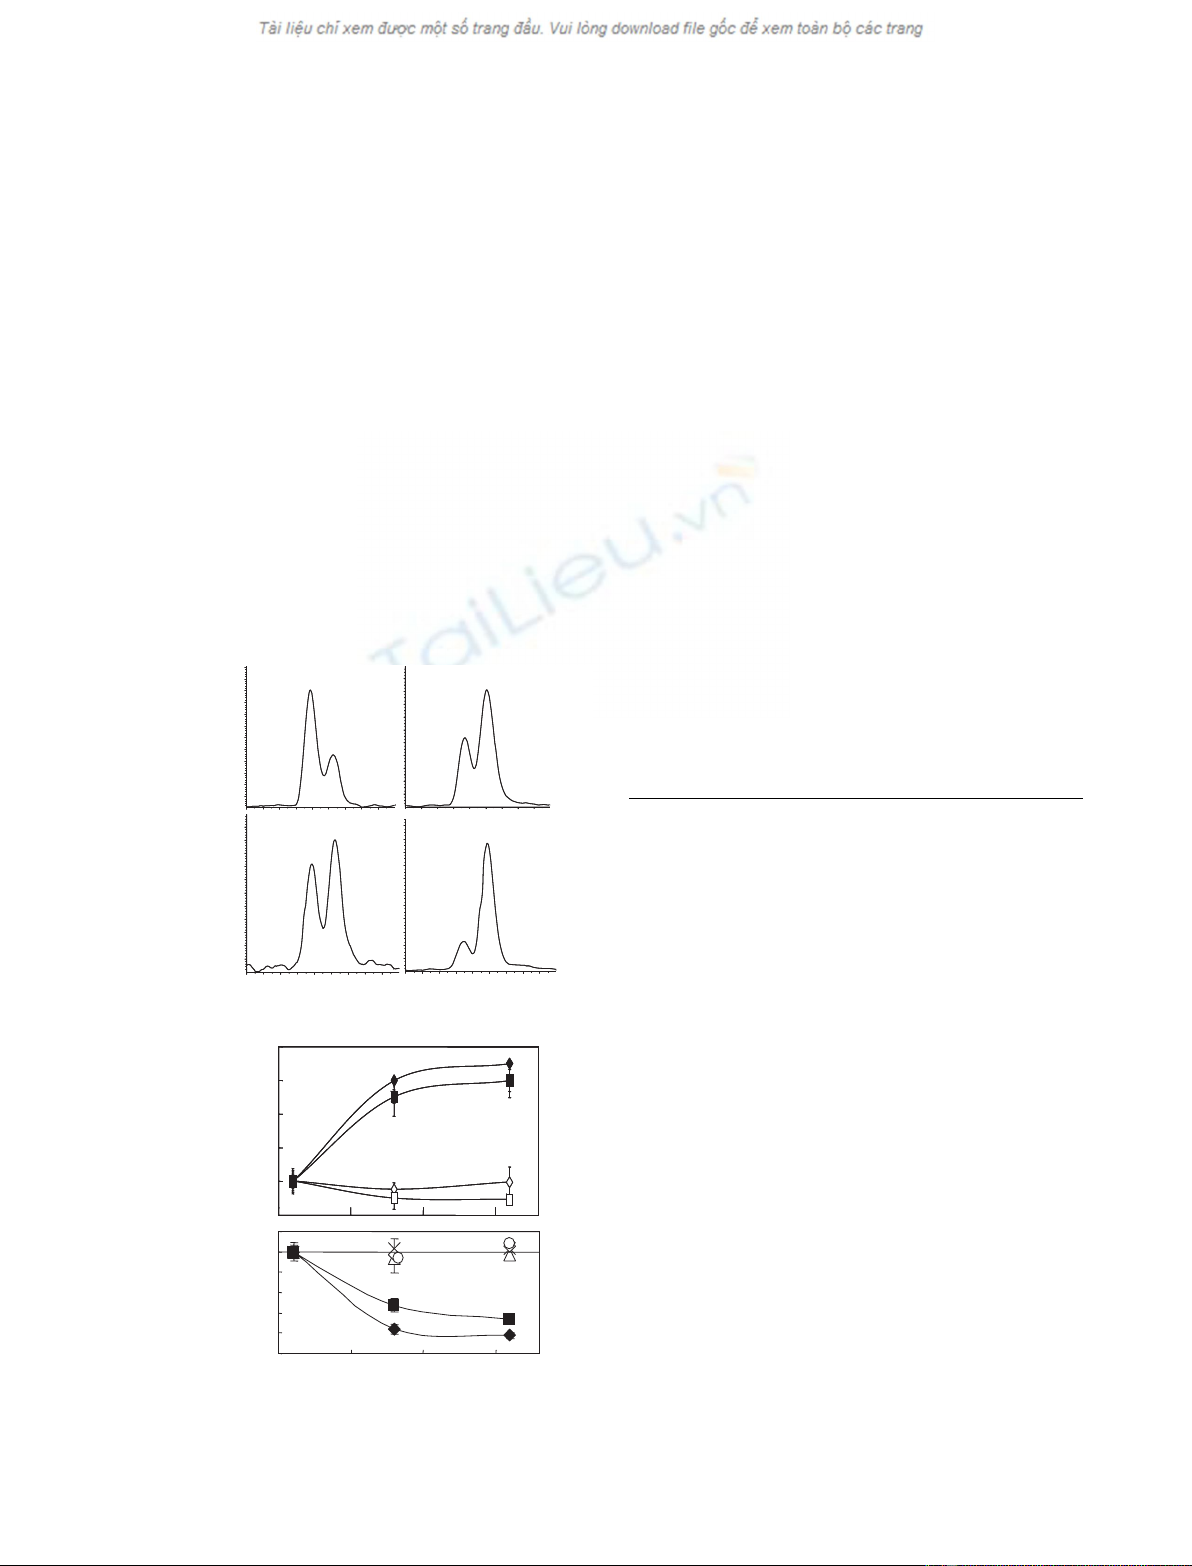
Ultracentrifugation of plasma partially separates lipo-
protein classes. VLDLs float to the top (fraction 1,
Fig. 3), while HDLs sediment near the middle and bot-
tom of the tube. Earlier studies showed that peak
intensity ratios provide an estimate of the relative pro-
tein ratios in different samples [19]. As expected from
known distributions of the apolipoproteins, the relative
abundance determined by peak intensity ratios of
ApoC2 (m⁄z8915) and ApoC3 (sum of m⁄z¼8765,
9422, 9642 and 9713) to ApoC1 was greatest in VLDL
fractions and declined in HDL fractions (Fig. 3F).
With the same approach, the S45 variant of ApoC1
partitioned more to the VLDL fraction than the T45
variant (compare Fig. 3A and 3B with 3C and 3D).
The mean ± SD from triplicate runs for three frac-
tions was determined (Fig. 3E). A single analysis of
every fraction showed that the primary change
occurred between fractions 3 and 8 (not shown), as
expected for the transition from VLDL to HDL and
other classes of lipoproteins. In the experiment shown,
the S45 variant of ApoC1 showed 1.6-fold greater
abundance than the T45 variant in VLDLs (fraction 1)
compared with HDLs (fractions 8 and 16, Fig. 3E).
This enrichment of the low-mass component in VLDLs
was observed in all eight people whose plasma was
analyzed by this method (average difference ¼1.5-
fold). Once again, single profiles taken of each fraction
showed that the majority of change occurred between
fractions 3 and 8.
Selective incorporation of other protein isoforms in
VLDLs compared with HDLs was not observed. For
example, the ratios of truncated to full-length ApoC1
were constant across the ultracentrifuge fractions for
both the S45 and T45 variants (open symbols, Fig. 3E)
as were the ratios of four isoforms of ApoC3 (open
symbols, Fig. 3F). This suggests that the T45S change
had altered the lipid-interaction site in a manner that
changed lipid-binding specificity.
m/z
500
1000 2000
Intensity
A B
2000
6600 6640
6400 6440
C D
6420
6434
6618
6632
VLDL
HDL
Fraction No.
Relative Peak ratio
0 5 10 15
F
0
0.4
0.8
1.0
1.4
E
Fig. 3. Differential distribution of apolipoproteins plus isoforms and
variants in VLDLs compared with HDLs. (A, C) Relevant sections of
profiles (2000 laser shots, attenuation 44) showing truncated forms
of ApoC1 (m⁄z¼6434 and 6420) in fractions 1 and 9 of the ultra-
centrifuge tube, respectively. Fraction 1 represents VLDLs at the
top of the tube. (B, D) Relevant sections of profiles showing full-
length forms of ApoC1 (m⁄z¼6632 and 6618) in fractions 1 and 9
of the ultracentrifuge tube, respectively. (E) Relative peak intensity
ratios for the T45:S45 variants of the full-length (m⁄z¼6618 ⁄6632,
r) and truncated (m⁄z¼6420 ⁄6434, n) forms of these proteins.
The peak ratio in fraction 1 was assigned a value of 1.0, and the
ratios in subsequent fractions are expressed relative to that value.
Also shown are peak ratios for the full-length to truncated forms of
the T45 variant (m⁄z¼6632 ⁄6434, e) and the S45 variant (m⁄z¼
6618 ⁄6420, h). (F) Peak ratios of lipoprotein isoforms. The ratio of
peak intensities for ApoC2 (m⁄z¼8915, n) to the sum of peaks of
ApoC1 was determined for fraction 1 and assigned a value of 1.0.
The peak ratios in subsequent fractions are expressed relative to
that value. Also shown are the relative ratios of the sum of peaks
from ApoC3 to the sum of peak intensities from ApoC1 (r) and
the ratios of several isoforms of ApoC3 (m⁄z¼8765 : 9713, des-
glycoApoC3-0 ⁄ApoC3-2, n;m⁄z¼9422 : 9713, ApoC3-1 ⁄ApoC3-2,
e;m⁄z¼9642 : 9713, C-terminal truncated ApoC3-2 ⁄ApoC3-2, X;
and m⁄z¼9932 : 9713, an unidentified form of ApoC3
(22) ⁄ApoC3-2, s). Error bars represent the standard deviation of
three measurements. For clarity, only one set of error bars are
shown for the ApoC3 variants. The mean coefficient of variation for
the experimental data points for the ApoC3 ratios was 7%.
Structural polymorphism of apolipoprotein C1 M. S. Wroblewski et al.
4710 FEBS Journal 273 (2006) 4707–4715 ª2006 The Authors Journal compilation ª2006 FEBS
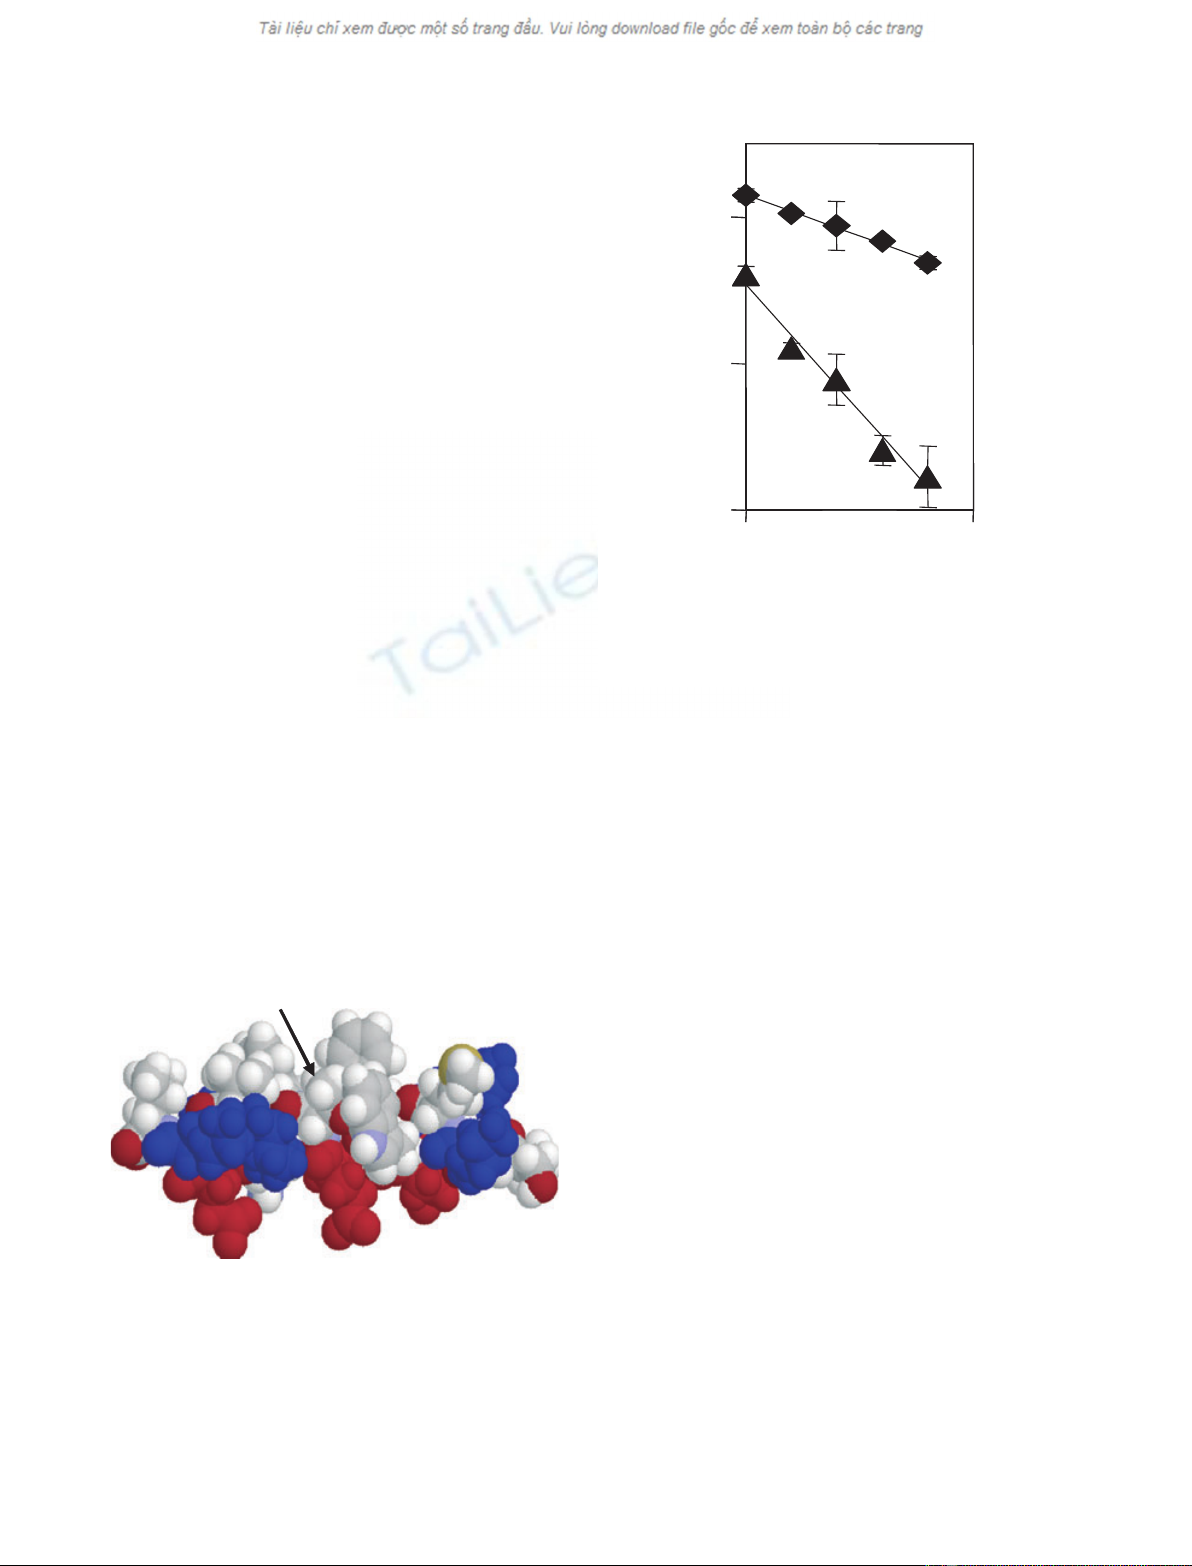
Increased susceptibility to N-terminal truncation
in vivo and in vitro
In the plasma, peak intensity ratios suggested that the
S45 protein was more highly truncated than the T45
protein (Fig. 1). In fact, T45 occurs midway in an am-
phipathic helix that participates in lipid contact [22]
(Fig. 4). The S45 variant would have one fewer methyl
groups at the lipid interface, giving a theoretical differ-
ence in free energy of lipid binding of +0.68 kcalÆmol
)1
[23] and a threefold change in binding constant at
37 C. In agreement with such a difference, degradation
by dipeptidylpeptidase IV (DPPase) in vitro occurred
approximately 3 times faster for the S45 than the T45
variant (Fig. 5). Lower-affinity lipid contact of the S45
protein may have made this protein more susceptible to
N-terminal truncation in vitro as well as in vivo.
Discussion
This study used MS profile analysis to detect an
altered protein pattern in a subgroup of individuals
with American Indian and Mexican ancestry. We have
not observed this pattern in over 1000 persons of other
ethnic backgrounds. MS fragmentation of a novel pep-
tide from one individual indicated a T45S variant of
ApoC1. To our knowledge, this is the first example of
a structural polymorphism of ApoC1 that has been
found. Circumstantial evidence such as mass difference
from the common protein form and an enhanced level
of N-terminal truncation suggested that all persons
who displayed this pattern had the same structural
modification. Further work is needed to confirm this
prediction.
Several lines of evidence suggest that S45 ApoC1
differed functionally from the T45 protein. First of
all, peak intensities in the profile suggest that the S45
protein was more highly processed by N-terminal
truncation than the T45 protein. Use of peak inten-
sity ratios to estimate relative protein abundance
depends on equal crystallization of the protein in the
matrix and equal ionization of the proteins in the
mass spectrometer. This assumption appears quite
good for nearly identical structures [19] such as the
proteins of a polymorphism pair (see also TTr,
Fig. 1C). Other quantitative evaluations presented in
this study were even less dependent on identical prop-
erties. For example, the method used to estimate the
rates of digestion by DPPase and the different distri-
butions of the S45 variant among lipoprotein classes
used comparison of peak ratios in different samples.
The conclusions from these experiments were not
dependent on identical ionization of the two peptides
but only on identical relative ionization of the two
species in different samples.
Variant proteins with identical function are synthes-
ized and utilized at identical rates and should be pre-
sent at equal concentrations in a sample. If the
variants have nearly identical chemical properties, they
should give peaks of identical intensity in the mass
spectrometer. Indeed, most polymorphisms observed in
our studies have presented double peaks of nearly
T45-Methyl
Fig. 4. Molecular model of ApoC1. Structure 1 of the 35–53 pep-
tides of ApoC1 in complex with SDS micelles [22] is depicted in
RASMOL. The helix is in a space-filled model with hydrophobic side
chains projecting upward in cpk color and the N-terminus on the
right. Basic residues are in blue, and acidic residues in red. The
methyl group of T45 is identified.
-0.4
-0.8
-1.2
0 100
Time, min
In(Fraction full length Protein)
Fig. 5. First-order decay plots for degradation of ApoC1 by hog kid-
ney DPPase. Results are for the common (m⁄z¼6632, r,k¼
)0.0022) and low-mass (m⁄z¼6618, m,k¼)0.0069) variants of
ApoC1. MS settings were as described in the legend to Fig. 3.
Means ± SD from three experiments are shown.
M. S. Wroblewski et al.Structural polymorphism of apolipoprotein C1
FEBS Journal 273 (2006) 4707–4715 ª2006 The Authors Journal compilation ª2006 FEBS 4711


%20--%3e%3cdefs%3e%3cstyle%3e%20.st0%20{%20fill:%20%23fff;%20}%20.st1%20{%20fill:%20%237800fa;%20}%20%3c/style%3e%3c/defs%3e%3cpath%20class='st1'%20d='M117.78,12.18H43.11c2.9,3.47,4.65,7.94,4.65,12.82,0,5.6-2.3,10.66-6.01,14.29h76.02l7.22-13.56-7.22-13.56Z'/%3e%3cg%3e%3cpath%20class='st0'%20d='M53.58,26.17h-.59v-1.46h.59v-4.96h2.83c1.78,0,2.67.94,2.67,2.82v5.76c0,1.87-.89,2.81-2.67,2.81h-2.83v-4.96ZM55.36,21.37v3.34h1.1v1.46h-1.1v3.34h1.01c.61,0,.91-.37.91-1.1v-5.93c0-.74-.3-1.1-.91-1.1h-1.01Z'/%3e%3cpath%20class='st0'%20d='M65.99,31.14h-1.8l-.31-2.07h-2.19l-.31,2.07h-1.64l1.82-11.39h2.62l1.82,11.39ZM65.28,18.04c-.25.46-.51.77-.75.94-.21.15-.47.22-.79.22-.26,0-.57-.07-.92-.22l-.38-.15c-.14-.05-.26-.07-.37-.07-.3,0-.53.18-.71.54l-.91-.68c.25-.46.51-.77.75-.94.21-.14.48-.21.79-.21.26,0,.57.07.92.21l.38.15c.14.05.26.07.37.07.3,0,.53-.18.71-.54l.91.68ZM61.91,27.52h1.73l-.87-5.76-.87,5.76Z'/%3e%3cpath%20class='st0'%20d='M74.53,26.89v1.52c0,1.91-.89,2.86-2.67,2.86s-2.67-.95-2.67-2.86v-5.93c0-1.91.89-2.86,2.67-2.86s2.67.95,2.67,2.86v1.11h-1.69v-1.22c0-.75-.31-1.12-.93-1.12s-.93.37-.93,1.12v6.15c0,.74.31,1.11.93,1.11s.93-.37.93-1.11v-1.63h1.69Z'/%3e%3cpath%20class='st0'%20d='M81.4,31.14h-1.8l-.31-2.07h-2.19l-.31,2.07h-1.64l1.82-11.39h2.62l1.82,11.39ZM75.9,19.2l1.52-1.91h1.71l1.51,1.91h-1.61l-.76-.95-.75.95h-1.61ZM77.32,27.52h1.73l-.87-5.76-.87,5.76ZM83.1,15.99l-1.76,1.91h-1.26l1.17-1.91h1.86Z'/%3e%3cpath%20class='st0'%20d='M84.86,19.75c1.78,0,2.67.94,2.67,2.82v1.48c0,1.87-.89,2.81-2.67,2.81h-.85v4.28h-1.79v-11.39h2.64ZM84.01,21.37v3.86h.85c.58,0,.87-.36.87-1.08v-1.71c0-.71-.29-1.07-.87-1.07h-.85Z'/%3e%3cpath%20class='st0'%20d='M93.51,19.75c1.78,0,2.67.94,2.67,2.82v1.48c0,1.87-.89,2.81-2.67,2.81h-.85v4.28h-1.79v-11.39h2.64ZM92.66,21.37v3.86h.85c.58,0,.87-.36.87-1.08v-1.71c0-.71-.29-1.07-.87-1.07h-.85Z'/%3e%3cpath%20class='st0'%20d='M98.8,31.14h-1.79v-11.39h1.79v4.88h2.03v-4.88h1.83v11.39h-1.83v-4.88h-2.03v4.88Z'/%3e%3cpath%20class='st0'%20d='M105.36,24.55h2.46v1.62h-2.46v3.34h3.09v1.63h-4.88v-11.39h4.88v1.63h-3.09v3.18ZM108.17,17.29l-1.76,1.91h-1.26l1.17-1.91h1.86Z'/%3e%3cpath%20class='st0'%20d='M112.2,19.75c1.78,0,2.67.94,2.67,2.82v1.48c0,1.87-.89,2.81-2.67,2.81h-.85v4.28h-1.79v-11.39h2.64ZM111.35,21.37v3.86h.85c.58,0,.87-.36.87-1.08v-1.71c0-.71-.29-1.07-.87-1.07h-.85Z'/%3e%3c/g%3e%3ccircle%20class='st1'%20cx='25'%20cy='25'%20r='20'/%3e%3cpath%20class='st0'%20d='M32.78,19.27c2.92,0,4.43,2.55,5.28,5.33l.71,2.17c.14.38-.33.75-.71.75h-5.61c.19-.33.24-.71.09-1.08l-.75-2.45c-.43-1.32-.99-2.64-1.79-3.77.75-.57,1.65-.94,2.78-.94h0ZM25,18.38c3.25,0,4.9,2.78,5.89,5.89l.76,2.45c.14.42-.33.8-.8.8h-11.69c-.42,0-.94-.38-.8-.8l.75-2.45c.99-3.11,2.64-5.89,5.89-5.89h0ZM25,11.35c1.74,0,3.11,1.37,3.11,3.11s-1.37,3.11-3.11,3.11-3.11-1.41-3.11-3.11,1.41-3.11,3.11-3.11h0ZM17.27,19.27c1.08,0,1.98.38,2.73.94-.8,1.13-1.37,2.45-1.74,3.77l-.8,2.45c-.14.38-.05.75.09,1.08h-5.56c-.42,0-.9-.38-.75-.75l.71-2.17c.9-2.78,2.41-5.33,5.33-5.33h0ZM17.27,12.91c1.51,0,2.78,1.27,2.78,2.83s-1.27,2.83-2.78,2.83-2.83-1.27-2.83-2.83,1.27-2.83,2.83-2.83h0ZM32.78,12.91c1.56,0,2.78,1.27,2.78,2.83s-1.23,2.83-2.78,2.83-2.83-1.27-2.83-2.83,1.27-2.83,2.83-2.83h0ZM27.07,28.56v.09c0,.57-.24,1.08-.61,1.46h0v.05c-.38.33-.9.57-1.46.57s-1.08-.24-1.46-.61h0c-.38-.38-.61-.9-.61-1.46v-.09h1.41v.09c0,.19.05.38.19.47v.05c.09.09.28.19.47.19s.38-.09.47-.19v-.05c.14-.09.24-.28.24-.47t-.05-.09h1.41ZM30.99,28.56v.09c0,1.65-.66,3.16-1.74,4.24-1.08,1.08-2.59,1.79-4.24,1.79s-3.16-.71-4.24-1.79l-.05-.05c-1.04-1.08-1.7-2.55-1.7-4.2v-.09h1.41v.09c0,1.27.47,2.4,1.27,3.25h.05c.85.85,1.98,1.37,3.25,1.37s2.4-.52,3.25-1.37c.85-.8,1.37-1.98,1.37-3.25v-.09h1.37ZM34.99,28.56v.09c0,2.78-1.13,5.28-2.92,7.07-1.79,1.79-4.29,2.92-7.07,2.92s-5.23-1.13-7.07-2.92c-1.79-1.79-2.92-4.29-2.92-7.07v-.09h1.41v.09c0,2.4.94,4.53,2.5,6.08,1.56,1.56,3.72,2.5,6.08,2.5s4.52-.94,6.08-2.5c1.56-1.56,2.5-3.68,2.5-6.08v-.09h1.41Z'/%3e%3c/svg%3e)