Ministry of Agriculture & Rural Development
Collaboration for Agriculture & Rural Development
002/04VIE Project
Better Breeds of Common Carp (Cyprinus carpio L.)
for Small-scale Fish Farmers
Milestone 4: On-farm Trials and Uptake of Improved Breeds of
Common Carp
Christopher M Austin1, Tuan Anh Pham2, Binh Thanh Thai2, Hung Quang Le2 1School of Science and Primary Industries, Charles Darwin University, Darwin Northern
Territory 0909, Australia 2Research Institute for Aquaculture No 1, Dinh Bang, Tu Son, Bac Ninh, Vietnam
October, 2007
2
Contents
Contents........................................................................................................... 2
List of Figures ................................................................................................. 3
List of Table .................................................................................................... 4
1. Introduction ................................................................................................ 6
2. Materials and methods............................................................................... 7
2.1. Experimental Design..................................................................................................7
2.2. Selection of common carp strains ..............................................................................8
2.3. Common carp rearing and experimental procedures .................................................9
2.4. Data collection and analysis.....................................................................................11
3. Results........................................................................................................ 14
3.1. Fingerling growth rate..............................................................................................14
3.2. Growth and survival of HP3 and LOC strains and effects of feed input .................14
3.3. Growth rate and survival of HP3, H3B and LOC strains ........................................17
3.4. Growth rate and survival for HP3, VNW and LOC Strains ....................................19
3.5. Growth rate and survival of HP3, H3B, VNW and LOC strains in low feed input
farms controlled for variation among farmer ponds ..................................................21
3.6. Common carp biomass production in farms stocked with three common carp strain
(HP3, H3B, LOC) ......................................................................................................23
3.7. Common carp biomass production comparing farms stocked with two common
carp strains (HP3 and LOC). ......................................................................................25
3.8. Demand of the improved common carp seed ..........................................................27
4. Conclusion and Recommendations......................................................... 29
Appendices .................................................................................................... 33
Reference ....................................................................................................... 34
3
List of Figures
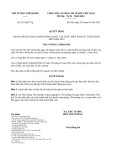
Fig 2.1. Rice field used for farm trials in Yen Bai province.................................................9
Fig 2.2. Farmer’s pond in Thai Nguyen province.................................................................9
Fig 2.3. Measuring common carp. ......................................................................................11
Fig 2.4. Ethnic people harvesting common cap in rice field in Yen Bai province .............12
Fig 2.5. Harvesting common carp in pond in Thai Nguyen................................................13
Fig 2.6. A farmer is happy with common carp growth.......................................................13
Fig 3.1. Daily growth rate of HP3 and LOC common carp strains in each of 18 farms.....15
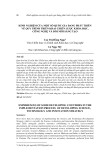
Fig 3.2. Example of relative growth of three strains of common carp in rice field in Yen
Bai province after six months of culture.................................................................18
Fig 3.3. Daily growth rate of HP3, H3B and LOC common carp strain in each of 11 farms
in Yen Bai and Thai Nguyen provinces..................................................................18
Fig 3.4. Daily growth rate of HP3, VNW and LOC common carp strain for a period of 10
months in each farm in Yen Bai and Thai Nguyen provinces. ...............................20
Fig 3.5. Daily growth rate of HP3, H3B, VNW and LOC common carp strains in 3 farms.
................................................................................................................................22
Fig 3.6. Common carp from HP3 strain after seven months of cultured in a high input feed
farm in Thai Nguyen province................................................................................23
Fig 3.7. Proportion of genetically improved common carp fry and fingerlings cultured in
Vinh Phuc, Thai Nguyen and Yen Bai provinces during 2004-2006. ....................29
4
List of Table
Table 2.1. Farms, pond type, and number of fish stocked of each strain (some farms were
remove from the data set because fish escaped during flooding). ..........................10
Table 2.2. Data analyses for common carp culture farm trails ...........................................13
Table 3.1 Mean (± SD) of body length and weight of fingerling carp after 60 days of
nursing ....................................................................................................................14
Table 3.2. ANOVA table testing for differences in daily growth rate in relation to the
effects of common carp strain (HP3 and LOC) and type of feed input. .................15
Table 3.3. Daily growth rate of HP3 and LOC common carp strain for period of 10 months
in 18 farms in two type of feeding regimes in Yen Bai and Thai Nguyen provinces.
Superscripts indicate significant differences among groups based on Tukey’s test.
................................................................................................................................15
Table 3.4. ANOVA table testing for differences in survival rate in relation to the effects of
common carp strain (HP3 and LOC) and type of feed input. .................................16
Table 3.5. Survival rate of HP3 and LOC common carp strains grown for a period of 10
months in 18 farms with two types of feeding rates in Yen Bai and Thai Nguyen
provinces. Superscripts indicate significant differences among groups based on
Tukey’s test.............................................................................................................16
Table 3.6. ANOVA table testing for differences in daily growth rate in relation to the
effects of common carp strain (HP3, H3B and LOC).............................................17
Table 3.7. Daily growth rate of HP3, H3B and LOC common carp strains grown for a
period of 10 months in 11 farms in Yen Bai and Thai Nguyen provinces.
Superscripts indicate significant differences among groups based on Tukey’s test.
................................................................................................................................17
Table 3.8. ANOVA table testing for differences in survival rate in relation to the effects of
common carp strains (HP3, H3B and LOC). ..........................................................19
Table 3.9. ANOVA table testing for differences in daily growth rate in relation to the
effects of common carp strain (HP3, VNW and LOC)...........................................19
Table 3.10. Daily growth rate of HP3, VNW and LOC common carp strains grown for a
period of 10 months in 5 farms in Yen Bai and Thai Nguyen provinces.
5
Superscripts indicate significant differences among groups based on Tukey’s test.
................................................................................................................................20
Table 3.11. ANOVA table testing for differences in survival rate in relation to the effects
of common carp strains (HP3, VNW and LOC).....................................................21
Table 3.12. ANOVA table testing for differences in daily growth rate in relation to the
effects of common carp strain (HP3, H3B, VNW and LOC) .................................21
Table 3.13. Daily growth rate of HP3, H3B, VNW and LOC common carp strains for
period of 10 months in 3 farms in Yen Bai and Thai Nguyen provinces.
Superscripts indicate significant differences among groups based on Tukey’s test.
................................................................................................................................22
Table 3.14. ANOVA table testing for differences in survival rate in relation to the effects
of common carp strains (HP3, H3B, VNW and LOC) and culture types (low and
high feed input). ......................................................................................................23
Table 3.15. Biomass of common carp strains in 11 farms with 3 strains (HP3, H3B and
LOC) and cultured for 300 days in Yen Bai and Thai Nguyen provinces..............24
Table 3.16. ANOVA analyses of biomass of HP3, H3B, and LOC common carp strains.25
Table 3.17. ANOVA analysis of biomass of HP3 and LOC common carp strains. ...........25
Table 3.18. Biomass of common carp strains in 18 farms with 2 strains (HP3 and LOC)
cultured for 300 days. Superscripts indicate significant differences among groups
based on Tukey’s test..............................................................................................26
Table 3.19. Biomass of HP3 and LOC common carp strains grown for a period of 10
months in 18 farms with two types of feed input in Yen Bai and Thai Nguyen
provinces.................................................................................................................27
Table 3.20. Number of hatcheries and fry nursing farmers in 3 provinces. .......................27
Table 3.21. Number of common carp fry produced in five hatcheries in Thai Nguyen, Yen
Bai and Vinh Phuc provinces in 2006.....................................................................28
Table 3.22. Proportion of fry produced from genetically improved common carp lines in
five hatcheries in Thai Nguyen, Yen Bai, and Vinh Phuc provinces in 2006. .......28
6
1. Introduction
In Vietnam aquaculture plays a very important role in economic development and food
security for small scale farmers and contributes 35% of Vietnamese protein consumption.
Aquaculture production is increasing at rate of 10% per year and contributes significantly
to the country’s export income (MOFI, 2007).
Common carp is one of the most popular freshwater aquaculture species in Vietnam and is
cultured in pond, cages, reservoir and rice field for household consumption and income
generation. A recent survey of 133 carp farmers indicated that pond and rice field
production are the preferred form of culture systems (98%) with the pond culture the most
common (Austin et al., 2007a). Most farmers culture common carp with up to 8 other fish
species, both indigenous (silver carp, black carp) and exotic (silver grass carp, bighead,
rohu, mrigal, pirapitinga, Tilapia). In polyculture ponds, common carp is the predominate
species making up 30.1% of the biomass based on a recent survey (Austin et al., 2007a).
The level of culture intensity for common carp varies from small scale extensive farming,
with fish deriving all their nutrition from natural pond productivity, through semi-
intensive farming using fertilization from organic material such as bran, agriculture by-
products and household wastes to high intensive culture system with high stocking
densities and the use of manufactured fish foods. Semi-intensive culture systems are the
most popular in Vietnam using ponds or a combination of ponds and rice field cultivation
(Austin et al., 2007a).
There are many factors that affect production and yield of farmed fish species, including
seed (fry and fingerlings) quality, feed type and rate, fertilisation and pond management,
including water exchange. Of these, seed quality, which is directly related to the genetic
quality of the broodstock used to produce the fry and fingerlings, has been identified as
being of major concern to researchers (Thai et al., 2006; 2007), but which is not generally
understood by farmers to be a potential issue affecting farm productivity (Austin et al.,
2007a).
7
In Vietnam there are many different local varieties of common carp that have been used
by farmers but they usually have small size and low growth rate (Tran, 1983). Over recent
times the Research Institute for Aquaculture No.1 (RIA-I) has bred genetically improved
common carp strains to enhance the productivity of small scale fish farms that utilise this
species. This program has used crossbreeding and mass and family selection
methodologies to produce genetically improved strains and is considered to have achieved
an average increase of 5% in growth rate per generation over a number of generations
(Thien and Thang, 1992). However, all the selective breeding and associated growth trials
have been conducted in research ponds, often without the availability of unselected lines
as control populations for comparative studies.
As a consequence, on-farm growth trials of different strains were undertaken to allow for a
more effective analysis of carp growth under environments directly relevant to small scale
carp farmers and as a strategy to encourage uptake by farmers of genetically improved
strains. This report presents, firstly, a report on the statistical analysis of growth and
production of different common carp strains in small scale farmer ponds in Yen Bai and
Thai Nguyen provinces. The farmers participating in this research project included those
using both pond and rice field culture from mostly highland environments. All farmers
had previously participated in the socio-economic survey and one of two workshops on
fish breeding and genetic improvement conducted as part of this project. Secondly, a
survey of the uptake of improved breeds by producers is presented.
2. Materials and methods
2.1. Experimental Design
The original objective of the on-farm trials was to compare a genetically improve carp
strain and a local strain communally reared in six ponds owned by different farmers. With
additional support from the Research Institute of Aquaculture No. 1 (RIA1), the
experimental objectives were scaled up to include 37 separate farmers and four strains.
The majority (34) of farmers used ponds as their culture systems with six farmers using
8
rice field systems, which reflects the proportion of these different farming systems in these
provinces based on the socio-economic survey (Austin et al., 2007a) (Fig 2.1&2.2). Farms
were classified according to their levels of feed inputs as either high or low to determine if
this important management aspect influenced the relative performance of the different
carp strains. Farmers who did not provide food more than once per month were classified
as having “Low” input pond systems and those who fed at least once per week or more
frequently were classified as having “High” input pond systems. The experiment was
conducted over a 12 months period from March 2006 to March 2007, which included
spawning and fry rearing March – May, 2006 and fingerling grow out May 2006 to March
2007, which largely coincides with the normal carp farming culture cycle. The trials were
conducted in pond systems owned by 20 households in each of the Thai Nguyen and Yen
Bai provinces. Representatives of these households were interviewed for the socio-
economic survey and participated in one of the farmer workshops on fish breeding and
selection held as part of this project.
As described in more detail below the experimental design could not be achieved due to
differential reproduction and survival of fry. Thus different farms were stocked with
different numbers of strains and in varying combinations. Further, fish could not be
harvested from several farms due to flooding and other management problems. Appendix
1 lists the farms that participated in the project, and details of their culture systems and
fish that were stocked and if data collection at harvest was possible.
2.2. Selection of common carp strains
Fours common carp strains were used for growth trials and included one strain (HP3)
recently produced through hybridization between the three blood Hungarian strain and a
recently imported pure line of Hungarian carp, the three blood Hungarian strain (H3B), an
unselected Vietnamese strain (VNW) and a locally available strain (LOC) produced from
broodstock available from the Yen Bai provincial hatchery. Genetic analysis of this strain
(Thai et al., 2006: 2007) indicates it represented a mixture of Indonesian, Hungarian and
Vietnamese strains with the latter strain predominating.
9
.
Fig 2.1. Rice field used for farm trials in Yen Bai province
Fig 2.2. Farmer’s pond in Thai Nguyen province
2.3. Common carp rearing and experimental procedures
Common carp breeding was undertaken at the National Broodstock Centre Hai Duong.
Broodstock of each experimental strain were induced to breed on the same day, using
standard practices for gamete stripping and fertilization (Thai and Ngo, 2004). Between 10
-12 families of fish were obtained from each strain. After fertilization eggs produced from
10
different families of the one strain were pooled and raised in 200l upwelling incubators.
After 4-5 days when larvae had reached 8-12 mm they were transferred to four ponds and stocked at a rate of 100 larvae/m2 and grown for a period of two months. Every effort was
made to keep the conditions under which the fry and fingerlings of each strain were raised
as similar as possible, especially in relation to stocking density and feeding regime. When
the fingerlings had reached of 3-5g, they were tagged by using Coded Wire Tag (CWT).
The strains of common carp lines were marked by placing the CWTs on different
locations on the body. The tagged fish were stocked into 40 ponds or pond-rice field
systems over a two day period. Communally stocked fish were in equal proportions with
the exception of three ponds. The details of the fish stocked in farms is given Table 2.1.
Table 2.1. Farms, pond type, and number of fish stocked of each strain (some farms were remove
from the data set because fish escaped during flooding).
Strain and No of fish stocked
Farm
Feed
100
Thai Nguyen Thai Nguyen
80
100 120 100 100 100 113 113 80
75
50 80
100 113 113 100 60 100 113 113 75 150 80 90 100 75
Yen Bai Hoan Ly Yen Bai Thuan Yen Bai Tap Tuan Chung Yen Bai Yen Bai Lien Yen Bai Hom Yen Bai Tho Thai Nguyen Dieu Thai Nguyen Ha Thai Nguyen Lieu Thai Nguyen Canh Thai Nguyen Luat Yen Bai Nhan Truong Thai Nguyen Thai Nguyen Que Thai Nguyen Vinh Ke Thai Nguyen Thong Yen Bai Lich Trung
Provinces Culture Area (m2) 1000 800 1000 800 1000 1000 1500 800 450 600 1500 1000 400 1000 1500 500 1000 800 550 1000 500 400
systems Ricefield Pond Pond Pond Pond Pond Ricefield Ricefield Pond Pond Pond Pond Pond Pond Pond Pond Pond Pond Pond Pond Pond Pond
Thai Nguyen Thai Nguyen
input HF LF LF HF LF HF LF LF HF LF LF LF HF LE LE HF LF LF LF LF LF LF
HP3 H3B VNW LOC Total 300 100 100 240 120 120 300 100 100 240 120 300 100 100 300 100 450 113 113 240 80 150 75 200 100 450 113 113 300 55 145 120 60 300 100 100 450 113 113 150 75 300 100 240 80 180 90 300 100 100 150 75 120 60
60
HF: High feeding rate LF: Low feeding rate.
11
Each farm pond or rice field was stocked at a rate of 0.3 fish/m2 and was classified as
either “Low Feed” or “High Feed” based on the level of food inputs into the ponds. Rice
field systems fed less than once per week were classified as low input systems and more
than once per week as high input.
All experimental ponds and rice fish fields were managed by farmers. Fish in ponds and
rice fields were fed by available foods from farmers’ households such as rice bran, corn
and cassava. A log book was provided to each farmer to keep a record of food inputs into
their experimental pond and other relevant information and this information was used to
classified ponds into high and low feed input. The farmers were visited on a monthly basis
by project staff to assist in record keeping (Fig 2.3).
Fig 2.3. Measuring common carp.
2.4. Data collection and analysis
Inequalities in fry weight among strains after the three month nursing period was tested by
weighing a sample of 30 individuals to the nearest 0.1 g and analysed using a one –way
ANOVA. Prior to this analysis the FMax test was used to determine if variances amongst
strains were homogenous.
12
Pond trials were conducted for 300 – 330 days. Fish were harvesting by draining and by
netting. Data from were collected as fish wet weight to the nearest 0.1 g and length (snout
– caudal) measured to the nearest mm (Fig 2.4, 2.5 & 2.6). Fish were allocated to strain
based on the identification of the position of the CWT using a detector scanner (North
West Marine technology, Shaw Island, WA, American). To compare growth between
strains, fish weights were converted to daily growth rate (DGR) after first subtracting the
mean fingerling weight for that strain.
The appropriate statistical procedure for the experimental design for analyzing for
differences in growth rate is a three-way ANOVA with nesting. The first level of the
analysis allows partitioning of variance due to Feed Input as either low (LF) or high (HF),
the second level is Farmer, which is nested within level 1 and the third level is Fish Strain.
Due to the unequal numbers fry available for each of the four carp strains and their
stocking in different combinations into farms and the unavailability of data from a number
farms, several kinds of ANOVA were conducted. The number of farms with different
combinations of stocked strains is given in Table 2.2 together with the type of ANOVA
conducted.
Fig 2.4. Ethnic people harvesting common cap in rice field in Yen Bai province
13
Fig 2.5. Harvesting common carp in pond in Thai Nguyen
Fig 2.6. A farmer is happy with common carp growth
Table 2.2. Data analyses for common carp culture farm trails
Strains
Farm input
Type of analysis
Three way Anova
(HP3,
LOC)
Low High Total 18
14
4
Two way Anova
(HP3, H3B,
LOC)
10
1
11
Two way Anova
(HP3,
VNW, LOC)
4
1
5
Two way Anova
(HP3, H3B, VNW, LOC)
3
3
Percentage of recovered fish and harvested fish biomass of each common carp strain were
analyzed as a 2-way ANOVA. The biomass of fish harvested in ponds with unequal
14
stocking rates was adjusted to the average stocking rate to allow for statistical comparison.
All analyses were conducted using the Excel and SPSS software packages.
3. Results
3.1. Fingerling growth rate
The average weight of common carp fingerlings after 60 days of nursing was 3.18 g. The
average weight of each common carp strain is given in Table 3.1. However, the difference
in body weigh among strains was not significantly different (P>0.05).
Table 3.1 Mean (± SD) of body length and weight of fingerling carp after 60 days of nursing
Carp strain Length (cm) Weight (g)
HP3 4.72 ± 0.70 3.38 ± 1.50
H3B 4.57 ± 0.56 2.82 ± 1.66
VNW 5.36 ± 1.28 4.21 ± 2.84
LOC 4.27 ± 0.74 2.29 ± 1.32
Total 4.73 ± 0.82 3.18 ± 1.83
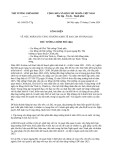
3.2. Growth and survival of HP3 and LOC strains and effects of feed input
Growth rate for the HP3 and LOC strains were compared in 18 farms which included both
low and high feed input systems. Significant differences were observed for all factors and
for the interaction between production systems and strain (Table 3.2) (P<0.01). The mean
daily growth rate of HP3 strain (0.48g) was 60% higher than that of local strain (LOC)
(0.30g) (Table 3.3). Daily growth rate of each fish farm is present in Fig 3.1.
15
Table 3.2. ANOVA table testing for differences in daily growth rate in relation to the effects of
common carp strain (HP3 and LOC) and type of feed input.
F 329.90 213.32 6728.53 142.42 300.13 278.62 166.26
Sig. 0.00 0.00 0.00 0.00 0.00 0.00
4.52 9.52 9.49 5.27 0.03
Source Corrected Model Intercept Farm Strain Feed input Strain * Feed input Error Total Corrected Total
Type III Sum of Squares 209.18 213.32 76.76 9.52 9.49 5.27 25.81 367.36 234.99
df Mean Square 10.46 20 1 17 1 1 1 814 835 834
Table 3.3. Daily growth rate of HP3 and LOC common carp strain for period of 10 months in 18
farms in two type of feeding regimes in Yen Bai and Thai Nguyen provinces. Superscripts
indicate significant differences among groups based on Tukey’s test.
Strain
Feed input
HP3
High 1.13 ± 0.03c 0.79 ± 0.04d
Low 0.22 ± 0.02a 0.16 ± 0.02b
LOC
3.00
HP3
2.50
LOC
2.00
) g (
1.50
G R D
1.00
0.50
0.00
Luat
Ha
Ke
Vinh
Tuan
Lieu
Dieu
Que
Lich
Lien
Hom Nhan Thong Thuan Truong Hoan
Tap Chung
Low feeding rate
High feeding rate
Farm
Fig 3.1. Daily growth rate of HP3 and LOC common carp strains in each of 18 farms.
This last finding is particularly significant as it indicates that while there is a significant
difference among strains, this difference is greatly diminished in production systems with
low feed inputs. Table 3.3 gives the average daily growth rate for the 2 strains in each
16
system and it can be seen there is only a 0.06g difference in average daily growth in low
feed input systems compared with a 0.36 in high input system.
The results from an analysis of survival rate of two strains are shown in Table 3.4 and
Table 3.5. There is a significant difference in survival rate between low and high feed
input farms but no significant difference between strains. The survival rate of HP3 and
LOC strains is 24.77% and 22.76% respectively and it is 62% higher in High feed input
ponds compared to Low feed input ponds.
Table 3.4. ANOVA table testing for differences in survival rate in relation to the effects of
common carp strain (HP3 and LOC) and type of feed input.
F Sig 14.88 0.00 1641.80 0.00 3.03 0.10 9.44 0.00 0.27 0.61
Source Corrected Model Intercept Strain Feed input Strain * Feed input Error Total Corrected Total
Type III Sum of Squares 3366.45 19547.55 36.13 772.99 3.18 190.50 23894.81 3556.95
df Mean Square 177.18 19 19547.55 1 36.13 1 772.99 1 3.18 1 16 11.91 36 35
Table 3.5. Survival rate of HP3 and LOC common carp strains grown for a period of 10 months
in 18 farms with two types of feeding rates in Yen Bai and Thai Nguyen provinces. Superscripts
indicate significant differences among groups based on Tukey’s test.
Feed input
N
Std Min Max
0.86
11.72
29.33
Low
28
6.31
14.17
High
8
Mean 21.29a 32.44b 26.90a
3.58
12.95
Total
36
62.00 45.67
17
3.3. Growth rate and survival of HP3, H3B and LOC strains
Growth data from three strains, HP3, H3B and LOC were compared in 11 farms which
included 10 low and 1 high feed input systems. Significant differences were observed for
strain and farmer as presented Table 3.6. Table 3.7 gives the average growth rate for the 3
strains. The effect of the level of feed input could not be tested statistically due lack of
replicates. The differences between strains can be seen from Figure 3.2 and Table 3.7. The
daily growth rate of common carp in each farm is presented in Fig 3.3. Each strain was
significantly different on the basis of Tukey’s test with HP3>H3B>LOC.
Table 3.6. ANOVA table testing for differences in daily growth rate in relation to the effects of
common carp strain (HP3, H3B and LOC).
Sig. 0.00 0.00 0.00 0.00
Source Corrected Model Intercept Strain Farm Error Total Corrected Total
Type III Sum of Squares 60.13 49.36 1.84 58.78 9.86 133.38 69.99
F df Mean Square 4.63 13 387.22 49.36 4132.25 1 77.08 0.92 2 447.32 5.34 10 825 0.01 839 838
Table 3.7. Daily growth rate of HP3, H3B and LOC common carp strains grown for a period of
10 months in 11 farms in Yen Bai and Thai Nguyen provinces. Superscripts indicate significant
differences among groups based on Tukey’s test.
Strain
N
Std
Min
Max
0.34
0.05
1.90
HP3
301
H3B
282
0.27
0.04
1.51
Mean 0.33a 0.26b 0.23c
LOC
256
0.23
0.02
0.27d
Total
839
0.28
0.03
1.05 1.49
18
HP3
LOC
H3B
Fig 3.2. Example of relative growth of three strains of common carp in rice field in Yen Bai
province after six months of culture.
1.400
HP3
H3B
1.200
LOC
1.000
0.800
) g (
0.600
G R D
0.400
0.200
0.000
Luat
Ha
Vinh Tuan
Lieu Que
Lien Hoan Nhan Thuan Thong
Farm
Fig 3.3. Daily growth rate of HP3, H3B and LOC common carp strain in each of 11 farms in Yen
Bai and Thai Nguyen provinces.
ANOVA analyses of survival rate of common carp showed that there was a significant
difference between farms, while survival rate between common carp strains was not
different (Table 3.8). The average survival rate of HP3, H3B and LOC was 24.28%,
25.78%, and 23.45% respectively.
19
Table 3.8. ANOVA table testing for differences in survival rate in relation to the effects of
common carp strains (HP3, H3B and LOC).
F 299.30 15.10 17183.84 866.98 349.90 17.65 1.27
Sig. 0.00 0.00 0.00 0.30
25.09 19.82
Source Corrected Model Intercept Farm Strain Error Total Corrected Total
Type III Sum of Squares 3890.87 17183.84 3848.88 50.18 376.59 23859.09 4267.46
df Mean Square 13 1 11 2 19 33 32
3.4. Growth rate and survival for HP3, VNW and LOC Strains
Growth data from three strains, HP3, VNW and LOC were compared in 5 farms which
included 4 low and 1 high feed input systems. Significant differences were observed for
both strain and farmer factors as presented Table 3.9. Table 3.10 gives the average growth
rate for the 3 strains. While the effect of production system could not be tested statistically
due to lack of replicates for this effect and the differences between strains and farms can
be seen from Figure 3.4. Each strain was significantly different on the basis of Tukey’s
test with HP3>VNW>LOC.
Table 3.9. ANOVA table testing for differences in daily growth rate in relation to the effects of
common carp strain (HP3, VNW and LOC).
F 55.05 17.22 1381.20 62.84 43.40
Sig. 0.00 0.00 0.00 0.00
0.78 0.54 0.01
Source Corrected Model Intercept Farm Strain Error Total Corrected Total
Type III Sum of Squares 4.12 17.22 3.13 1.08 3.74 25.74 7.86
df Mean Square 0.69 6 1 4 2 300 307 306
.
20
Table 3.10. Daily growth rate of HP3, VNW and LOC common carp strains grown for a period
of 10 months in 5 farms in Yen Bai and Thai Nguyen provinces. Superscripts indicate significant
differences among groups based on Tukey’s test.
Strain
N
Std
Min
Max
0.20
0.10
1.50
HP3
112
VNW
96
0.12
0.03
0.66
LOC
99
0.10
0.02
Mean 0.31a 0.22b 0.18c 0.24c
0.14
0.05
Total
307
0.78 0.98
0.60
HP3
0.50
VNW
0.40
LOC
) g (
0.30
G R D
0.20
0.10
0.00
Ha
Lien
Nhan
Chung
Hom
Farm
Fig 3.4. Daily growth rate of HP3, VNW and LOC common carp strain for a period of 10 months
in each farm in Yen Bai and Thai Nguyen provinces.
The results of the survival rate of three common carp strains (HP3, VNW and LOC)
showed no significant differences between farms (Table 3.11). Although survival rate of
HP3 was the highest (20.57%) there had no significant difference comparing with other
two strains (VNW = 17.98% and LOC = 18.49%).
21
Table 3.11. ANOVA table testing for differences in survival rate in relation to the effects of
common carp strains (HP3, VNW and LOC).
F 2.28 850.77 2.68 1.49
Sig. 0.14 0.00 0.11 0.28
Source Corrected Model Intercept Farm Strain Error Total Corrected Total
Type III Sum of Squares 87.19 5417.29 68.18 19.01 50.94 5555.42 138.13
df Mean Square 14.53 6 5417.29 1 17.04 4 9.51 2 8 6.37 15 14
3.5. Growth rate and survival of HP3, H3B, VNW and LOC strains in low feed input
farms controlled for variation among farmer ponds
Growth data from all four strains, HP3, H3B, VNW and LOC were compared in 3 low
input farms in which they were raised communally. Significant differences were observed
for both strain and farmer as presented Table 3.12. Table 3.13 gives the average growth
rate for the 4 strains. Post hoc tests indicated significant differences among strains with
HP3 > H3B = VIET > LOC. Daily growth rate of each strain and farm are presented in Fig
3.5.
Table 3.12. ANOVA table testing for differences in daily growth rate in relation to the effects of
common carp strain (HP3, H3B, VNW and LOC)
F 135.15 3480.33 203.09 91.25
Sig. 0.00 0.00 0.00 0.00
Source Corrected Model Intercept Farm Strain Error Total Corrected Total
Type III Sum of Squares 1.53 7.89 0.92 0.62 0.55 10.65 2.08
df Mean Square 0.31 5 7.89 1 0.46 2 0.21 3 242 0.00 248 247
22
Table 3.13. Daily growth rate of HP3, H3B, VNW and LOC common carp strains for period of 10
months in 3 farms in Yen Bai and Thai Nguyen provinces. Superscripts indicate significant
differences among groups based on Tukey’s test.
Strain
N
Std
Min
Max
HP3
71
0.08
0.10
0.46
H3B
62
0.09
0.04
0.38
VNW
58
0.07
0.03
0.38
LOC
57
0.06
0.02
Mean 0.26a 0.17b 0.17b 0.13c 0.18C
Total
248
0.08
0.05
0.24 0.37
0.40
HP3
0.35
H3B
0.30
VNW
0.25
LOC
) g (
0.20
G R D
0.15
0.10
0.05
0.00
Lien
Nhan
Ha
Farm
Fig 3.5. Daily growth rate of HP3, H3B, VNW and LOC common carp strains in 3 farms.
The results of survival rate comparisons among four common carp strains (HP3, H3B,
VNW and LOC) are showed in Table 3.14. There are significant differences between fish
survival rate among farms (P<0.05) with survival rate of fish in the farms ranged from
20.94 to 16.81 %. There was no significant differences in survival rate between common
carp strains (P>0.05).
23
Table 3.14. ANOVA table testing for differences in survival rate in relation to the effects of
common carp strains (HP3, H3B, VNW and LOC) and culture types (low and high feed input).
F 4.33 991.99 6.82 2.68
Sig. 0.05 0.00 0.03 0.14
Source Corrected Model Intercept Farm Strain Error Total Corrected Total
Type III Sum of Squares 90.87 4161.47 57.19 33.68 25.17 4277.52 116.04
df Mean Square 18.17 5 4161.47 1 28.60 2 11.23 3 6 4.20 12 11
Fig 3.6. Common carp from HP3 strain after seven months of cultured in a high input feed farm
in Thai Nguyen province.
3.6. Common carp biomass production in farms stocked with three common carp
strain (HP3, H3B, LOC)
Common carp production was compared for 3 strains in 11 farms. Biomass of common
carp from 11 farms is presented in Table 3.23. Significant differences were observed
between farms and strains of common carp (Table 3.24). The pair-wise comparison
indicated difference in biomass of common carp between farms and between strains using Tukey’s test. Biomass of three common carp strains ranged from 3.16g/m2 (LOC) to 4.80g/m2 (HP3).
24
Table 3.15. Biomass of common carp strains in 11 farms with 3 strains (HP3, H3B and LOC) and
cultured for 300 days in Yen Bai and Thai Nguyen provinces.
Stocking
Harvesting
Farm
Hoan
Area Culture Strains (m2) systems 1000
Thuan
1000
Tuan
1000
Lieu
1000
Luat
1000
Que
1000
Vinh
800
Thong
1000
Lien
1500
Ha
1500
Nhan
1500
HF HP3 100 H3B 100 LOC 100 LF HP3 100 H3B 100 LOC 100 LF HP3 100 H3B 100 LOC 100 LF HP3 145 H3B 55 LOC 100 LF HP3 100 H3B 100 LOC 100 LF HP3 100 H3B 50 LOC 150 80 LF HP3 80 H3B 80 LOC LF HP3 100 H3B 100 LOC 100 LF HP3 113 H3B 113 LOC 113 LF HP3 113 H3B 113 LOC 113 LF HP3 113 H3B 113 LOC 113
N Weight (g) 3.38 2.82 2.29 3.38 2.82 2.29 3.38 2.82 2.29 3.38 2.82 2.29 3.38 2.82 2.29 3.38 2.80 2.29 3.38 2.82 2.29 3.38 2.82 2.29 3.38 2.82 2.29 3.38 2.82 2.29 3.38 2.82 2.29
NWeight (g) Sur (%) DGR 1.28 51 0.97 62 0.83 56 0.32 20 0.28 19 0.23 19 0.20 30 0.17 26 0.17 29 0.21 40 0.24 10 0.15 12 0.10 15 0.07 14 0.05 17 0.20 36 0.19 11 0.18 33 0.21 20 0.18 15 0.16 22 0.16 22 0.15 21 0.12 22 0.28 25 0.20 20 0.14 30 0.34 20 0.27 21 0.18 22 0.20 21 0.07 16 0.05 19
385.08 292.33 249.49 97.43 82.82 67.90 59.87 51.43 49.89 61.88 70.55 44.82 28.61 22.45 16.10 59.35 56.74 53.68 62.73 53.78 46.51 49.00 44.00 35.67 83.96 58.72 41.66 102.67 79.93 54.24 59.88 20.61 15.66
51.00 62.00 56.00 20.00 19.00 19.00 30.00 26.00 29.00 27.27 19.00 11.72 15.00 14.00 17.00 36.00 21.00 22.00 25.00 18.89 27.50 22.00 21.00 22.00 22.12 17.70 26.55 17.70 18.58 19.47 18.58 14.16 16.81
Biomass Adjusted (g/m2) 29.72 27.45 20.96 2.92 2.36 1.94 2.69 2.01 2.17 2.53 2.01 0.79 0.64 0.47 0.41 3.20 1.79 1.77 2.35 1.52 1.92 1.62 1.39 1.18 2.79 1.56 1.66 2.73 2.23 1.58 1.67 0.44 0.40
(g/m2) 19.30 17.84 13.74 1.61 1.29 1.06 1.46 1.05 1.22 1.96 0.58 0.30 0.09 0.03 0.05 1.80 0.46 1.43 1.23 0.73 1.05 0.74 0.64 0.56 1.14 0.57 0.66 1.11 0.91 0.62 0.58 0.01 0.03
25
Table 3.16. ANOVA analyses of biomass of HP3, H3B, and LOC common carp strains
Sig 0.00 0.00 0.00 0.02
Source Corrected Model Intercept Farm Strain Error Total Corrected Total
Type III Sum of Squares 1634.65 519.00 1619.77 14.88 33.24 2186.89 1667.90
df Mean Square F 81.95 136.22 12 519.00 312.23 1 97.45 161.98 10 4.48 7.44 2 20 1.66 33 32
3.7. Common carp biomass production comparing farms stocked with two common
carp strains (HP3 and LOC).
ANOVA analysis of biomass of common carp showed that there were significant
differences in biomass between farms, feed input, and the 2 strains (Table 3.25). The
biomass of common carp in two feed input systems are given in Table 3.26 and Table
3.27. The average common carp biomass for each strain in both high and low feed input
systems is given in Table 3.27.
Table 3.17. ANOVA analysis of biomass of HP3 and LOC common carp strains.
F 36.58 725.34 17.08 7.24 45.84 1.81
Sig 0.00 0.00 0.00 0.23 0.00 0.20
Source Corrected Model Intercept Farm Strain Feed input Strain * Feed input Error Total Corrected Total
Type III Sum of Squares 1416.77 1478.65 557.10 14.75 844.86 3.69 32.62 2198.60 1449.39
df Mean Square 19 74.57 1478.65 1 34.82 16 1 14.75 844.86 1 3.69 1 16 2.04 36 35
26
Table 3.18. Biomass of common carp strains in 18 farms with 2 strains (HP3 and LOC) cultured
for 300 days. Superscripts indicate significant differences among groups based on Tukey’s test.
Stocking
Harvesting
Farm
Hoan
Area Culture Strains (m2) systems 1000
HF HP3
Thuan
1000
LF HP3
Tap
800
HF HP3
Tuan
1000
LF HP3
Chung
1000
HF HP3
Lien
1500
LF HP3
Hom
800
Dieu
600
LF HP3 LOC LF HP3
Ha
1500
LF HP3
Lieu
1000
LF HP3
Luat
1000
LF HP3
Nhan
1500
LF HP3
Truong
500
HF HP3 LOC LF HP3
Que
1000
Vinh
800
Ke
550
LF HP3 LOC LF HP3 LOC LF HP3
Thong
1000
Lich
500
N Weight (g) 3.38 2.29 3.38 2.29 3.38 2.29 3.38 2.29 3.38 2.29 3.38 2.29 3.38 2.29 3.38 2.29 3.38 2.29 3.38 2.29 3.38 2.29 3.38 2.29 3.38 2.29 3.38 2.29 3.38 2.29 3.38 2.29 3.38 2.29 3.38 2.29
100 LOC 100 100 LOC 100 120 LOC 120 100 LOC 100 100 LOC 100 113 LOC 113 80 80 100 LOC 100 113 LOC 113 145 LOC 100 100 LOC 100 113 LOC 113 75 75 100 LOC 150 80 80 90 90 100 LOC 100 75 75
LF HP3 LOC
N Weight (g) Sur (%) DGR 51.00 1.28 51 56.00 0.83 56 20.00 0.32 20 19.00 0.23 19 14.17 2.52 17 25.00 1.55 30 30.00 0.20 30 29.00 0.17 29 18.00 0.56 18 19.00 0.33 19 22.12 0.28 25 26.55 0.14 30 24.00 0.22 19 21.00 0.19 16 22.00 0.32 22 23.00 0.12 23 17.70 0.34 20 19.47 0.18 22 27.27 0.21 40 11.72 0.15 12 15.00 0.10 15 17.00 0.05 17 18.58 0.20 21 16.81 0.05 19 29.33 0.67 22 36.00 0.52 27 36.00 0.20 36 22.00 0.18 33 25.00 0.21 20 27.50 0.16 22 22.22 0.21 20 25.56 0.29 23 22.00 0.16 22 22.00 0.12 22 26.67 0.19 20 29.33 0.15 22
385.08 249.49 97.43 67.90 756.38 465.74 59.87 49.89 166.64 98.03 83.96 41.66 64.88 58.09 95.20 37.40 102.67 54.24 61.88 44.82 28.61 16.10 59.88 15.66 200.71 156.85 59.35 53.68 62.73 46.51 61.88 87.15 49.00 35.67 57.99 44.39
Biomass Adjusted (g/m2) 29.72 21.15 2.92 1.94 16.07 17.47 2.69 2.17 4.50 2.79 2.79 1.66 2.34 1.83 3.14 1.29 2.73 1.58 2.53 0.79 0.64 0.41 1.67 0.40 8.83 8.47 3.20 1.77 2.35 1.92 2.06 3.34 1.62 1.18 2.32 1.95
(g/m2) 19.30 13.74 1.61 1.06 15.57 17.12 1.46 1.22 2.66 1.63 1.14 0.66 1.22 0.99 2.93 1.05 1.11 0.62 1.96 0.30 0.09 0.05 0.58 0.03 8.32 8.13 1.80 1.43 1.23 1.05 1.70 3.27 0.74 0.56 1.81 1.61
27
Table 3.19. Biomass of HP3 and LOC common carp strains grown for a period of 10 months in
18 farms with two types of feed input in Yen Bai and Thai Nguyen provinces.
Strains
Feed input
HP3
High (g/m2) 14.78 ± 2.15b 12.47 ± 2.15b
Low (g/m2) 2.36 ± 1.15a 1.59 ± 1.15a
LOC
3.8. Demand of the improved common carp seed
A survey on demand for genetically improved common carp strain was conducted in three
provinces (Yen Bai, Thai Nguyen and Vinh Phuc) which have a high level of common
carp aquaculture. In these provinces common carp are cultured mostly in two different
farming systems consisting of ponds and flooded rice fields. The provinces differ in that
Yen Bai is a mountainous region, Thai Nguyen is partly mountainous with midlands while
Vinh Phuc is a delta area. A total of 25 common carp hatcheries and nursery producers
were surveyed. Details of interviewees are presented in Table 3.30.
Table 3.20. Number of hatcheries and fry nursing farmers in 3 provinces.
Provinces
Interviewee
Hatchery producer Nursery farmer
Yen Bai
8
2
6
Thai Nguyen
10
2
8
Vinh Phuc
7
1
6
Total
25
5
20
The results of the survey showed the number of common carp seed produced was highly
variable among fish hatcheries. The proportion of common carp produced ranged from
10.0% to 66.7% with an average of 37.4% of the total freshwater fish species produced
(Table 3.31). Most of hatcheries surveyed have produced both local (VNW) and
genetically improved common carp (three blood lines) (Table 3.32). It can be seen from
Table 3.32 the proportion of genetically improved common carp produced in hatcheries
ranged from 16.7% to 100% and the average proportion of improved genetically common
carp was 48.7%.
28
Table 3.21. Number of common carp fry produced in five hatcheries in Thai Nguyen, Yen Bai
and Vinh Phuc provinces in 2006.
Hatchery
No of fry (x 1000)
No of common carp fry (x 1000)
Proportion of carp fry (%)
Dong Ly
1,200
500
41.67
Van Chan
60,000
30,000
50.00
Phu Binh
120,000
24,000
20.00
Cu Van
30,000
20,000
66.67
Vu Di
120,999
12,000
9.92
Total
332,199
86,500
26.04
Table 3.22. Proportion of fry produced from genetically improved common carp lines in five
hatcheries in Thai Nguyen, Yen Bai, and Vinh Phuc provinces in 2006.
Hatchery
Province
No of carp fry
No of Local strain
Improved strain
Propotion of improved strain
(x 1000)
(x 1000)
(x 1000)
(%)
Dong Ly
Yen Bai
500
500
100.00
Van Chan Yen Bai
30,000
25,000
5,000
16.67
Phu Binh
Thai Nguyen
24,000
24,000
9,600
40.00
Cu Van
Thai Nguyen
20,000
20,000
100.00
Vinh Phuc
Vu Di
12,000
5,000
7,000
58.33
Total
86,500
54,000
42,100
48.67
Hybrid (Hungary x Vietnamese) and stocks derived from the genetically improved three
blood lines (Hungarian, Vietnamese and Indonesian) with faster growth performance are
preferred by most of the nursery farmers interviewed in three provinces. However, many
of the nursery farmers are not confident in identifying differences between hybrid and
other genetically improved and local Vietnamese strains. The main basis for determining
the quality of common carp seed is the perceived reputation of the hatchery based on the
farmers evaluation of the survival and growth performance of their fish in grow-out
systems. The results of a 2006 survey of 20 carp nursery farmers indicated that 95% of
farmers cultured genetically improved strains.
29
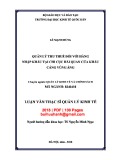
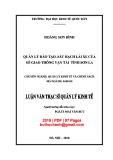
Based on data collected in earlier surveys it can be seen that demand for genetically
improved common carp by nursery farmers is increasing in the three provinces, over the
period 2004-2006 (Fig 3.9). While the demand for genetically improved common carp
seed by nursery farmers in the three provinces investigated has been increasing it varies
greatly between provinces. The demand for seed from genetically improved carp strains
was found to be very high in Thai Nguyen (>80%), and much lower in Vinh Phuc and Yen
100
90
80
70
60
VinhPhuc
50
ThaiNguyen
40
YenBai
30
20
10
0
2004
2005
2006
Bai (<25%).
Fig 3.7. Proportion of genetically improved common carp fry and fingerlings cultured in Vinh
Phuc, Thai Nguyen and Yen Bai provinces during 2004-2006.
4. Conclusion and Recommendations
There are some very significant conclusions from this study that related directly to the use
of genetically improved common carp in farmers ponds and the management of cultured
fish that are highlighted below.
• Significant differences in growth rate of common carp strains were found
30
This is the first on-farm growth trial to report difference in growth between strains of
common carp. Specifically the overall findings were the growth rate of the HP3 strain was
superior to the H3B and VNW strains, which in turn were superior to the local strain
(LOC). At the extremes the difference between the worst strains and best strains was 44%.
However, very importantly, the significance of this difference in growth performance was
dependent on the level of feed input into the culture system. In low input systems the
average differences between the best and worst strains was a growth rate of 0.06 grams
per day, where as in high input systems the average difference in growth rate was 0.34
grams per day.
• Very large difference in growth, survival and biomass production were apparent
between farms
The difference in daily growth rate between farms was much greater than between strains.
The best performing farm had from a 31 and 12.6 fold difference in growth rate for the
LOC and HP3 strains respectively. A significant factor explaining these differences can be
attributed to feed input but it is likely that other environmental and husbandry aspects
contribute to these very substantial differences.
• The production of genetically improved common carp by hatcheries and their
demand in different provinces are highly variable
A barrier to the dissemination of genetically improved carp strains is that many hatcheries
breed local (unselected) strains and that demand for genetically improved strains is low in
some provinces. An added complication is that it is difficult, if not impossible, for
hatchery operators and farmers to distinguish between genetically improved and
unselected local strains at the point of purchase.
The following key recommendations emerge from the studies reported in the document
and earlier reports associated with this project.
31
• Research on the development of genetically improved common carp strains should
be continued as there is clear evidence that these strains are superior under the
conditions of culture compared to local and wild strains.
• Research on the effective dissemination of these strains is required and the
possibility that a form of guarantee or certification can be provided to farmers by
research stations and hatcheries to authenticate that fish being purchased are pure
stocks of genetically improved lines.
• Bioeconomic research is required to determine the cost benefit of using genetically
improved strains and investing in more intensive farming strategies as there may
be little value in farmers with low production systems purchasing genetically
improve carp stocks as the extra expense of buying genetically improved
fingerlings is unlikely to translate into elevated production and income.
• On-farm research and extension activities is required to develop cost effective
strategies to elevate production levels of common carp. These are activities should
be considered of equal importance to the need of producing genetically improved
common carp strains.
• Additional workshops and extension activities with farmers are required to report
the findings of this study and encourage the use of genetically improved common
carp, within the context of the adoption of methods to increase common carp
production.
32
Acknowledgement
Many people contributed to the success of the on-farm trail to compare growth
performance of common carp strains conduced in farmers’ ponds and rice fields in Thai
Nguyen and Yen Bai province as part of CARD project 002/04VIE. The project was given
significant support from the Provincial Fisheries Centers of Thai Nguyen and Yen Bai.
The efforts and assistance of the 40 common carp farmers who participated in these trials
is gratefully acknowledged.
33
Appendices
N
Farm name
Province
Culture
Feed
Strain and No of fish stocked
Area (m2)
input
HP3 H3B VNW LOC
Total
system
1
Luat
Thai Nguyen
Pond
1000
LF
100
100
100
300
2 Ha
Thai Nguyen
Pond
1500
LF
113
113
113
113
452
4 Ke
Thai Nguyen
Pond
550
LF
90
90
180
5 Vinh
Thai Nguyen
Pond
800
LF
80
80
80
240
6
Trong
Thai Nguyen
Pond
1000
LF
100
100
100
300
7
Tuan
Thai Nguyen
Pond
1000
LF
100
100
100
300
8
Truong
Thai Nguyen
Pond
500
HF
75
75
150
9
Lieu
Thai Nguyen
Pond
1000
LF
145
55
100
300
10 Dieu
Thai Nguyen
Pond
600
LF
100
100
200
11 Que
Thai Nguyen
Pond
1000
LF
100
50
150
300
15 Canh
Thai Nguyen
Pond
400
HF
60
60
120
16 Lich
Thai Nguyen
Pond
500
LF
75
75
150
17 Trung
Thai Nguyen
Pond
400
LF
60
60
120
18 Tap
Thai Nguyen
Pond
800
HF
120
120
240
19 Hung
Thai Nguyen
Pond
300
HF
100
100
22 Lien
Yen Bai
LF
113
113
Rice field
1500
113
113
452
23 Ninh
Yen Bai
680
HF
90
90
90
Rice field
270
24 Hom
Yen Bai
800
LF
80
80
80
Rice field
240
25 Hoan
Yen Bai
HF
100
100
100
Rice field
1000
300
27 Hien
Yen Bai
Pond
500
HF
75
75
150
32 Nhan
Yen Bai
Pond
1500
LF
113
113
113
113
452
33 Ly
Yen Bai
Pond
800
LF
120
120
240
35 Thuan
Yen Bai
Pond
1000
LF
100
100
100
300
36 Chung
Yen Bai
Pond
1000
HF
100
100
100
300
37 Thong
Yen Bai
Pond
1000
LF
100
100
100
300
Total
2
796
496
976
21130
1346
3614
Appendix 1. Name of farm, pond, strain and number of fish stocked
LF: Low feed input system; LH: High feed input system.
34
Reference
Austin, C. M., A. Pham, T., B. T. Thai and Q. H. Le. 2007a. Fish breeding practices and stock improvement strategies in Vietnam in relation to common carp. 112. MOFI. 2007. Ministry of Fisheries (http://www.fistenet.gov.vn/details.asp?Object=18163919&news_ID=18170767), Thai, B. T., C. P. Burridge and C. M. Austin. 2007. Genetic diversity of common carp
(Cyprinus carpio L.) in Vietnam using four microsatellite loci. Aquaculture 269: 174-186.
Thai, B. T., A. T. Pham and C. M. Austin. 2006. Genetic diversity of common carp in Vietnam using direct sequencing and SSCP analysis of the mitochondrial DNA control region. Aquaculture 258: 228-240.
Thai, T. B. and G. T. Ngo. 2004. Use of pineapple juice for elumination of egg stickiness of common carp (Cyprinus carpio L.). Asian Fisheries Science 17: 159-162. Thien, M. T. and C. N. Thang. 1992. Selection of common carp (Cyprinus carpio, L) in
Vietnam. Selection of research works (1988 - 1992). Agriculture Publisher House, Hanoi (In Vietnamese). Tran, D. T. 1983. A contribution to morphological mutation of common carp (Cyprinus
carpio L.) in Vietnam, A contribution to morphological mutation of common carp (Cyprinus carpio L.) in Vietnam. Pedagogical University (in Vietnam), Hanoi.