REGULAR ARTICLE
CESAR5.3: Isotopic depletion for Research and Testing Reactor
decommissioning
Guillaume Ritter
*
, Romain Eschbach, Richard Girieud, and Maxime Soulard
CEA, DEN, SPRC, 13108 St Paul-lez-Durance, France
Received: 6 July 2017 / Received in nal form: 4 October 2017 / Accepted: 27 March 2018
Abstract. CESAR stands in French for simplied depletion applied to reprocessing. The current version is
now number 5.3 as it started 30 years ago from a long lasting cooperation with ORANO, co-owner of the code
with CEA. This computer code can characterize several types of nuclear fuel assemblies, from the most regular
PWR power plants to the most unexpected gas cooled and graphite moderated old timer research facility. Each
type of fuel can also include numerous ranges of compositions like UOX, MOX, LEU or HEU. Such versatility
comes from a broad catalog of cross section libraries, each corresponding to a specic reactor and fuel matrix
design. CESAR goes beyond fuel characterization and can also provide an evaluation of structural materials
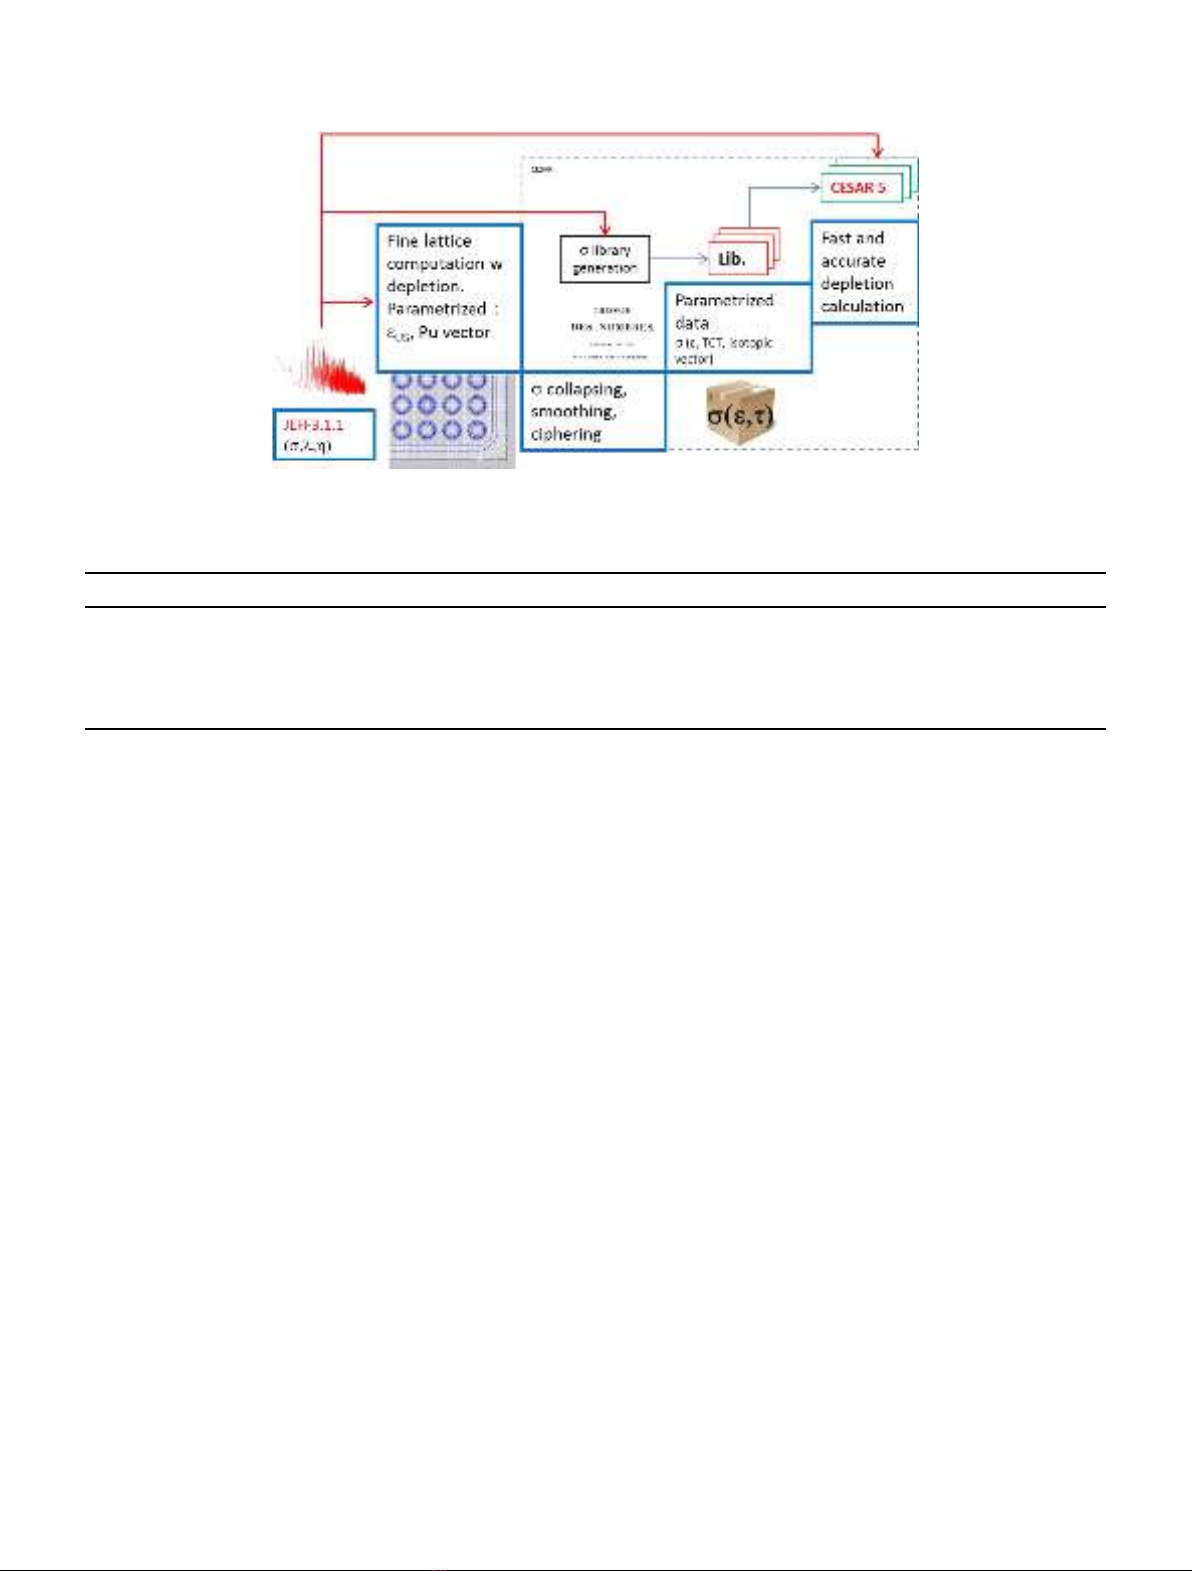
activation. The cross-sections libraries are generated using the most rened assembly or core level transport code
calculation schemes (CEA APOLLO2 or ERANOS), based on the European JEFF3.1.1 nuclear data base. Each
new CESAR self shielded cross section library benets all most recent CEA recommendations as for
deterministic physics options. Resulting cross sections are organized as a function of burn up and initial fuel
enrichment which allows to condensate this costly process into a series of Legendre polynomials. The nal
outcome is a fast, accurate and compact CESAR cross section library. Each library is fully validated, against a
stochastic transport code (CEA TRIPOLI 4) if needed and against a reference depletion code (CEA DARWIN).
Using CESAR does not require any of the neutron physics expertise implemented into cross section libraries
generation. It is based on top quality nuclear data (JEFF3.1.1 for 400 isotopes) and includes up to date
Bateman equation solving algorithms. However, dening a CESAR computation case can be very
straightforward. Most results are only 3 steps away from any beginners ambition: Initial composition, in
core depletion and pool decay scenario. On top of a simple utilization architecture, CESAR includes a portable
Graphical User Interface which can be broadly deployed in R&D or industrial facilities. Aging facilities currently
face decommissioning and dismantling issues. This way to the end of the nuclear fuel cycle requires a careful
assessment of source terms in the fuel, core structures and all parts of a facility that must be disposed of with
industrial nuclearconstraints. In that perspective, several CESAR cross section libraries were constructed for
early CEA Research and Testing Reactors (RTRs). The aim of this paper is to describe how CESAR operates
and how it can be used to help these facilities care for waste disposal, nuclear materials transport or basic safety
cases. The test case will be based on the PHEBUS Facility located at CEA Cadarache.
1 Introduction
The CESAR project was initiated about 30 years ago as a
cooperative action conducted both by French CEA
(Atomic Energy Commission) and ORANO. It was
dedicated to characterize the ow of isotopes coming
through the La Hague Nuclear Fuel Reprocessing Plant in
France/region of Normandy. Basically from a used fuel
sub-assembly to the associated recycled MOX and the
different cans of waste.
At the beginning, only a few heavy nuclides were
treated. Then, step by step, Fission Products and other
Structural Materials or Impurities were added to the list, so
that, as of today, the fate of 486 isotopes can be computed
fast and accurately.
CESAR provides isotopic concentrations and all
physics parameters that can be drawn like IAEA Safety
transportation class, decay heat or gamma emissions. Such
results then proved to be useful not only for the fuel cycle
industry but also in much smaller facilities like CEA fuel
engineering hot cells, severe accident experiments or
Research and Testing Reactor (RTRs).
The goal of this paper is to show how CESAR works,
what it produces and how helpful it can be for unusual uses
*e-mail: Guillaume.Ritter@CEA.Fr
EPJ Nuclear Sci. Technol. 4, 10 (2018)
©G. Ritter et al., published by EDP Sciences, 2018
https://doi.org/10.1051/epjn/2018008
Nuclear
Sciences
& Technologies
Available online at:
https://www.epj-n.org
This is an Open Access article distributed under the terms of the Creative Commons Attribution License (http://creativecommons.org/licenses/by/4.0),
which permits unrestricted use, distribution, and reproduction in any medium, provided the original work is properly cited.
in operation and dismantling of RTRs. Evaluation of mass
inventory, activity, decay heat, radiation sources are
necessary to operate a facility on a day-to-day basis. But
dismantling also requires evaluations of biological shield-
ing, decay heat removal, reprocessing, transport, safety
classication, waste interim storage or disposal. The last
main version of CESAR was released in 2012 [1]. The new
issue for CESAR is neither a recently updated Graphical
User Interface (2015) nor a new simplied dose rate
computation module (2016) but rather being used in a
different industrial environment (RTR decommissioning)
than before (mostly recycling).
2 Depletion and decay made easy
The goal of this chapter is to address the means by which
CESAR characterizes isotopic inventories. This process
takes place either during in-core fuel burn up or outside
of the neutron ux, where natural radioactive decay
happens.
2.1 Isotopic evolution
CESAR solves the standard Bateman depletion equation
[2], applied to reactor operations as in the following form
(applicable to e.g. actinides):
See equation (1) above
where
N(t) = concentration of an isotope A
Z

at time t;
(t) = neutrons ux at time t;
s(t) = cross section at time t;
l= half life decay constant.
In equation (1), an illustration of isotopic evolutions
taking place under neutron ux is exposed. This
illustration is not comprehensive. Cross sections corre-
spond to a set of typical reactions under neutron ux.
Such reactions include neutron capture, n2nscattering
and ssion.
For ssion products and for some activation products,
this system includes a global ssion yield (see Eq. (2)),
operating as a sum of the ssion rate of a ssionable
actinide multiplied by the ssion yields of the ssion
product for this ssionable actinide.
Y
GA
Z

¼X
fissionable
actinides
j
g
jA
Z

tj:ð2Þ
where:
t
j
=ssion rate of the ssile nucleus j;
g
j
= Production yield of isotope A
Z

from ssile nucleus j.
For activation products, other reaction types [(n,a),
(n,p),] are taken into account.
Solving equation (1) provides isotopic concentrations
for heavy nuclides, ssion products, impurities and
activated structural materials.
All basic nuclear data comes from [3]; 2/3 ssion yields
are cumulated and 1/3 are independent.
Two different types of solvers have been developed to care
for either in-core depletion or off-core decay (cf. Sect. 2.2).
2.2 Computation
In-core depletion is solved using the Runge Kutta 4th order
method and off core decay is solved using a matrix
exponential method, more specically with a Taylor Series
type of algorithm [4].
In both cases, the overall isotopic matrix is split
in several smaller easier to solve systems which makes
computations faster. As an example, characterizing the
behaviour for a typical UOX 17 17 PWR sub-assembly
takes less than 20 s without optimization on a desktop
computer (e.g. Dell Precision Tower 7810 with Linux
3.16.0-4-amd64 #1 SMP Debian 3.16.43-2 86_64
GNU/Linux running onto 8 processors type Intel(R)
Xeon(R) CPU E5-2637 v3 @ 3.50 GHz and 32 Gb
Memory).
Hypotheses for this computation are given in the
following table.
Running the same case using a touchscreen, instead of
usual mouse and keyboard, yields identical performance.
The other complementary reason for fast computa-
tions is all decay chains are included in the executable
software, forgetting about numerous disk access losses to
an external le during a run. Moreover, chains are cut to
an optimum to save on computation time whilst
preserving predictivity.
dNðtÞ
dt A
Z

¼ðtÞ½cðtÞNðtÞ A1
Z

þðtÞ½n;2nðtÞNðtÞ Aþ1
Z

þ½þNðtÞ A
Zþ1

þ½NðtÞ A
Z1

þ½NðtÞ Aþ4
Zþ2

þ½TI NðtÞ Am
Z

ðtÞ½ðcðtÞþfðtÞþn;2nðtÞÞNðtÞ A
Z

½ðhalflifeÞNðtÞ A
Z

ð1Þ
2 G. Ritter et al.: EPJ Nuclear Sci. Technol. 4, 10 (2018)
And as computations do not all require the compre-
hensive list of CESAR isotopes to go even faster, it is
possible to skip (or add) a hundred more actinides (from
206
Pb to
257
Fm) and their spontaneous ssion for long
cooling times.
Last to be mentioned, but not the least, the trickiest
parameter as for core physics i.e. microscopic cross
sections, are (almost) not computed during this Bateman
step, as will be described in Section 3. This saves at least
99% computer time.
After solving the Bateman equation, users seldom
simply need isotopic concentrations. This is why compu-
tations can continue to produce all complementary
parameters, as described hereafter.
2.3 What results beyond isotopic concentrations
Users can draw from concentrations all the following
parameters:
mass inventory;
activity (a,b, Isomeric Transitions);
decay heat (a,b,g);
neutron, aand gsource and spectrum, including ray
spectrum (spontaneous ssion and (a,n) reactions in
oxide fuel);
dose rate at 1 m in air for a point source;
radiotoxicity source;
coefcients used for the transport of nuclear material;
coefcients used for the classication of radioactive
substances.
CESAR provides fast and abundant results. Uncer-
tainties are computed outside, within the DARWIN
package, on which CESAR is validated (cf. Sect. 3.2).
3 CESAR cross section libraries
The goal of this chapter is to present how CESAR cross
sections are elaborated, packed as dedicated libraries and
eventually validated.
3.1 Generation
Cross sections in equation (1) correspond to reactions
caused by neutrons, i.e. occurring during in-core burnup.
Therefore, it has to account for neutron physics phenomena
due to the ux distribution.
Assessment of the cross sections is performed by CEA
scientic staff with dedicated reactor lattice physics
computer codes like CEA APOLLO2
TM
[5] or ERANOS
TM
[6]. Characterization of any original new core design can take
months, from technological data collection to the end. Basic
nuclear data come from [3], just as for depletion. Only
reactor worth isotopes are characterized during this process.
It concerns 100 isotopes that have a signicant inuence on
reactivity.
Choosing the appropriate code depends on the expected
core physics (fast or thermal spectrum). Determination of
cross sections requires an accurate modelling of the fuel
geometry (in most cases 2D), with adapted space mesh,
boundary conditions and energy binning as well as
appropriate isotope-wise self-shielding options. In the case
of e.g. BWR concepts, it is also necessary to dene a 3D
model in order to include modelling of axial void effects.
Cross sections are computed at each step of burn up so
that any light change in the ux distribution due to ssion
products build up, heavy nuclides depletion or e.g. boron
concentration evolution can be safely accounted for. It is
also computed for several initial enrichments or isotopic
vectors, each causing a different shape of neutron spectrum
at the beginning of life and during depletion. This energy
wise spectrum is recorded as a representative signature of
core physics conditions.
At the end of this part, cross sections
s
(burn up, initial enrichment, initial isotopic vector)
are processed
through the following steps with a tool called APOGENE:
collapsing in one energy group using the computed
neutron energy spectrum. This operation concerns both
100 reactor worth isotopes and all other 400 isotopes
among CESARs for which an innite dilution general
purposesexists [3].
tting one group cross sections
s
(burn up, initial enrichment, initial isotopic vector)
to Legendre
polynomials and extracting the corresponding coef-
cients. More precisely, it determines a set of coefcient
degrees providing results closest to the original gure.
ciphering the coefcients;
packing the whole into a dedicated CESAR cross section
library, called a BBL.
Figure 1 next page shows how CESAR cross section
libraries are generated.
After this process, it can be used with CESAR to
determine the isotopic inventory.
On top of this process, another step is added to make
sure predictions are valid, as described in the following
chapter.
3.2 Validation process
CESAR uses generic radioactive decay data from [3] and
specic cross sections estimated thanks to Legendre
polynomials as described in the previous chapter.
However, it must be checked whether a short list of 500
isotopes, only accounting for independent ssion yields,
cumulated with polynomials estimated cross sections
succeeds in providing technically affordable results.
This is why CESAR is validated against DARWIN
TM
[1,7,8], CEA reference computer package for isotopic
inventory evolution.
DARWIN
TM
computes all 3800 isotopes from
JEFF3.1.1. It includes independent ssion product yields
with their comprehensive decay chain and its results are
successfully compared to experimental data coming from
several types of irradiated fuel section dissolution chemical
analysis programs. Some DARWIN results are also currently
undergoing a growing uncertainty analysis programme [9].
After generating new CESAR slibraries, results from
both CESAR and DARWIN corresponding to the same test
case are controlled in order to check consistency. Possible
slight discrepancies only concern a handful of isotopes with
G. Ritter et al.: EPJ Nuclear Sci. Technol. 4, 10 (2018) 3
signicant concentrations and are then of the order of a
few %. For other isotopes, concentrations or offsets are much
lower and neglected. Such gures will be discussed in deeper
details in the chapter pertaining to the PHEBUS facility.
This procedure can be complemented with computer
random testing of the new CESAR library. It will concern
1000 cases checking whether the code actually operates
within the assigned domain and fails outside.
As a consequence, CESAR straightly benets all the
outcome of the comprehensive effort dedicated to improv-
ing DARWIN results as compared to measurements and to
reducing all associated uncertainties.
4 The graphical user interface
This chapter is dedicated to potential CESAR users and
aims at showing how anyone in a decommissioning facility
can set up a computation and get good results.
This GUI is a graphical computer application that
makes lling CESAR input les and understanding and
exploiting CESAR output les as easy as ordering an item
on a commercial sales internet URL.
4.1 Main features
This Graphical User Interface was updated in 2016 to
include gdose rate in air at 1 m for a point source.
CESAR can be launched by experts in a computer
batch process with a dedicated input deck. However, the
interface makes it easier to use on about any common
platform (Linux, Windows, Apple).
It was developed in C++ with Open source QT5
technology [10], which makes it compatible with numerous
other applications like CEA platform SALOME [11]. It is
touch screen compatible. Exchange le format is xml thus
providing a large exibility. Drag and drop can be used
between most parameters and users will have instant online
help with generalized tooltips.
4.2 Using it
A typical computation is based on 2 steps : 1st generating a
set of isotopic concentrations as a function of compound
history; 2nd extracting any desired data from concen-
trations.
The input of a CESAR computation includes initial
compositions, a selection of cross section library and a
description of irradiation and/or decay history.
Isotopic initial compositions can be entered in several
units (Absolute mass, Atoms/cc, Mass %, Atom %, TBq),
all dynamically proportional.
It can be located off exposure to any neutron ux or
within a reactor core.
In that later case, users have to select a cross sections
set matching their hypotheses in the available catalog of
core designs. At CEA, about 100 such libraries (BBL)
have already been generated (see Tab. 2 hereafter). Such
developments were led either in collaboration with
ORANO, or exclusively for ORANO, or exclusively for
CEA.
Elaborating the compound history consists in adding
consecutive phases corresponding either to in-core burn up
Fig. 1. Cross section generation process.
Table 1. Reference computation hypotheses for code performance characterization.
Fuel features (1 medium) Irradiation history Requested output
UOX: mass fractions 3.5%
235
U + 96.5%
238
U
Total mass 1T
HM
Fuel impurities: 190 ppm of
oxide initial mass
3 consecutive in-core cycles, each
including 330 days at average power
33 W/g
HM
followed by 35 inter-cycle
days at 0 power. Then 3 years in pool
cooling period
Isotopic concentrations of all nuclides
(Heavy Nuclides, Fission Products and
Activation of fuel impurities by-
products) at end of cooling. 486 isotopes
computed.
4 G. Ritter et al.: EPJ Nuclear Sci. Technol. 4, 10 (2018)
or decay anywhere: cooling or storage in a pool or e.g. in a
repository. Users just have to enter duration and burn up or
power rate of each phase.
Any depletion computation set up can be saved under
text or xml formats.
Setting CESAR output parameters comes afterwards.
The resulting computed concentrations are processed
to extract all needed data (cf. Sect. 2.3). In that
perspective, such parameters can be selected from a
complete table as shown in following Figure 2.This
selection window allows choosing which parameter in
which unit will be useful. It provides output results both
in a text mode including as many tables as desired and
in a csv or xml format which make it compatible with
numerous other applications, including previous ver-
sions of the Graphical User Interface. A basic plot
function can be activated for any of all desired isotopes
and parameters. Results can be sorted either alphabeti-
cally (e.g. to nd an isotope) or numerically (for
example, to identify a main contributor to gdose rate
after 10 years decay).
This post processing set up is also saved under text or
xml format. It includes all hypotheses from initial
composition and compound history to e.g. gemission
spectrum binning in energy or isotopic contribution to b
decay + gheat.
Isotopic evolution studies can be performed in a users
ofce as well as on the eld with a portable computer or a
touch screen tablet.
CESAR does not require any of core neutron physics or
nuclear data knowledge and it actually proves to be user
friendly on a day to day basis.
5 Decommissioning Research and Testing
Reactors at CEA
5.1 Description of those facilities concerned with
dismantling
At CEA, the RTR eet was mostly designed and built in
the 1960s1970s and several facilities have now stopped
operations.
Some reactors are still operating like ORPHEE
1
, a high
ux beam core in Saclay or CABRI, a reactivity transient
test reactor with a pressurized water loop in Cadarache,
which is currently being renovated.
For decommissioning facilities, it is essential to
generate dedicated cross sections in order to be able to
quantify fuel isotopic inventories stored in decay pools or in
hot cells.
Among the reactors for which decommissioning has
started, those given in the following Table 2 already have a
fuel characterization library available for CESAR although
these were mostly developed for fuel recycling purposes.
In this part, CESAR computations applied to PHEBUS
and CABRI will be presented and analysed.
5.2 How does CESAR help
In facilities presented in Table 3, the core has already been
unloaded. Fuel sub assemblies may be stored in a decay
pool or in a dry storage facility.
Table 2. Main core design libraries developed at CEA.
Fuel/Reactor Initial U-235 or Pu enrichment
Maximum burnup
Note
PWR UOX
(fuel)
Up to 5%
Up to 100 GWd/t
17 17 but also 14 14, 15 15, 16 16, 18 18, and
reprocessing uranium based fuel, etc,
Subassembly
structures
Up to 5% (UOX PWR) and 12%
(MOX, FBR) Up to 100 GWd/t
Libraries divided into different parts: Top nozzle, spring
plug, plenum, clads and grids, bottom end plug, bottom
nozzle
BWR UOX Up to 4.5 % Up to 72 GWd/t 9 9, 8 8. Libraries divided into different parts to account
for axial heterogeneity (void fraction or initial
composition). Burn-up also has an inuence on axial power
level.
PWR MOX Up to 12% Up to 100 GWd/t 17 17 but also 14 14, 15 15, 16 16 Effects of initial
plutonium composition on cross section sets are taken into
account.
BWR MOX Up to 6.1 % Up to 50 GWd/t Libraries divided into different parts to account for axial
heterogeneity (void fraction or initial composition).
Heavy Water Up to 94 % Up to 440 GWd/t French and foreign experimental old reactors
Fast Reactor Up to 25 % Up to 200 GWd/t Phenix, RAPSODIE, European Fast Reactor
Gas Cooled ReactorUp to 1,7% Up to 11 GWd/t Metallic fuel, Graphite moderator, Low enrichment
uranium
MTR Up to 94 % Up to 1000 GWd/t Rods, at or cylindrical plates experimental facilities
1
These libraries have been developed specically for ORANO, for
reprocessing at La Hague plant purposes.
G. Ritter et al.: EPJ Nuclear Sci. Technol. 4, 10 (2018) 5