REGULAR ARTICLE
Structural integrity assessment and stress measurement
of CHASNUPP-1 fuel assembly
Part A: under tensile loading condition
Waseem
*
, Ghulam Murtaza, Ashfaq Ahmad Siddiqui, and Syed Waseem Akhtar
Directorate General Nuclear Power Fuel, Pakistan Atomic Energy Commission, PO Box No. 1847, 44000 Islamabad, Pakistan
Received: 10 September 2015 / Received in nal form: 26 November 2015 / Accepted: 28 January 2016
Published online: 8 April 2016
Abstract. Fuel assembly of the PWR nuclear power plant is a long and exible structure. This study has been
made in an attempt to nd the structural integrity of the fuel assembly (FA) of Chashma Nuclear Power Plant-1
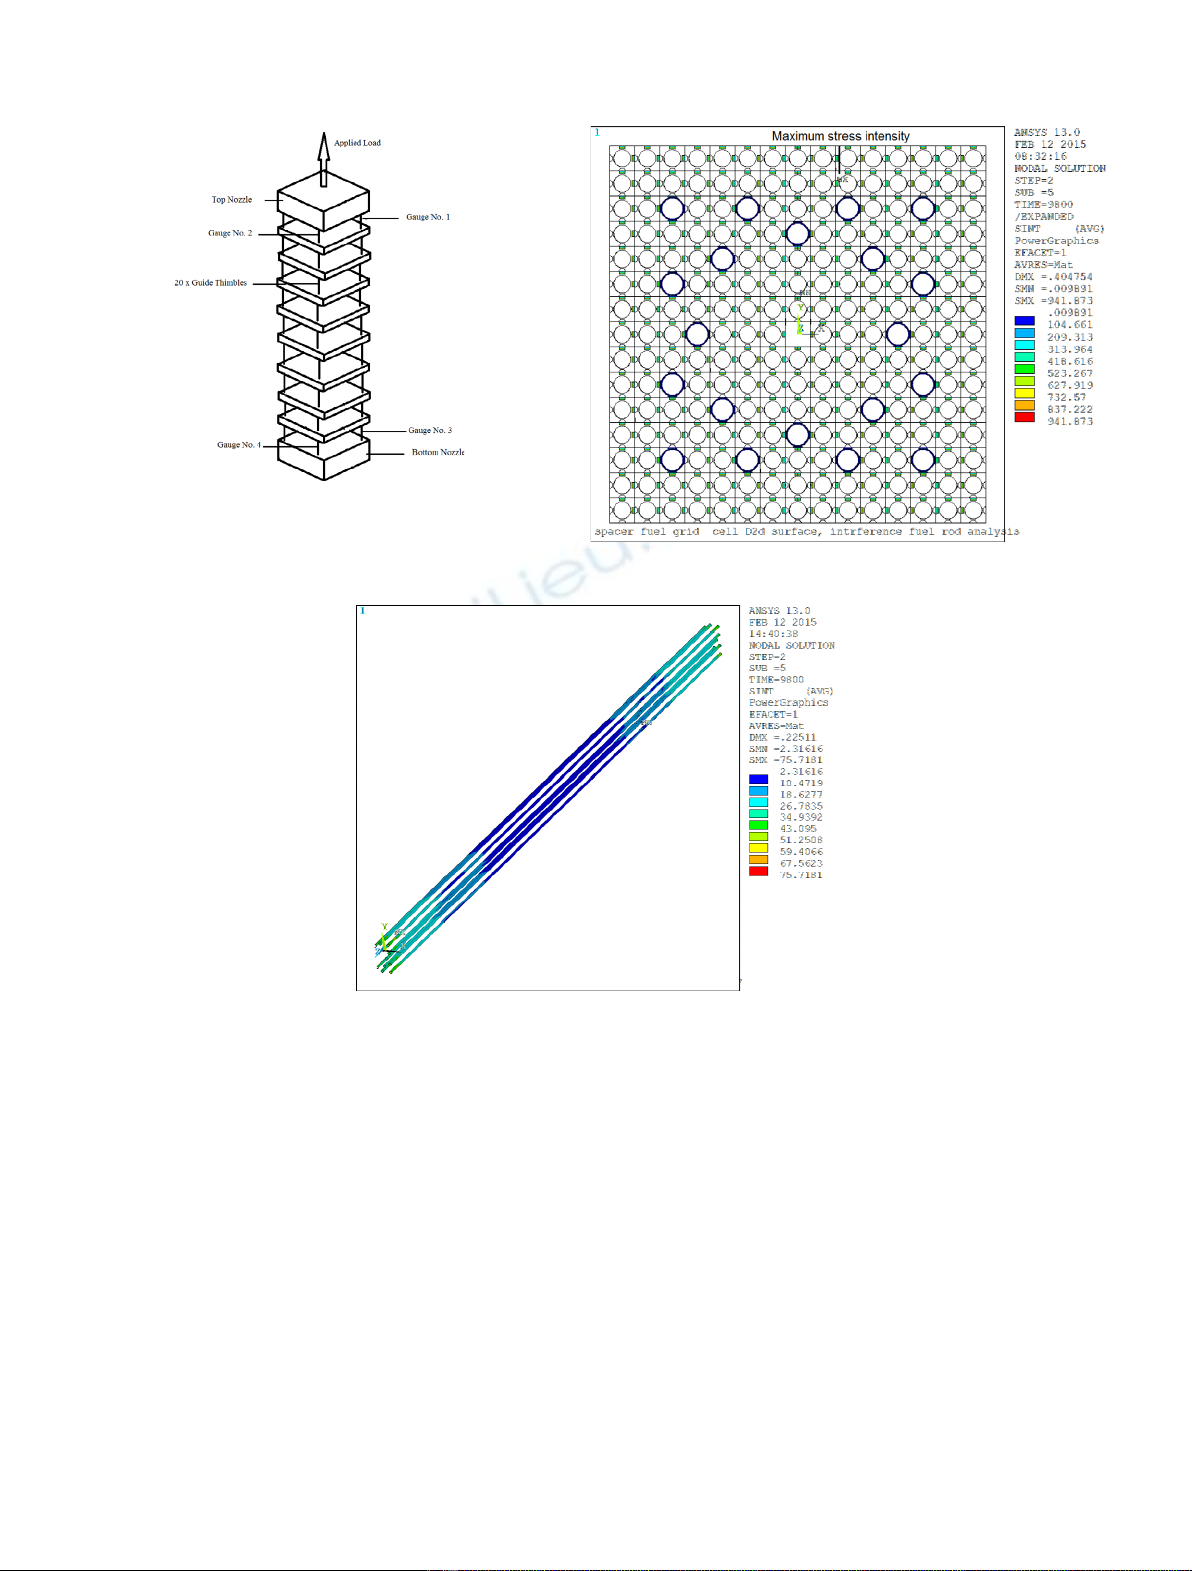
(CHASNUPP-1) at room temperature in air. The non-linear contact and structural tensile analysis have been
performed using ANSYS 13.0, in order to determine the fuel assembly (FA) elongation behaviour as well as the
location and values of the stress intensity and stresses developed in axial direction under applied tensile load of
9800 N or 2 g being the fuel assembly handling or lifting load [Y. Zhang et al., Fuel assembly design report,
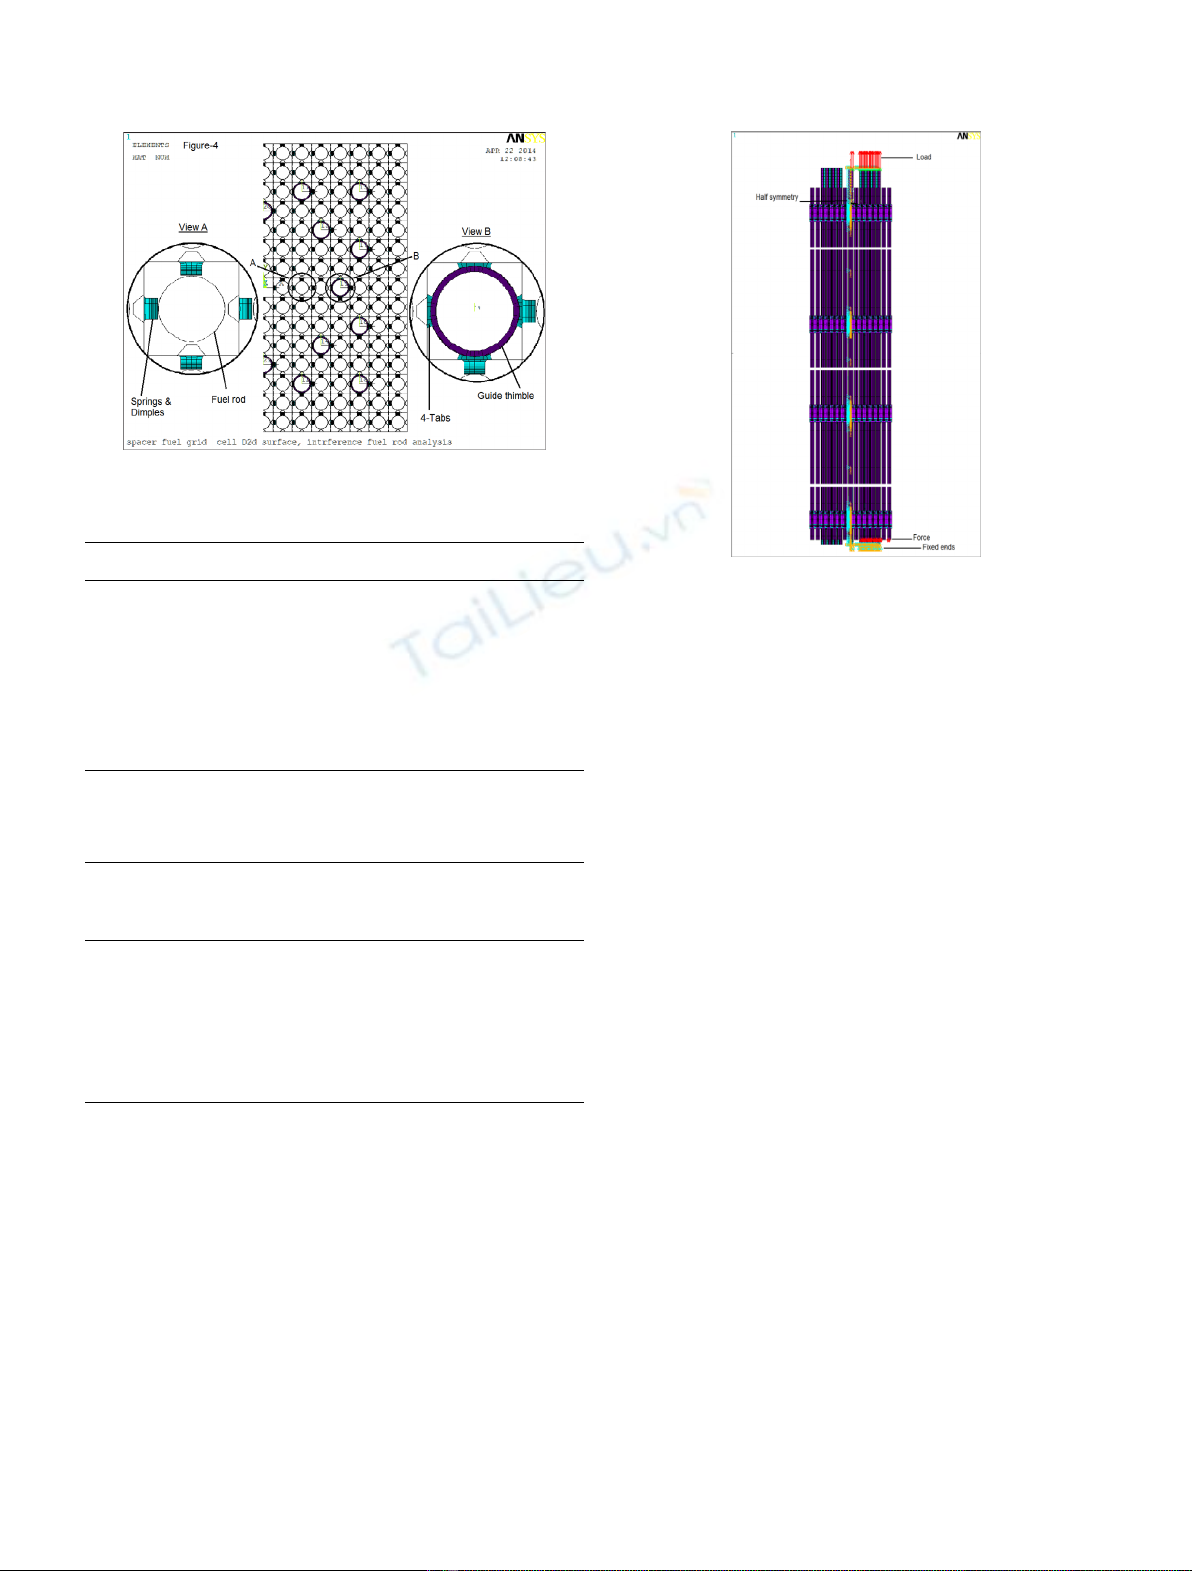
SNERDI, China, 1994]. The nite element (FE) model comprises spacer grids, fuel rods, exible contacts
between the fuel rods and grids supports system and guide thimbles with dash-pots and ow holes, in addition to
the spot welds between spacer grids and guide thimbles, has been developed using Shell181, Conta174 and
Targe170 elements. FA is a non-straight structure. The actual behavior of the geometry is non-linear due to its
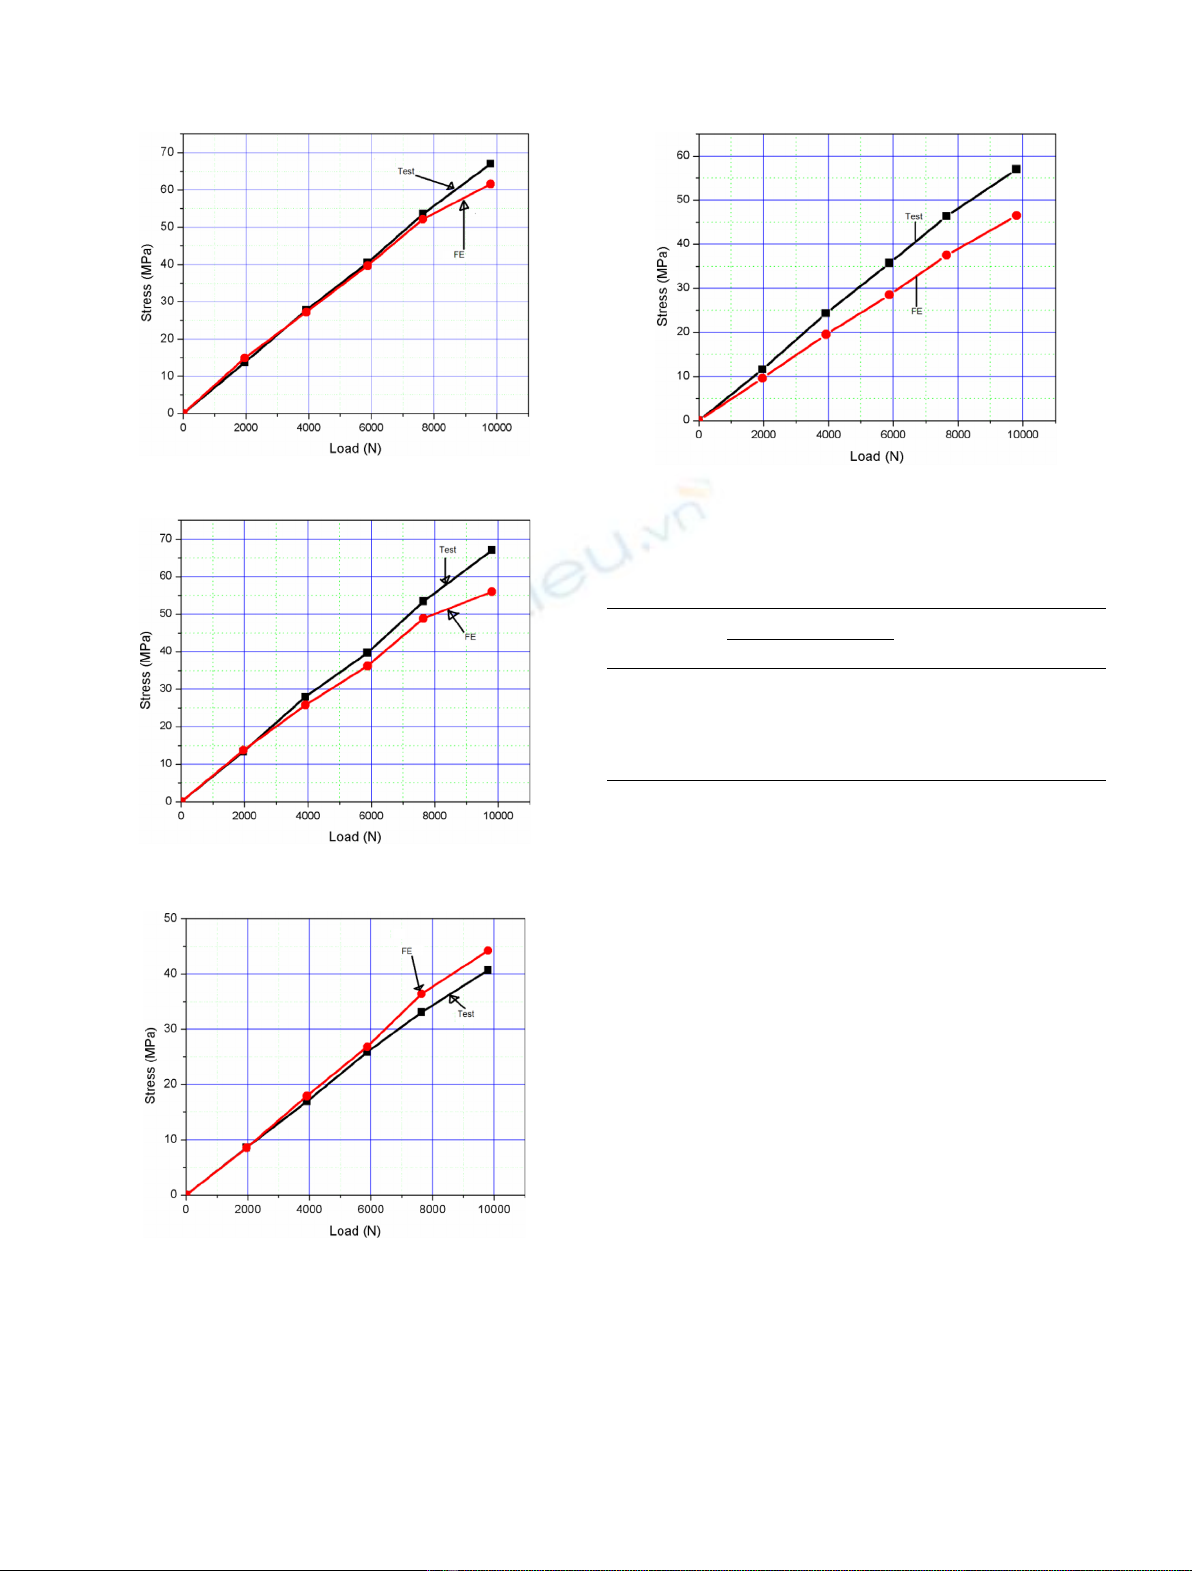
curvature or design tolerance. It has been observed that fuel assembly elongation values obtained through FE
analysis and experiment [SNERDI Tech. Doc., Mechanical strength and calculation for fuel assembly, Technical
Report, F3.2.1, China, 1994] under applied tensile load are comparable and show approximately linear behaviors.
Therefore, it seems that the permanent elongation of fuel assembly may not occur at the specied load. Moreover,
the values of stresses obtained at different locations of the fuel assembly are also comparable with the stress values
of the experiment determined at the same locations through strain gauges. Since the results of both studies
(analytical and experimental) are comparable, therefore, validation of the FE methodology is conrmed. The
stress intensity of the FE model and maximum stresses developed along the guide thimbles in axial direction are
less than the design stress limit of the materials used for the grid [ASTM, Standard specication for precipitation
hardening nickel alloy (UNSN07718) plate, sheet, and strip for high temperature service, B 670-80, USA, 2013],
fuel rod [ASTM, Standard specication for wrought zirconium alloy seamless tubes for nuclear reactor fuel
cladding, B 811-02, USA, 2002] and the guide thimble [ASTM, Standard specication for seamless stainless steel
mechanical tubing, A 511-04, USA, 2004]. Therefore, the structural integrity criterion of CHASNUPP-1 fuel
assembly is fullled safely at the specied tensile load.
1 Introduction
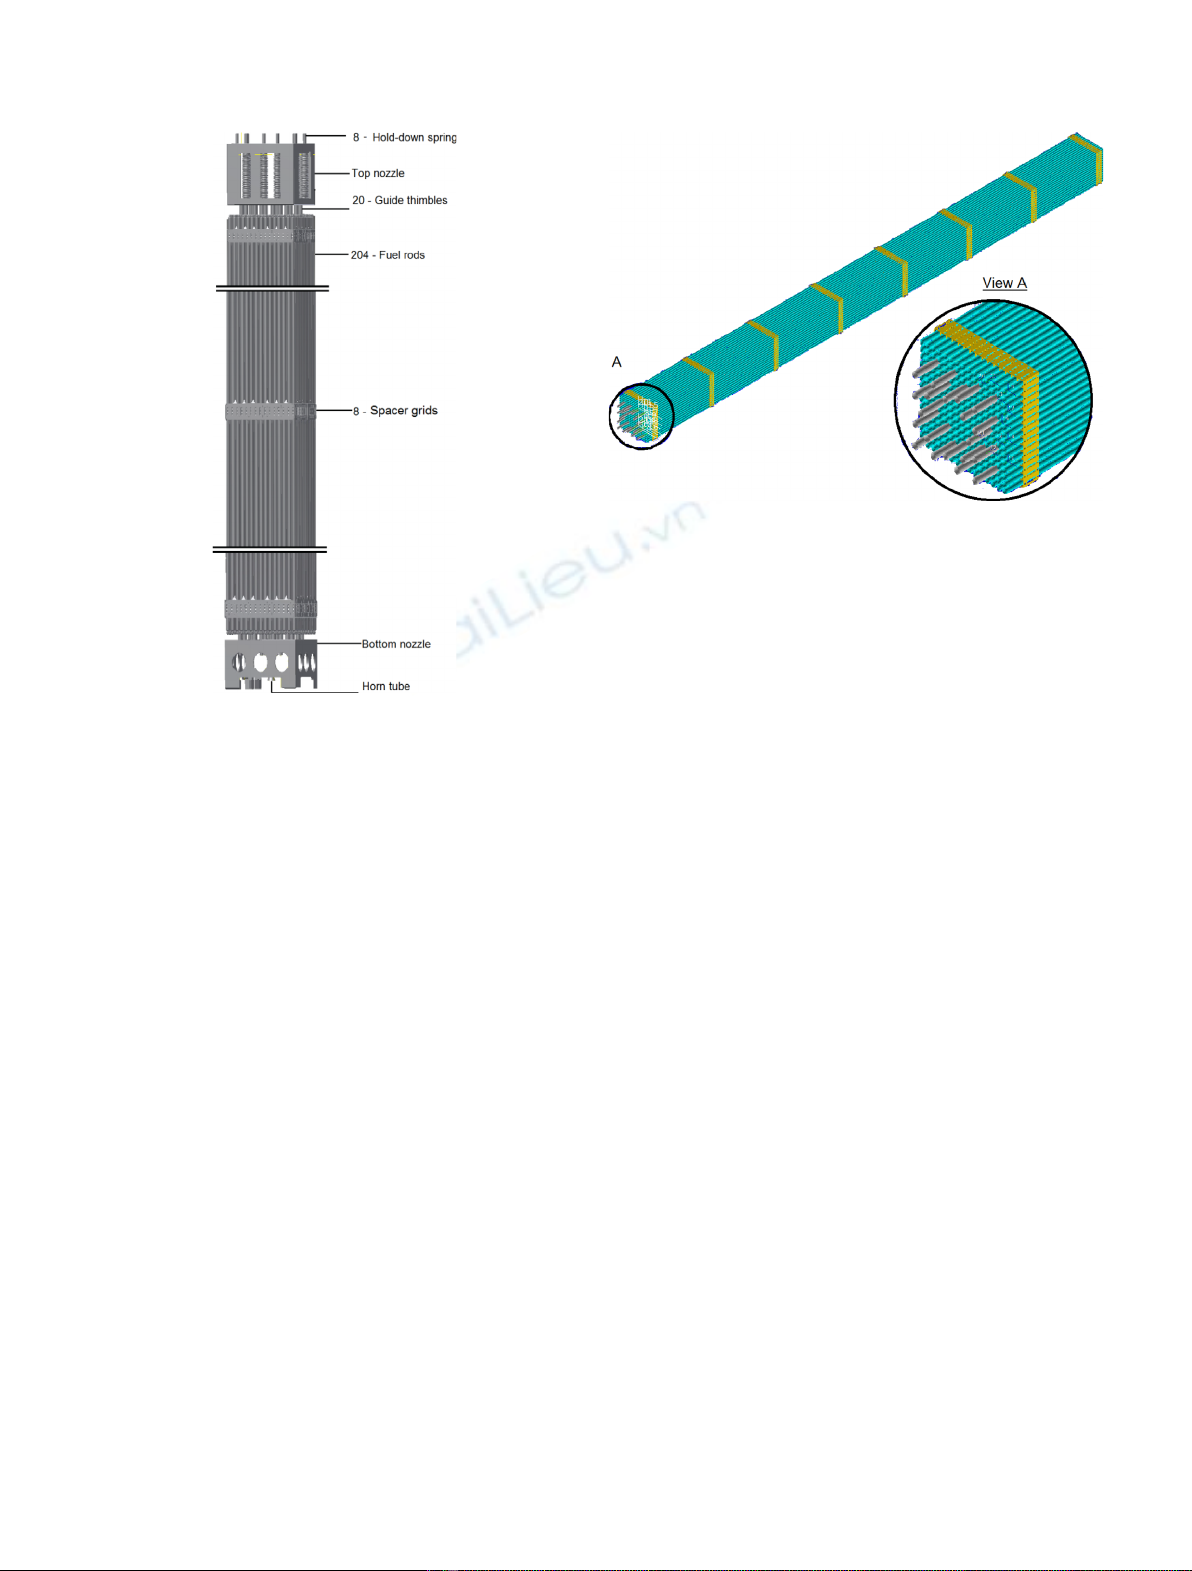
CHASNUPP-1 fuel assembly consists of a 15 15 square
array of fuel rods, spacer grids, guide thimbles, instrumen-
tation tube, and top and bottom nozzles. The 3D model of
fuel assembly containing 20 guide thimbles, 204 fuel rods
and an instrumentation tube in conjunction with the 8
spacer grids and top and bottom nozzles, has been
developed using the Inventor software, and is shown in
Figure 1.
In fuel assembly, fuel rods are held by spacer grids
supports system (springs and dimples) to maintain rod-to-
rod centerline spacing along the entire length of fuel
assembly [1]. The material of top and bottom nozzles,
instrumentation tube and guide thimbles is SS-321,
whereas spacer grids and fuel rod cladding are made up
of Inconel-718 and Zircaloy-4, respectively.
The fuel assembly of pressurized water reactor (PWR)
bears a variety of loads, such as tensile, compressive,
bending, torsional, impact, etc., while undergoing through
handling, shipping and reactor operation. The structural
strength of the fuel assembly is supplied by the skeleton of
the fuel assembly.
* e-mail: wazim_me@hotmail.com
EPJ Nuclear Sci. Technol. 2, 18 (2016)
©Waseem et al., published by EDP Sciences, 2016
DOI: 10.1051/epjn/2016008
Nuclear
Sciences
& Technologies
Available online at:
http://www.epj-n.org
This is an Open Access article distributed under the terms of the Creative Commons Attribution License (http://creativecommons.org/licenses/by/4.0),
which permits unrestricted use, distribution, and reproduction in any medium, provided the original work is properly cited.
The guide thimble tubes are connected with grids by
means of spot welds [2]. The top end of the guide thimbles
and instrumentation tube are TIG welded with the adapter
plate of the top nozzle, while the lower end of the guide
thimbles are fastened to the bottom nozzle by bolting.
Previously, we had made study of non-linear buckling
analysis of CHASNUPP-1 skeleton and fuel assembly under
applied compression load, in order to determine the
deformation behavior, stresses and area of the stress
concentration [3,4]. Our present study is a part of series of
studies which are being conducted in an attempt to
contribute towards current research on the design and
development work of the PWR fuel assembly. We have now
performed the non-linear axial tensile analysis to determine
the elastic elongation and assess structural integrity of the
fuel assembly under applied axial tensile load of 9800 N
(2 g) at room temperature. The results obtained through
the FE analysis have been compared with the experimental
results, which show good agreement and conrm the
validation of FE methodology.
2 FE model and computational details
CHASNUPP-1 fuel assembly possesses symmetry in
geometry, material properties and loading conditions.
Therefore, in this analysis advantage of symmetry has
been taken into account by considering half symmetry of
fuel assembly to reduce the size and computational time of
the FE model.
The detailed FE model of CHASNUPP-1 fuel assembly,
consisting of guide thimbles, fuel rods, spacer grids with
supports systems (springs and dimples) and spot welds
(diameter 2.4 mm) between the guide thimbles and the
grids tabs, has been developed using ANSYS 13.0. FE
model has been solved using multi-load step. In the rst
step, contacts between the grid supports (springs and
dimples) and the fuel rods have been developed using non-
linear contact analysis [1]. In the second load step, non-
linear tensile analysis has been performed to determine
elastic elongation behaviour and the area of stress
concentration of the fuel assembly under the applied fuel
assembly handling or lifting load, i.e. 2 g. The mass of
CHASNUPP-1 fuel assembly with RCCA is 465 kg. By
taking acceleration of 9.81 m/s
2
, the load equivalent to 1 g
is 4650 N and the max. applied load equivalent to 2 g or
9800 N at room temperature conditions. The detailed solid
model is illustrated in Figure 2.
Shell181 element type is used to create mapped meshing
(Quadrilateral Elements). It is a 4-node element with 6-
degrees of freedom, well suited for linear, large rotation or
displacements, and/or large strain non-linear application.
After creating the underlying FE model, the exible
surface-to-exible surface contact pairs have been created
using the element types Conta174 and Targe170. The
coefcient of friction between fuel rod and grid determined
experimentally is taken as 0.35 [5]. The details of FE model
are shown in Figure 3.
The entities developed in the FE model are mentioned
in Table 1.
The thicknesses of guide thimble, fuel rod and grid,
0.5 mm, 0.7 mm, and 0.3 mm, respectively, are dened by
giving real constant values. The material properties of
guide thimble, fuel rod and spacer grid used in the present
FE analysis are given in Table 2.
Simulations of the boundary conditions of CHAS-
NUPP-1 fuel assembly under applied tensile load have been
applied as follows:
to constrain the FE model, all nodes at lower end of the
guide thimble have been xed in all directions;
to simulate the symmetry boundary conditions, transla-
tion of all the nodes at the inside edge of one-half portion
Fig. 1. 3D solid model of CHASNUPP-1 fuel assembly.
Fig. 2. Model geometry.
2 W.G. Murtaza et al.: EPJ Nuclear Sci. Technol. 2, 18 (2016)
of the fuel assembly has been xed, i.e. nodes along Y-axis
are xed in X-direction;
the applied axial tensile load of 9800 N has been divided
onto 20 guide thimbles and the load of each guide thimble
is distributed on the nodes associated with the upper end
of the guide thimble in Z-direction;
all nodes associated with the upper end of the guide
thimbles have been coupled in load direction, i.e. Z-
direction, other degrees of freedom are set to be zero;
the weight of fuel rod, 2.114 kg or 21 N, is applied on each
fuel rod which is further distributed on the nodes associated
with the bottom end of the fuel rod in Z-direction.
FE model, including all above-mentioned boundary
conditions, is presented in Figure 4.
3 Experimental model
The fuel assembly bears a variety of loads as discussed
earlier. Therefore, fuel assembly should have adequate
stiffness, strength and dimensional stability to reduce the
damage and large elongation failure due to the fuel
assembly handling or lifting. This test will provide the
basis for the design of fuel assembly, manipulator crane and
container and tools which are used in the fuel handling
process. In the present study, we have considered the axial
tensile test of fuel assembly which has been performed on
the prototype full-scale test specimen of fuel assembly at
room temperature as shown in Figure 1 except that the
pellets of fuel rods are dummy but they are similar in the
geometry and weight.
The test facility contains a frame structure of high
stiffness and strength. The frame structure is made through
welding of the channels beams and steel plates. A
convenient load applying system is also developed in order
to measure the signals under loading conditions during the
test. The force transducer of BLR-1 type is used for the
tensile load to measure the force. Foil-type strain gauges of
23 mm are used for the strain measurement. The
resistance of strain gauges is 120 ±0.2 V, and its sensitivity
coefcient is 2.17 ±1%. The material, silicone type, which
solidies at room temperature, is used for moisture proof
seal [6].
First of all, the test specimen is placed within the
calibrated leveled support plates of load applying system
and the parallelism of the support plates is adjusted within
the specied tolerances of the fuel assembly. Then
maximum tensile load of 9800 N, with load increment of
1960 N, is applied on the loading plate, which is divided
onto 20 guide thimbles in axial direction.
All guide thimbles are similar in material, geometry and
loading conditions, therefore, the strain gauges are mainly
pasted on ve levels of the guide thimbles. These levels are
located on the two corners of one side/face of the fuel
Table 1. Entity details of the FE model.
Entity Quantity
Key points (KP) 266,989
Lines (L) 488,897
Areas (A) 210,232
Nodes (N) 942,850
Shell181 elements 1,005,992
Conta174 elements 78,336
Targe170 elements 91,776
Table 2. Material properties of grid, guide thimble and
fuel rod.
Materials Yield
strength
(MPa)
Tensile
strength
(MPa)
Modulus of
elasticity
(GPa)
Poissons
ratio (g)
Grid (GH-169A
alloy/
Inconel-718)
1034 15201700 205 0.3
Guide thimble
(SS-321)
207 517 200 0.3
Fuel rod
(Zircaloy-4)
240 415 200 0.42
Fig. 3. Element plot of FE model.
Fig. 4. Applied boundary conditions (element plot 3D).
W.G. Murtaza et al.: EPJ Nuclear Sci. Technol. 2, 18 (2016) 3
assembly skeleton (i.e., before insertion of fuel rods in the
test specimen) and after pasting all gauges fuel rods are
inserted in the prototype fuel assembly test specimen.
Mainly, two critical measuring points or levels on the test
specimen, determined through FE analysis, have been
considered in the present study. The strain gauges, pasted
on the upper and lower end positions of the guide thimbles,
i.e. near to top and bottom nozzles of the fuel assembly,
have been used to measure the local stress concentration at
the root of the guide thimbles. The detailed methodology
and arrangement of the strain gauges is illustrated in
Figure 5.
4 Discussion of FE and test results
Mesh density is the most important parameter affecting
both accuracy and convergence behavior. Therefore, a
sensitivity analysis has been performed to set a mesh
renement level at which converged and more accurate
results are obtained.
Stress intensity is the difference between the algebraically
largest and smallest principal stresses at a given point [7].
It is a representative of both stresses primary membrane
(Pm) and bending (Pb) [8]. The max. nodal stress
intensity at the fuel assembly, 941.9 MPa, under applied
load of 9800 N or 2 g, is located at the middle of top
surface of the lower arc of spring, as shown in Figure 6.
The value of stress intensity is less than the design
stress limit, which is equal to the yield strength [7] of the
grid material, 1034 MPa [9].
The max. nodal stress intensity at the guide thimbles,
75.7 MPa, under applied max. load of 2 g, is located at the
outer surface of guide thimble near the top nozzle, as
shown in Figure 7.
The value of stress intensity is also less than the design
stress limit of the guide thimble material, 207 MPa [10].
Fig. 5. Strain gauge locations.
Fig. 6. Plot of nodal stress intensity of fuel assembly.
Fig. 7. Plot of nodal stress intensity of guide thimbles.
4 W.G. Murtaza et al.: EPJ Nuclear Sci. Technol. 2, 18 (2016)
The axial tensile stresses obtained through strain gauges
(Nos. 14), under tensile load of 9800 N or 2 g (fuel
assembly handling load), applied with a load step of
1960 N, are compared with the FE results at the same
loads and locations, as illustrated in Figures 811.
As seen from Figures 811, it can be observed that the
stress in fuel assembly in axial direction, obtained from
both studies, increases approximately linear with the
increase in load as well as the results of the both studies
(FE and test) are also comparable.
The percentage errors between the analytical and test
results are calculated at max. applied tensile load of
9800 N or 2 g, as shown in Table 3.
From Table 3, the calculated error between the FE
analysis and Test results on gauge Nos. 1 and 3 lies within
the error band of ±9% and that on gauge Nos. 2 and 4 lies
within the error band of ±18%. The percentage of error
may be minimized by increasing the mesh density at the
cost of computational time.
The max. elongation of fuel assembly obtained from both
studies, FE and test under applied max. axial tensile load
(9800 N) are 0.38 mm and 0.36 mm, respectively. The
calculated error between the FE analysis and test results
of fuel assembly elongation at max. tensile load lies within
the error band of ±5%. The elongation behaviours,
obtained from both studies, are plotted in Figure 12.
From Figure 12 it can be seen that the elongation in fuel
assembly in axial direction, obtained from both studies,
increases approximately linearly with the increase in load.
which means that fuel assembly may not permanently
elongate till application of the max. load of 9800 N.
Therefore, the stresses (on the majority of gauges) and
deformation obtained through test are comparable with
the FE results which validate the FE methodology.
Fig. 8. Test & FE analysis results at gauge-1 location.
Fig. 9. Test & FE analysis results at gauge-2 location.
Fig. 10. Test & FE analysis results at gauge-3 location.
Fig. 11. Test & FE analysis results at gauge-4 location.
Table 3. Comparison of FE analysis and test results at a
load of 9800 N (2 g).
Gauge No. Stress (MPa) % Error
(Test & FE analysis)
FE analysis Test
1 61.6 67.1 8
2 56 67.1 17
3 44.2 40.7 9
4 46.5 57.0 18
% Error: [(experimental FE analysis)/experimental] 100.
W.G. Murtaza et al.: EPJ Nuclear Sci. Technol. 2, 18 (2016) 5