
http://www.iaeme.com/IJMET/index.asp 1850 editor@iaeme.com
International Journal of Mechanical Engineering and Technology (IJMET)
Volume 10, Issue 03, March 2019, pp. 1850-1859. Article ID: IJMET_10_03_187
Available online at http://www.iaeme.com/ijmet/issues.asp?JType=IJMET&VType=10&IType=3
ISSN Print: 0976-6340 and ISSN Online: 0976-6359
© IAEME Publication Scopus Indexed
CLASSIFICATION OF PADDY GROWTH AGE DETECTION
THROUGH AERIAL PHOTOGRAPH DRONE DEVICES
USING SUPPORT VECTOR MACHINE AND HISTOGRAM
METHODS, CASE STUDY OF MERAUKE REGENCY
Marsujitullah, Fransiskus X. Manggau and Rachmat
Informatics Engineering, Universitas Musamus, Merauke, Indonesia
ABSTRACT
Farming is one of the spearheads of national development which has an important
role, especially Merauke Regency which is planned as an area of national food self-
sufficiency in the field of agribusiness. Agriculture in Indonesia has a lot of food land
that is widely spread and various types of paddy fields from several types of food
management especially in agriculture, however there is no system that visualizes the
progress of food crop growth in particular areas by looking at the condition of the land
in an approach visual. The estimated age of paddy growth is aimed at managing and
monitoring paddy plants as information needs in assisting the government, especially
in monitoring the area planted by utilizing image images taken through aerial
photographs using Drone devices. In this paper we present an approach to estimate the
age of paddy in drone images using the Support Vector Machines - SVM and Histogram
method. SVM is a learning machine method that works on the principle of Structural
Risk Minimization (SRM) with the aim of finding the best hyperplane that separates two
classes in input space. Input data are images from drone devices to support vector
machines in their ability to find the best hyperplane that separates two classes in the
feature space supported by the SRM strategy. Histograms in graphical form that
describe the spread of pixel intensity values of an image. With this research, it can be
known the age of paddy plants through the histogram value taken on the image by the
drone device, so that the growth phase parameters from one week to the harvest can be
known with 89 percent accuracy.
Keywords: Support Vector Machines, Histogram, Image classification, Structural
Risk Minimization
Cite this Article Marsujitullah, Fransiskus X. Manggau and Rachmat, Classification of
Paddy Growth Age Detection Through Aerial Photograph Drone Devices Using
Support Vector Machine and Histogram Methods, Case Study of Merauke Regency,
International Journal of Mechanical Engineering and Technology, 10(3), 2019, pp.
1850-1859.
http://www.iaeme.com/IJMET/issues.asp?JType=IJMET&VType=10&IType=3

Students’ Perceptions towards the Grammar Teaching at English Literature Department of
Musamus University
http://www.iaeme.com/IJMET/index.asp 1851 editor@iaeme.com
1. INTRODUCTION
The purpose of remote sensing is to analyze or measure the physical number of drivers without
direct physical contact, the benefits obtained in using remote sensing, especially in using a
drone device, are observed in a large area, in terms of financing more affordable compared to
land surveys .
In its use, drone devices can be used anywhere on agricultural land, considering that
Indonesia is not only well-known as an archipelagic country, it is also known by the world
community as an agricultural country, where most of its land area is still used for agricultural
and plantation purposes. As a country that has been involved in agriculture and plantations for
a long time, of course it has often faced various inhibiting factors which can reduce the level of
agricultural productivity. Various steps are taken to map agricultural productivity, from simple
methods to the use of advanced technologies that exist today. One of the main applications for
remote sensing is for agricultural monitoring or management. For example, long distance
sensing techniques are used to calculate the number of oil palm trees [1]. In [2], satellite imagery
is used to estimate the biomass of secondary forest above land in Brazil. By using remote
sensing, monitoring large quantities of agriculture is possible and cost effective. In [3],
multispectral satellite imagery, FORMOSAT-2, is used to map cultivation areas and monitor
crop status on a regional scale. Furthermore far sensing can also be used to detect plantation
areas [4] and crop yields prediction [5]. By way of implanting sensors in agricultural areas as
in research [6,7] then processing the sensing data from different places. For each data retrieval
method there are advantages and disadvantages. In taking data directly in the field, a lot of time
will be wasted because each farm must be visited one by one to get the expected data. However,
this will be very different if you use the remote sensing method, where the desired data can be
obtained on such a wide scale and in a relatively short time. What is an obstacle in remote
sensing is that the earth's atmosphere is not always clean of clouds. Though clouds or other
objects in the atmosphere can interfere with or make satellites unable to record events that occur
on the surface of the earth.
In the data collection method that utilizes sensors planted in each agricultural area the results
can be far better when compared to the first and second data collection methods because the
tools have been installed on the site so that the accuracy of the reading can be better and do not
need to check the farm area one by one so you can save time collecting data. However,
unfortunately, the third method requires a considerable investment cost because sensors must
be installed in each agricultural area so that in this study, the authors only used the first and
second methods. The first method, which is collecting data directly in the field, will be used to
cover up the weaknesses of the second method, which is collecting data using remote control,
when the earth's atmosphere is covered with clouds so that remote sensing is not possible.
In the use of satellite imagery the weaknesses are almost the same as the weaknesses found
in the remote sensing method in general, which is very dependent on weather such as rain,
clouds and fog caused by the operation of space where shooting still cannot penetrate the clouds.
In addition, the maximum spatial resolution that can only reach 15 meters makes it unable to
properly detect the types of plants on agricultural land with such a small planting area.
The method we do has the same method of retrieving data as the method of taking pictures
remotely, that is by using imagery. The image used in this method comes from drones with the
height of the rules of flight drones in Indonesia, which is a maximum of 150 meters. From this
height one image data can cover ± 3 Ha.

Classification of Paddy Growth Age Detection Through Aerial Photograph Drone Devices Using
Support Vector Machine and Histogram Methods, Case Study of Merauke Regency
http://www.iaeme.com/IJMET/index.asp 1852 editor@iaeme.com
2. DEVELOPMENT OF PADDY AGE GROWTH
There are a number of developments in the growth that paddy plants go through from the
beginning of planting to entering the harvest period with varying spectral signature
characteristics when viewed using Landsat TM satellite imagery among them.
1) The initial development of growing paddy, where paddy fields are dominated by water
due to flooding. In Landsat TM images with the true color composite (TCC) color composition,
the paddy fields will appear blue.
2) The development of the second stage of vegetative growth, marked by the thickening of
the leaves of paddy plants that cover all paddy fields. At this stage, land cover is dominated by
green. This green color will appear green in the image.
3) Development of the third stage of generative growth, in which paddy fields which were
originally dominated by green leaves will be replaced with paddy pale yellow in color on TCC.
4) Development of stage four where land becomes paddy for a certain period of time. In
this condition the wetland will appear reddish brown in the TCC color composition.
The development of paddy crops during harvest can be estimated using Landsat satellite
images if referring to the average age of paddy ranging from 110-120 days. This can be done
by first monitoring the start of planting, which is a change from the fallow phase (land
preparation stage) to the water phase (tillage / flooding) or by monitoring changes in the stage
of paddy from the water stage to the vegetative stage.
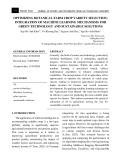
Figure 1. Development of age for paddy growth. (a). initial stage of growth, (b). Vegetative growth
stage, (c). Generative growth stage, (d). Ready for harvest.
3. HISTOGRAM AND SVM DEVELOPMENT OF PADDY GROWTH
3.1. Histogram
The use of digital images is increasing because of the advantages possessed by digital images,
including the ease of getting pictures, reproducing images, processing images and others. But
not all digital images have a visual display that satisfies the human eye. Dissatisfaction can
arise due to noise, the lighting quality in digital images that are too dark or too bright. So that a
method is needed to improve the quality of the digital image. To improve image quality in terms
of color contrast, we can give treatment to the histogram. The treatment referred to in this article
is an equalization histogram on grayscale images. Image histogram is said to be good if it is
able to involve all possible levels or levels at the gray level. Of course the aim is to be able to
display details on the image so that it is easy to observe [8].

Students’ Perceptions towards the Grammar Teaching at English Literature Department of
Musamus University
http://www.iaeme.com/IJMET/index.asp 1853 editor@iaeme.com
Many histograms are applied in some cases. In the study [9] histograms were used to
identify age through the face. The histogram technique is also used in [10] for health. To
determine the growth phase needs of rice plants, leaf color is the easiest indicator. Giving the
amount and at the right time can provide an increase in the efficiency of the actual absorption
of the plants, so that the yield is as expected. The use of leaf color chart by equating the color
of rice leaves with a color scale composed of green series, ranging from yellowish green to dark
green accompanied by very important parameters to facilitate the classification of the rice.
Leaf Color Chart (LCC) is a leaf color level standard issued by the International Paddy
Research Institute (IRRI). LCC is usually used to determine the nitrogen content of a plant so
that later it can be known when the fertilization and harvest time is right.
The use of cameras on drone drones in leaf shooting will help farmers to determine the color
level of plants automatically, in this case helping the government in obtaining agricultural
information based on the LCC. In addition, farmers usually use the LCC manually by
comparing the color of the plant leaves with each color level found on the LCC. Determination
of LCC level can be done automatically by utilizing the image so that farmers are expected to
know the information on the image of the leaf located at what level in the leaf color chart.
3.2. Support Vector Machine - SVM
Support Vector Machine (SVM) was first proposed for classification problems. SVM is used
to analyze voltage [11]. In [12] also SVM is used for spectral-spatial. This is a learning
technique for supervised non-parametric statistics. Therefore, the main advantage is that data
distribution does not need to be known in priority, whereas other statistical techniques, for
example, maximum likelihood estimates usually assume that data distribution is known as a
priority [13-18].
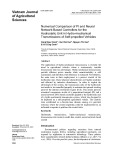
To explain the concept of supporting vector machines, a classifcation problem of two linear
classes is used, see Figure 2. The purpose of vector support machine techniques is to find a
hyperplane separating data into many classes, which are two classes in this case. A hyperplane
like this is called a decision boundar or an SVM hyperplane. To get a unique hyplane or optimal
separation, an obstacle is that there is no data point in the hyperplane margin. Data points on
the margin are called vector support. In other words, supporting vectors are used to defect the
maximum margin hyperplane.
If data is not distributed linearly, using a hyperplane cannot separate data into many classes
efficiently. To handle the distribution of non-linear data, data is projected into higher
dimensional spaces so that data points are distributed linearly in new spaces. By using the right
projection function, products in higher dimensional space can be calculated in the original space
without mapping data points into feature spaces that may have infinite dimensions through the
use of the kerel function.
Figure. 2. Illustration of supporting vector machine concepts.

Classification of Paddy Growth Age Detection Through Aerial Photograph Drone Devices Using
Support Vector Machine and Histogram Methods, Case Study of Merauke Regency
http://www.iaeme.com/IJMET/index.asp 1854 editor@iaeme.com
3.3. Method”oneagainstall”
Using this method, a binary SVM model is constructed (k is the number of classes). Each i
classification model is trained by using all data, to find solutions to problems. For example,
there are classification problems with 4 classes. For training, 4 binary SVM are used as in table
1.
𝑚𝑖𝑛
𝑤𝑖,𝑏𝑖,𝜉𝑗 1
2 (𝑤𝑖)𝑇 𝑤𝑖+ 𝐶 ∑𝜉𝑡
𝑖
𝑡 (1)
𝑠. 𝑡 (𝑤𝑖)𝑇 ∅ (𝑥𝑡)+ 𝑏𝑖 ≥ 1 − 𝜉𝑡
𝑖 → 𝑦𝑡= 𝑖, (2)
(𝑤𝑖)𝑇 ∅ (𝑥𝑡)+ 𝑏𝑖 ≥ 1 − 𝜉𝑡
𝑖 → 𝑦𝑡≠ 𝑖, (3)
𝜉𝑡
𝑖 ≥ 0 (4)
4. CASE STUDY AND RESULTS
As mentioned earlier, the purpose of this study was to detect the growth phase of rice by
dividing the rice group from 0 weeks to post-harvest. So that the information needs of an area
can be seen from the image taking of rice by a drone device which then calculates the histogram
value and determines the age group of rice using Support Vector Machine - SVM, with accurate
calculations carried out histogram of each image, helps SVM in determining the age
classification of rice, so that the government can control the condition of an area's rice fields
easily. The monitored variable refers to several RGB color variables from the image of rice
from each image capture using a Drone device.
Some measurements of the accuracy of the data obtained do not produce 100% results,
considering the color variables of each image are influenced by sunlight and the height of
shooting using a Drone device, but the accuracy obtained is 89.00%.
The following is the process in the design of the running system that is made using training
data for rice ages 3 to 4 months, and 3-4 months test data, and predicts other test data with
system errors using test data for rice ages 0-3 weeks.
Figure 3. Data Training Load Data Retrieval of image data to be stored

![Giáo trình Công nghệ sản xuất rau thủy canh (Nghề: Bảo vệ thực vật - CĐ) - Trường Cao đẳng Đà Lạt [Mới nhất]](https://cdn.tailieu.vn/images/document/thumbnail/2026/20260224/hoacattuong2026/135x160/46501772096418.jpg)


![Giáo trình Kỹ thuật nhà kính, nhà lưới (Nghề Kỹ thuật rau, hoa công nghệ cao - CĐ) - Trường Cao đẳng Đà Lạt [Mới nhất]](https://cdn.tailieu.vn/images/document/thumbnail/2026/20260224/hoacattuong2026/135x160/22391772099037.jpg)

![Giáo trình Sản xuất nông nghiệp VietGAP (Nghề Bảo vệ thực vật - CĐ) - Trường Cao đẳng Đà Lạt [Mới nhất]](https://cdn.tailieu.vn/images/document/thumbnail/2026/20260224/hoacattuong2026/135x160/66591772099045.jpg)


