ISSN 1859-1531 - THE UNIVERSITY OF DANANG - JOURNAL OF SCIENCE AND TECHNOLOGY, VOL. 22, NO. 11B, 2024
15
ANALYSIS OF THE DYNAMIC IMPACT FACTOR OF SONG PHAN BRIDGE UNDER RANDOM LOADS COLLECTED FROM THE DAU GIAY WEIGHING STATION AND ROAD MANAGEMENT AREA IV
Xuan Toan Nguyen, Cong Thuat Dang, Thi Kim Loan Nguyen* The University of Danang - University of Science and Technology, Vietnam
*Corresponding author: ntkloan@dut.udn.vn (Received: September 26, 2024; Revised: October 11, 2024; Accepted: October 12, 2024) DOI: 10.31130/ud-jst.2024.511E
the random variables
Abstract - This paper investigates the Dynamic Impact Factor (DIF) of vertical displacement in a three-span girder bridge with a continuous thermal deck subjected to random vehicle loads. Actual vehicle load data collected from the Dau Giay weighing station and Road Management Area IV were utilized in the analysis. The study employed the non-parametric density estimation method to generate random data sets based on the probability density function of the collected vehicle loads. A total of 10000 simulations were conducted, applying the analysis to the Song Phan Bridge on the Phan Thiet - Dau Giay highway in Vietnam. The research findings indicate that the probability distribution of is highly complex. Furthermore, the Dynamic Impact Factor corresponding to the overload loads from Road Management Area IV tends to increase and exceeds the dynamic coefficients currently utilized in bridge design standards, according to AASHTO and TCVN 11823- 13:2017.
Key words – Dynamic impact factor (DIF); random vehicle loads; Song Phan bridge; Dau Giay weighing station; Road Management Area IV.
1. Introduction
load
load
is a
stress) of the beam response due to a load moving at a random velocity. Lu et al. [4] proposed an efficient algorithm for non- stationary stochastic vibration of a bridge-vehicle system. The pseudo-excitation method (PEM) was extended to handle the stochastic analysis of time-dependent bridge-vehicle systems, in which the statistical characteristics of the dynamic responses are calculated. Yin et al. [5] considered the non- stationary random vibration of the bridge when the vehicle speed changes. The mathematical model was established based on the finite element model, in which the Gaussian random process was presented by the Karhunen-Loève expansion, and the equations were solved by the Newmark-β method. Chang [6] applied the finite element method to perform a statistical kinematic analysis of the bridge-vehicle interaction with randomness in material properties and moving loads. Sorrentino [7] studied the analysis on a simple beam loaded by a series of concentrated forces moving in the same direction, with random occurrence, continuous random speed, and constant random amplitude. Camara et al. [8] modeled the bridge-vehicle interaction applicable to medium to long-span bridges subjected to random traffic loading. Montenegro et al. [9] described a method for evaluating the dynamic impact factor in bridges based on irregular configurations determined by probability distributions. Shao et al. [10] presented a numerical simulation method for vehicle-bridge interaction for long-span suspension bridges under random traffic loading in the linear range. The above studies have mentioned models that are closer to reality and have begun to consider random factors such as speed, position, distance of vehicles, excitation force, roughness of the bridge surface, and vehicle load according to the standard distribution law. However, the research results on the vibration of bridge structures under the influence of mobile vehicles with randomly changing loads are still very limited.
In general, this coefficient represents the relationship between the total response observed in a structure under dynamic loading and its corresponding static component. The importance of dynamic bridge loading was recognized as early as the 1930s when the British Standard Loading Code introduced a DIF of 1.5 [11]. Around the same period, the American Association of State Highway and Transportation Officials (AASHTO) [12] issued the Standard Specifications for Highway Bridges, establishing the first correlation between bridge length and the DIF. Initially, the DIF was limited to 1.25, which was later increased to 1.3 in 1989 (AASHTO) [13]. A review of the
The dynamic response of a bridge is most commonly influenced by its span, natural frequencies, and road surface irregularities. However, several other factors related to traffic characteristics, such as vehicle speed, axle load, vehicle configuration, and dynamic characteristics, as well as bridge- specific characteristics, including bridge type, condition of major structural components, expansion joints, supports, and its damping behavior in response to loads also play an important role [1]. In reality, many effects of excitation forces on bridge structures are random, such as wind load, rain load, moving vehicle load, earthquake, etc. In which moving vehicle that acts directly, regularly, continuously, and always changes in space and time. Analyzing bridge vibrations on the interaction model between bridge and vehicle from a random perspective has been of interest to scientists in the world and in the country very early. Some researchers have solved different aspects of the problem by using a random approach of bridges under moving vehicle loads according to various computational models. Zibdeh [2] dealt with the stochastic vibration of a simple elastic beam subjected to a random load moving at a velocity varying with time. The problem was formulated based on the Euler- Bernoulli beam theory and applied a stochastic method, generating partial differential equations to describe the behavior of the system. S´niady et al. [3] presented an approach to obtain the probabilistic characteristics (deflection,
16
Xuan Toan Nguyen, Cong Thuat Dang, Thi Kim Loan Nguyen
various factors influencing highway bridges constructed by different countries can be found in GangaRao [14]. Several studies have demonstrated that the DIF calculated using mathematical models for different bridge responses varies, and some suggest that the DIF obtained from different bridge responses should be treated separately ([15-17]). Deng et al. [18] performed an extensive literature review on the use of the DIF in multiple countries. The results correspond to the bridge codes of each country, resulting in differences in DIF calculations.
vehicle load, that is, the load exceeds the allowable limit. The density estimation methods were used to estimate the probability density function (PDF) of a variable from experimental data. To perform the steps of estimating the PDF of a variable from experimental data, many empirical methods can be used. In this section, the Kernel density estimation method is used. This method involves using a kernel function to smooth the observed data points, creating a continuous approximation of the PDF. This is an efficient way to provide a clear and continuous estimate of the density function from discrete data points. Estimating the PDF, using Kernel density function estimation (KDE) is a powerful approach to estimate the PDF from a real data sample, which helps to visualize the distribution of the data without making specific assumptions about the shape of the prior distribution [19].
The block diagram to simulate experimental data using the Monte Carlo method based on the collected data from weighing stations is as follows:
Figure 1. The block diagram for generating random data set
2.2. Dau Giay weighing station
Recently, developed countries have applied many advanced bridge construction technologies and materials to respond to random fluctuations in vehicle loads. These systems provide real-time data on the load as well as the state of the bridge, helping engineers detect problems early and promptly adjust treatment methods to the structure. In recent years, Vietnam's infrastructure has been invested in construction and developed rapidly. The impact of vehicle loads, especially overloaded vehicles, on the vibration and safety of bridge structures is of interest to many scientists. In fact, the load of vehicles passing over the bridge varies greatly and depends a lot on the type and volume of goods loaded on the vehicle, so this quantity is random. The collection of actual data on the load and vibration of bridges is still limited, especially in developing countries like Vietnam. Currently, most studies rely on simulation data or data from atypical conditions, which do not reflect the actual traffic and load conditions in Vietnam. The lack of real data on the impacts of overloaded vehicles on bridges reduces the ability to verify and calibrate analytical models. In addition, there are very few specific studies on random loads in real conditions in Vietnam, where overloaded vehicles often occur. This study collects real vehicle load data from the Dau Giay weighing station and Road Management Area IV, and applies it to the DIF analysis of a three-span girder bridge with a thermally continuous slab, the Song Phan bridge. At the same time, compare the results obtained when using two different sets of vehicle load data to predict the danger zone during the operation of the bridge structure subject to different mobile vehicle loads.
Figure 2 presents the frequency histogram of vehicle load occurrences and the probability density function derived from the data processing collected at the Dau Giay weighing station according to Nguyen Lan [20]. Random samples from the dataset of m1n values representing the load of the third axle are illustrated in Figure 3.
2. Collect and process actual load data of Dau Giay weighing station and Road Management Area IV 2.1. Collect and enrich vehicle loads algorithm
Figure 2. The frequency distribution chart and PDF
Figure 3. The randomness of the vehicle
Weigh-in-motion (WIM) systems are widely used globally, from developed to developing countries. This is a system designed to measure the weight of vehicles moving on the road using sensors placed on the road surface. The sensors are designed to measure the impact force of vehicles moving on the road and convert it into weight data corresponding to those vehicles. The data collected from the WIM system can be used to calculate the average weight and maximum load of vehicles moving on the road, helping road managers assess the durability of the road and manage road loads more effectively. In this study, the WIM database was taken from the Dau Giay weighing station - Dong Nai province and Road Management Area IV. The actual load obtained from the Dau Giay weighing station is the operating load with some cases of overload. The load collected at Road Management Area IV is understood as the overloaded
ISSN 1859-1531 - THE UNIVERSITY OF DANANG - JOURNAL OF SCIENCE AND TECHNOLOGY, VOL. 22, NO. 11B, 2024
17
2.3. Road Management Area IV
nth axle, modeled as a harmonic function, is expressed by Gn.sinψn. The suspension system at the nth axle is characterized by a spring constant k1n and a damping coefficient d1n, while the tire system is represented by the spring constant k2n and the damping coefficient d2n. Here, L is the length of the girder element and xn is the coordinate of the nth axle of the vehicle at time for n= 1, 2, 3.
Road Management Area IV (RMA) is one of the road management agencies in Vietnam and is responsible for ensuring traffic safety on the country's key routes. Through the above algorithm, a random dataset of 10000 times the value of the third axle load from 2018 to 2021 was generated and shown in Figure 4. By using this random dataset, conducting simulations, and statistical analysis, the results of the random representations of the third axle load are shown in Figure 5.
= 𝑝(𝑥, 𝑧, 𝑡) (1) ) + 𝜌𝐹𝑑. 𝐸𝐽𝑑. (
As outlined in [21], the differential equations governing the behavior of a girder element under a distributed load p(x,z,t), while accounting for both internal and external friction effects, are expressed as follows: 𝜕5𝑤 𝜕𝑥4. 𝜕𝑡
𝜕2𝑤 𝜕𝑡2 + 𝛽. 𝜕4𝑤 𝜕𝑥4 + 𝜃. 𝜕𝑤 𝜕𝑡
Figure 4. The input load data of RMA IV
In this context, EJd represents the bending stiffness of the girder element, while Fd denotes the mass per unit length of the girder. The coefficients 𝜃 and 𝛽 account for the internal and external friction of the girder element, respectively. The term p(x,z,t) refers to the uniform load applied horizontally across the girder element.
By applying d’Alembert’s principle, the dynamic equilibrium of each mas m1n, m2n along the vertical axis can be expressed as follows:
𝑚1𝑛. 𝑧̈1𝑛 + 𝑑1𝑛. 𝑧̇1𝑛 + 𝑘1𝑛. 𝑧1𝑛 − 𝑑1𝑛. 𝑧̇2𝑛 − 𝑘1𝑛. 𝑧2𝑛 Figure 5. The randomness of the vehicle
(2)
= 𝐺𝑛. 𝑠𝑖𝑛 𝛹𝑛 − 𝑚1𝑛. 𝑔
3. Vehicle–bridge coupled system
The structure of the reinforced concrete I-girder bridge, comprising three spans and featuring a link slab, is subjected to vehicle loads, as illustrated in Figure 6.
= 𝑝(𝑥, 𝑧, 𝑡) ) + 𝜌𝐹𝑑. 𝐸𝐽𝑑. ( 𝑚2𝑛. 𝑧̈2𝑛 + (𝑑1𝑛 + 𝑑2𝑛). 𝑧̇2𝑛 + (𝑘1𝑛 + 𝑘2𝑛). 𝑧2𝑛 − 𝑑1𝑛. 𝑧̇1𝑛 − 𝑘1𝑛. 𝑧1𝑛 = −𝑚2𝑛. 𝑔 + 𝑑2𝑛𝑤̇ 𝑛 + 𝑘2𝑛𝑤𝑛 By combining Eq. (1) and Eq. (2), the differential equations governing the behavior of the girder element under the distributed load p(x,z,t) can be reformulated as follows: 𝜕4𝑤 𝜕𝑥4 + 𝜃. 𝜕2𝑤 𝜕𝑡2 + 𝛽. 𝜕5𝑤 𝜕𝑥4. 𝜕𝑡 𝜕𝑤 𝜕𝑡
𝑝(𝑥, 𝑧, 𝑡) 𝑁
(3)
𝑖=1
= ∑ 𝜉𝑖(𝑡) [ ] 𝛿(𝑥 − 𝑎𝑛)
𝐺𝑛 𝑠𝑖𝑛 𝛹𝑛 − (𝑚1𝑛 + 𝑚2𝑛). 𝑔 −𝑚1𝑛. 𝑧̈1𝑛 − 𝑚2𝑛. 𝑧̈2𝑛 𝑚1𝑛. 𝑧̈1𝑛 + 𝑑1𝑛. 𝑧̇1𝑛 + 𝑘1𝑛. 𝑧1𝑛 − 𝑑1𝑛. 𝑧̇2𝑛 − 𝑘1𝑛. 𝑧2𝑛 Figure 6. Schematic of a three-axle vehicle moving on the bridge Vehicle load is modeled as a three-axle system. Let m1n represent the mass of the vehicle, including the goods transported to the nth axle, and m2n denote the mass of the nth axle. The dynamic interaction model between a three- axle vehicle and a girder element is shown in Figure 7.
= 𝐺𝑛. 𝑠𝑖𝑛 𝛹𝑛 − 𝑚1𝑛. 𝑔 𝑚2𝑛. 𝑧̈2𝑛 + (𝑑1𝑛 + 𝑑2𝑛). 𝑧̇2𝑛 + (𝑘1𝑛 + 𝑘2𝑛). 𝑧2𝑛 − 𝑑1𝑛. 𝑧̇1𝑛 −𝑘1𝑛. 𝑧1𝑛 = −𝑚2𝑛. 𝑔 + 𝑑2𝑛𝑤̇ 𝑛 + 𝑘2𝑛𝑤𝑛 where
is the Dirac delta function, n=1 to N (N is
number of axles, N=3).
𝑀𝑒. 𝑞̈ + 𝐶𝑒. 𝑞̇ + 𝐾𝑒. 𝑞 = 𝑓𝑒
Figure 7. Vehicle–bridge dynamics interaction model
In
represents
this model, wn(xn,t)
The Galerkin method and Green's theorem are applied to Eqs. (3) to transform the system into matrix form, enabling the differential equations governing both the girder element and the vehicle to be expressed as follows: (4) In this formulation, Me, Ce and Ke represent the mass matrix, damping matrix, and stiffness matrix of the system, which includes both the girder and the vehicle, respectively:
0 0 𝐶𝑤𝑤 0 ] ] ; 𝐶𝑒 = [ 𝑀𝑒 = [ 𝐶𝑧1𝑧1 𝐶𝑧1𝑧2 𝐶𝑧2𝑤 𝐶𝑧2𝑧1 𝐶𝑧2𝑧2 𝑀𝑤𝑤 𝑀𝑤𝑧1 𝑀𝑤𝑧2 𝑀𝑧1𝑧1 0 0 0 𝑀𝑧2𝑧2 0 0 0 𝐾𝑤𝑤 0 (5) ] 𝐾𝑒 = [ 𝐾𝑧1𝑧1 𝐾𝑧1𝑧2 𝐾𝑧2𝑤 𝐾𝑧2𝑧1 𝐾𝑧2𝑧2
the vertical displacement of the girder element at the nth axle of the vehicle, while z1n is the vertical displacement of the chassis at the nth axle and z2n denotes the vertical displacement of the nth axle itself. The term y1n refers to the relative displacement between the chassis and the nth axle, whereas y2n indicates the relative displacement between the nth axle and the girder element. The engine excitation force at the
18
Xuan Toan Nguyen, Cong Thuat Dang, Thi Kim Loan Nguyen
element method, as illustrated in Figure 9.
In this system, the following vectors represent the dynamic response of the combined girder and vehicle system: 𝑞 ̈ is the complex acceleration vector, 𝑞̇ is complex velocity vector, 𝑞 is complex displacement vector, 𝑓𝑒 is complex forces vector of the system including girder and vehicle;
Figure 9. Diagram of a discrete bridge structure
{𝑞̈ } = { } ; {𝑞̇} = { } ; {𝑞} = { } ; } (6) {𝑓𝑒} = { 𝑊 𝑍1 𝑍2 𝐹𝑤 𝐹𝑧1 𝐹𝑧2 𝑊̈ 𝑍̈1 𝑍̈2 𝑊̇ 𝑍̇1 𝑍̇2
The vehicle parameters, represented by the values m11, m12 and m13 are random quantities. The remaining data are based on typical vehicles in the region, specifically modeled after a Foton truck with three axles. The parameters for the dumper truck used in the vibration analysis are provided in Table 1.
Table 1. The typical properties of a Foton vehicle Value
𝑊 = [𝑢1 𝜙1 𝑢2 𝜙2]𝑇is the node displacement vector of the beam element in the local coordinate system. The components of this vector are as follows: u1, 1 are the vertical displacement and rotation displacement at the left node; u2, 2 are the vertical displacement and rotation displacement at the right node of the beam element. Symbol m21 m22,m23
k1n
k2n
d1n
In this formulation, Mww represents the mass matrix, Cww denotes the resistance (or damping) matrix, and Kww is the stiffness matrix. These matrices correspond to the basic beam element subjected to both axial and bending forces. The remaining matrices and vectors involved in the system can be found in [22].
d2n Unit T T T/m T/m T/m T/m Ts/m Ts/m Ts/m Ts/m 0.26 0.87 120 260 240 380 0.7344 0.3672 0.4 0.8
(7)
𝑁 𝑖=1
𝐹𝑤 = ∑ [𝐺𝑛 𝑠𝑖𝑛 𝛹𝑛 − (𝑚1𝑛 + 𝑚2𝑛). 𝑔]. 𝑃𝑛
4.2. Dau Giay weighing station
(8)
; 𝐹𝑧2 = 𝐹𝑧1 =
After performing the analysis of the random input data set with a sample size of N=10000, the obtained results of the DIF vertical displacement at the nodes corresponding to the ¼ and ½ positions between the spans are shown in Figures 10 - 13.
{ −𝑚21. 𝑔 ⋮ −𝑚2𝑛. 𝑔 ⋮ −𝑚2𝑁. 𝑔} { 𝐺1 𝑠𝑖𝑛 𝛹1 − 𝑚11. 𝑔 ⋮ 𝐺𝑛 𝑠𝑖𝑛 𝛹𝑛 − 𝑚1𝑛. 𝑔 ⋮ 𝐺𝑁 𝑠𝑖𝑛 𝛹𝑁 − 𝑚1𝑁. 𝑔}
This study focuses on the scenario where the applied load is a random variable derived from vehicle weighing station data. Consequently, the quantity m1n = maxle n - m2n in the Eq (2), (3), (7), and (8) is treated as a random variable, while all other factors are considered deterministic.
4. Result analysis vibration of Song Phan bridge 4.1. Analytical bridge and vehicle model
Figure 10. Probability distribution of DIF at node 2
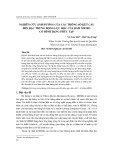
The Song Phan Bridge is a three-span I-girder structure featuring a link slab, with each span measuring 24 meters in length. The deck slab is constructed from continuously reinforced concrete and includes a 1.2-meter-long flexible joint. The bridge's cross-section comprises 11 prestressed reinforced concrete I-girders, as illustrated in Figure 8.
Figure 8. Cross section of Song Phan bridge Figure 11. Probability distribution of DIF at node 3
The properties of the slab beam are obtained from the
design documents of the bridge management unit.
The concrete properties of the slab beam are as follows: Length L=24 m, Young’s modulus of elasticity E=3230769.23 T/m2, density =2.5 T/m3, friction coefficient =0.027 and =0.01, the cross sectional area A=0.9522 m2, second moment of area I=0.30921 m4. The Link slab (deck): height h=0.02m, the cross sectional area A=0.47 m2, and second moment of area I=0.001567m4.
The bridge structure was discretized using the finite
Figure 12. Probability distribution of DIF at node 7
ISSN 1859-1531 - THE UNIVERSITY OF DANANG - JOURNAL OF SCIENCE AND TECHNOLOGY, VOL. 22, NO. 11B, 2024
19
Figure 17. Probability distribution of DIF at node 8 Figure 13. Probability distribution of DIF at node 8 Table 3. Statistical of DIF at RMA IV
The statistical data regarding the DIF of vertical
displacements at the nodes are presented in Table 2.
Table 2. Statistical of DIF at Dau Giay
Statistical Mean Max Min Standard deviation Node 2 Node 3 Node 7 Node 8 1.692 1.936 1.448 0.145 1.317 1.310 1.560 0.817 1.074 0.821 0.145 0.817 1.625 1.546 1.216 0.079
Statistical Mean Max Min Standard deviation Node 2 Node 3 Node 7 Node 8 1.466 1.562 1.370 0.135 1.272 1.328 1.216 0.079 1.461 1.546 1.216 0.079 1.274 1.318 1.229 0.063
4.3. Road Management Area IV
4.4. Compare the results in two corresponding load cases After analyzing the random input data set and applying it to a three-span girder bridge with a link slab, the results of the vertical displacement analysis were obtained for the loads collected from the Dau Giay weighing station and Road Management Area IV at the nodes.
Table 4. Statistical results of DIF in two cases
The DIF results of vertical displacement at the nodes corresponding to the ¼ and ½ span positions when the bridge is subjected to the load at Road Management Area IV are shown in Figures 14-17.
The statistical data concerning the DIF of vertical
displacement at the nodes are presented in Table 3.
Mean value RMA DG Disparity (%) Node 2 1.692 1.466 13.36 Node 3 1.625 1.461 10.09 Node 7 1.317 1.274 3.26 Node 8 1.310 1.272 2.90
Figure 14. Probability distribution of DIF at node 2
Figure 18. Probability distribution of DIF at node 2
Figure 15. Probability distribution of DIF at node 3 Figure 19. Probability distribution of DIF at node 3
Figure 16. Probability distribution of DIF at node 7 Figure 20. Probability distribution of DIF at node 7
20
Xuan Toan Nguyen, Cong Thuat Dang, Thi Kim Loan Nguyen
REFERENCES
[1] B. Alois, P. Croce, L. Sanpaolesi, and S. Gerhard, "ENV1991- Part 3: Traffic loads on bridges. Calibration of road load models for road bridges”, Proceedings of IABSE Colloquium, Vol. 74, 439– 453, 1996. [2] H. S. Zibdeh, “Stochastic vibration of an elastic beam due to random moving loads and deterministic axial forces”, Eng. Struct., vol. 17, no. 7, pp. 530–535, 1995.
[3] P. S´niady, S. Biernat, R. Sieniawska and S. Zukowski, “Vibrations of the beam due to a load moving with stochastic velocity”, Probabilistic Eng. Mech. 16, vol. 16, pp. 53–59, 2001.
[4] F. Lu, J. H. Lin, D. Kennedy, and F. W. Williams, “An algorithm to study non-stationary random vibrations of vehicle-bridge systems”, Comput. Struct., vol. 87, no. 3–4, pp. 177–185, 2009, doi: 10.1016/j.compstruc.2008.10.004.
[5] X. Yin, Z. Fang, C. S. Cai, and L. Deng, “Non-stationary random vibration of bridges under vehicles with variable speed”, Eng. Struct., vol. 32, no. 8, pp. 2166–2174, 2010, doi: 10.1016/j.engstruct.2010.03.019.
[6] T. P. Chang, “Stochastic dynamic finite element analysis of bridge- vehicle system subjected to random material properties and loadings”, Appl. Math. Comput., vol. 242, pp. 20–35, 2014, doi: 10.1016/j.amc.2014.05.038.
Figure 21. Probability distribution of DIF at node 8
The results of the analysis of the displacement under the action of vehicles with randomly changing loads based on a set of data collected at Road Management Area IV and Dau Giay weighing station show that: the displacement of vertical displacement when analyzed according to vehicle load of Road Management Area IV is always larger than the displacement of displacement when analyzed according to vehicle load of Dau Giay weighing station.
[7] S. Sorrentino, “Power Spectral Density Response of Bridge-Like Structures Loaded by Stochastic Moving Forces”, Shock Vib., vol. 2019, 2019, doi: 10.1155/2019/1790480.
[8] A. Camara, I. Kavrakov, K. Nguyen, and G. Morgenthal, “Complete framework of wind-vehicle-bridge interaction with random road surfaces”, J. Sound Vib., vol. 458, pp. 197–217, 2019, doi: 10.1016/j.jsv.2019.06.020.
The displacement in the area corresponding to the overload load of Road Management Area IV tends to increase and is larger than the displacement currently applied in bridge design standards according to AASHTO [23] and TCVN 11823-2017 [24], with a value of 1.33.
[9] P. A. Montenegro, J. M. Castro, R. Calçada, J. M. Soares, H. Coelho, and P. Pacheco, “Probabilistic numerical evaluation of dynamic load allowance factors in steel modular bridges using a vehicle-bridge interaction model”, Eng. Struct., vol. 226, p. 111316, 2021.
[10] Y. Shao, C. Miao, J. M. W. Brownjohn, and Y. Ding, “Vehicle-bridge interaction system for long-span suspension bridge under random traffic distribution”, Structures, vol. 44, pp. 1070–1080, 2022. [11] A. Gonzalez and A. Znidaric, Recommendations on dynamic amplification allowance: ARCHES deliverable D10, 75. European Commission, 2009.
According to the load distribution and DIF charts, it can be concluded that the DIF increases significantly when the load increases. The increase in DIF and load will be very dangerous for the bridge structure during operation. Accordingly, the increase in dynamic coefficient with a larger load in Road Management Area IV compared to the Dau Giay weighing station needs to be doubly warned to avoid causing danger to the bridge structure.
[12] AASHTO, Standard specifications for highway bridges and incidental structures, USA: American Association of State Highway and Transportation Officials, 1928.
the DIF random variable
[13] AASHTO, Guide specifications for strength evaluation of existing steel and concrete bridges, USA: American Association of State Highway and Transportation Officials, 1989.
The analysis results also show that the probability distribution of is very complicated. The rules of the input random variables (vehicle load) and the output random variables (DIF) are not the same as the probability rules, proving that the mapping relationship between them is not monotonous.
5. Conclusion
[14] G. HVS, “Impact factors for highway bridges”, ASTM STP 1992, vol. 11164, pp. 155–166, 1992, doi: 10.9790/1684-1306046973. [15] T. Wang, D. Huang, and M. Shahawy, “Dynamic Behavior of Slant‐ Legged Rigid‐Frame Highway Bridge”, J. Struct. Eng., vol. 120, no. 3, pp. 885–902, 1994, doi: 10.1061/(asce)0733-9445(1994)120:3(885). [16] M. S. D. Huang, T. Wang, “Vibration of thin-walled box-girder bridges excited by vehicles”, J. Struct. Eng., vol. 121, pp. 1330– 1337, 1995.
[17] B. M. Fafard, M. Laflamme, M. Savard, and M. Bennur, “Dynamic analysis of existing continuous bridge”, Journal of Bridge Engineering, vol. 3, no. 1, pp. 28–37, 1998.
[18] L. Deng, Y. Yu, Q. Zou, and C. S. Cai, “State-of-the-Art Review of Dynamic Impact Factors of Highway Bridges”, J. Bridg. Eng., vol. 20, no. 5, p. 04014080, 2015, doi: 10.1061/(asce)be.1943- 5592.0000672.
[19] D. W. Scott, Multivariate density estimation: Theory, practice, and
visualization. John Wiley & Sons, 2015.
[20] N. Lan, Research on evaluation and determination of allowable load on bridges based on bridge inspection results, PhD thesis, University of Transport and Communications, 2015.
[21] R. W. Clough and J. Penzien, Dynamics of structrures. McGraw-
Hill, Inc.Singapore, 1993.
[22] O. Zienkiewicz, R. Taylor and J. Z. Zhu, The Finite Element Method
(Sixth edition), 2005.
[23] AASHTOLRFD, Bridge design specifications, Washington, DC,
2012.
[24] Ministry of Transport, National Standard TCVN 11823:2017 on
This paper examines the DIF of a girder bridge with a link slab, specifically under the influence of vehicles with randomly varying loads. Actual vehicle load data collected and processed at the Dau Giay weighing station and Road Management Area IV were utilized in the analysis. The findings reveal that the probability distribution of the random variable DIF exhibits significant complexity, reflecting the dynamic behavior of the bridge under fluctuating loading conditions. The DIF of displacement analyzed according to the vehicle load of Road Management Area IV is mostly larger than the DIF of displacement when analyzed according to the vehicle load of the Dau Giay weighing station. The DIF in the area corresponding to the overload load of Road Management Area IV tends to increase and is larger than the DIF currently applied in the bridge design standard with a value of 1.33. The increase in dynamic coefficient along with the larger load in Road Management Area IV compared to Dau Giay weighing station needs to be doubly warned to avoid causing danger to the bridge structure.
Road Bridge Design, 2017.