Nong Lam University, Ho Chi Minh City 155
The Journal of Agriculture and Development 23(Special issue 1) www.jad.hcmuaf.edu.vn
Effects of water quality parameters on growth performance of intensive shrimp pond
(Litopenaeus vannamei)
Dung D. Do1✳, Anh H. Le1, Van V. Vu2, Duong P. T. Nguyen3, & Hung V. Can1
1Institute of Environmental Science, Engineering and Management, Industrial University of Ho Chi Minh
City, Ho Chi Minh City, Vietnam
2NTT Hi-Tech Institute, Nguyen Tat Thanh University, Ho Chi Minh City, Vietnam
3Office of Science Management and International Affairs, Industrial University of Ho Chi Minh City, Ho Chi
Minh City, Vietnam
ARTICLE INFO ABSTRACT
Research Paper
Received: August 06, 2024
Revised: October 04, 2024
Accepted: October 07, 2024
Keywords
Grow rate
Intensive ponds
Litopenaeus vannamei
Water quality
*Corresponding author
Do Doan Dung
Email:
dodoandung@iuh.edu.vn
Currently, to monitor water quality, farmers in Vietnam need to
analyze various indicators which increase production costs. In
addition, the limitation of analytical facilities and techniques is
a challenge. The objective of this experiment was to evaluate the
influence of water quality parameters on shrimp growth rates and
the seasonal fluctuation in water quality. A total of 4 modules were
randomly selected and analyzed daily for 8 critical parameters
during rainy and dry seasons. The SPSS ver.26 was used to evaluate
the correlation between multi-parameters and their impact on the
performance of shrimp ponds. The results showed that shrimp
growth was influenced by salinity, nitrite (NO2
-), alkalinity and
pH about 80.4%, 75.6%, 67.8%, and 55.7%, respectively. Moreover,
water quality fluctuated more during the rainy season than during
the dry season. Some parameters that exhibited high fluctuation in
ponds were dissolved oxygen (DO) and nitrite.
Cited as: Do, D. D., Le, A. H., Vu, V. V., Nguyen, D. P. T., & Can, H. V. (2024). Effects of water quality
parameters on growth performance of intensive shrimp pond (Litopenaeus vannamei). The Journal
of Agriculture and Development 23(Special issue 1), 155-169.

156 Nong Lam University, Ho Chi Minh City
The Journal of Agriculture and Development 23(Special issue 1) www.jad.hcmuaf.edu.vn
1. Introduction
Water quality is an essential natural indicator
for assessing the life cycle of shrimp pond
ecosystems (Mahmudi et al., 2022; Ariadi et al.,
2023). As the most sensitive spice Shrimp health is
negatively impacted when the values of physical,
chemical, and mineral parameters exceed
defined limits (Boyd, 2017; Ariadi et al., 2019).
Moreover, fluctuations in these parameters can
adversely affect shrimp performance (Hukom et
al., 2020). That’s why, increasing understanding
of the information on contamination and
limiting its effect can reduce the death rate of
shrimp by expressing the daily water quality data
(Ma et al., 2013).
Along with water quality monitoring, shrimp
growth rates are a crucial indicator of effective
farm management. Early research showed that
water quality parameters had different influences
on the length of the shrimp culture period.
(Ariadi et al., 2019; Chen et al., 2019) concluded
that enhancing the water recirculation rate can
lead to better water quality and stimulate shrimp
growth. In detail, dissolved oxygen (DO) is an
essential abiotic parameter for evaluating water
quality in intensive whiteleg shrimp (Litopenaeus
vannamei) farming systems and needs to be
measured periodically (Madenjian, 1990;
Supriatna et al., 2017; Osaka et al., 2022). The
ideal average dissolved oxygen concentration
for this process falls between 4 and 6 mg/L
(Ferreira et al., 2011), and its solubility is greatly
affected by salinity and water temperature (Boyd,
2017). When DO levels are low, the toxicity of
ammonia gas can increase, making aquatic
organisms more susceptible to stress (Sriyasak
et al., 2015). Furthermore, physical parameters,
such as temperature and salinity, have significant
impacts on shrimp growth (Ponce-Palafox et al.,
1997; Ren et al., 2021; Atikah & Hasibuan, 2023).
In some studies, the fluctuation of alkalinity
and hardness concentration affects shrimp
production (Boyd, 2016; Boyd et al., 2016; Ge
et al., 2023). Thus, farmers strive to avoid this
in aquaculture ponds. Additionally, the value
decreases could prevent shrimp growth in
intensive farming ponds. Meanwhile, Phan et
al. (2022) and Valencia-Castañeda et al. (2019)
showed that high level of ammonia, nitrate and
nitrite (NO2
-) are toxics the survival of whiteleg
shrimp. In general, poor water quality reduces
shrimp growth and increases mortality rates due
to ecosystem fluctuations (Anand et al., 2019;
Kumar, 2023; Srinivas & Venkatrayulu, 2023).
To evaluate immediately and more accurately
the farming environment, several parameters
should be monitored in shrimp cultivation. This
can be a result of high cost and reduction in price
competition in the new normal period (Nikolik
et al., 2024). Furthermore, in the past, some
researchers have conducted an investigation
of water quality impacts on the shrimp culture
system using the initial weight or final weight
or simulation conditions in some experimental
ponds. Thus, it cannot demonstrate the daily
effectiveness of water characteristics on shrimp
growth in real conditions.
In this study, the size of shrimp was collected
more frequently than in previous studies.
Together with daily water collection, 8 significant
water parameters were selected. The purpose of
determining the relationship between variations
in dissolved oxygen parameters and water
quality and their impact on shrimp growth rates
in intensive farming cycles can be achieved. This
helps farmers determine the most important
indicator for a successful farming cycle and
supports in making decisions.
Nong Lam University, Ho Chi Minh City 157
The Journal of Agriculture and Development 23(Special issue 1) www.jad.hcmuaf.edu.vn
To ensure the required dissolved oxygen levels,
paddlewheel aerators and bottom air diffusers
were installed in each tank. Before stocking, pH
and alkalinity were tested at the settlement pond,
and it was pumped into post-larvae ponds. Each
module is controlled separately following the
module manager. A two-stage farming method
was applied. The nursery phase typically lasts
12 - 15 days, followed by the grow-out phase.
Normally, there is no water exchange in post-
larvae ponds. The water exchange rate in grow-
out ponds is 10 - 12% depending on the module
manager’s decision.
2. Materials and Methods
2.1. Study area
This research collected actual farming
activities data at Minh Phu - Loc An Aquaculture
Ltd, a 300-ha intensive shrimp farm in Vietnam,
situated at Ba Ria- Vung Tau province, the
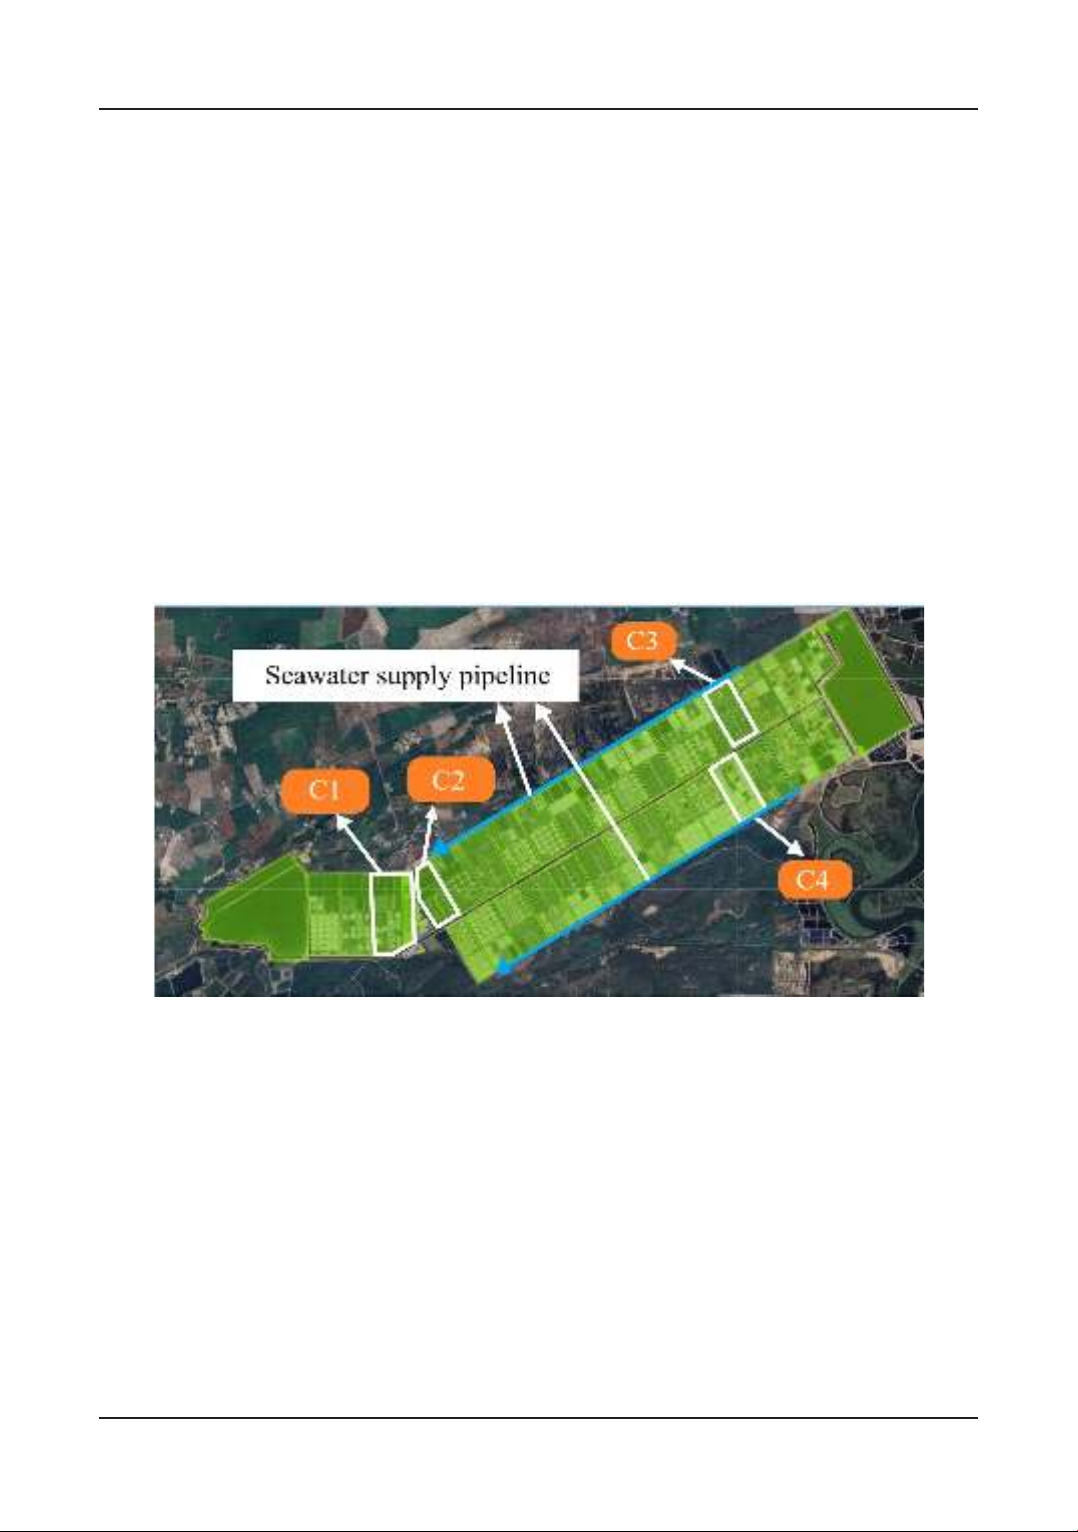
southeast delta of Vietnam (Figure 1). Seawater
is directly collected by a 20 km seawater pipeline
supply for shrimp ponds. Each module includes
10 post-larvae ponds, 20 growing ponds and
individual water treatment systems. Each post-
larvae pond had 232 m2 and the growing pond
had 834 m2 with 1.0 m water depths in both types.
Figure 1. Map of the study area and sampling site at Minh Phu-Loc An Aquaculture Ltd,
Dat do district, Ba Ria-Vung Tau province, Vietnam. C1 - C4: are denoted for shrimp
modules taking water samples.
2.2. Experimental set-up
The method applied is an ex-post facto
causal design, which implies analyzing the
research objectives based on the existing natural
phenomena in the field, over a period of a shrimp
yield, with total a 8 ponds in 4 shrimp modules
(2 ponds for each module) located downstream
(C1 & C2) and upstream (C3 & C4) of seawater
pipeline as Figure 1. In each preselected module,
2 ponds were randomly chosen. The quality
parameters in the farming operations, including
DO, pH, temperature, salinity, alkalinity, nitrite,
phosphate, and total ammonia nitrogen (TAN),
are determined on-site daily at 8 am. Because
seasonal variation is considered an important
natural factor influencing water quality, water
samples were taken from the stocking day until

158 Nong Lam University, Ho Chi Minh City
The Journal of Agriculture and Development 23(Special issue 1) www.jad.hcmuaf.edu.vn
2.4. Statistical analysis
The collected data are analyzed by using SPSS
ver.26 software to analyze the impact of observed
parameters on shrimp growth rates. The seasonal
fluctuations in water quality throughout the year
are also described to understand the reflection of
climate change.
The energy consumption required to maintain
the desired DO levels is significant in a farming
cycle. Therefore, assessing the dynamics of water
quality parameters with DO levels is extremely
important. The mentioned software was also
used to demonstrate this relation.
3. Results and Discussion
3.1. The dynamics of water quality parameters
with DO
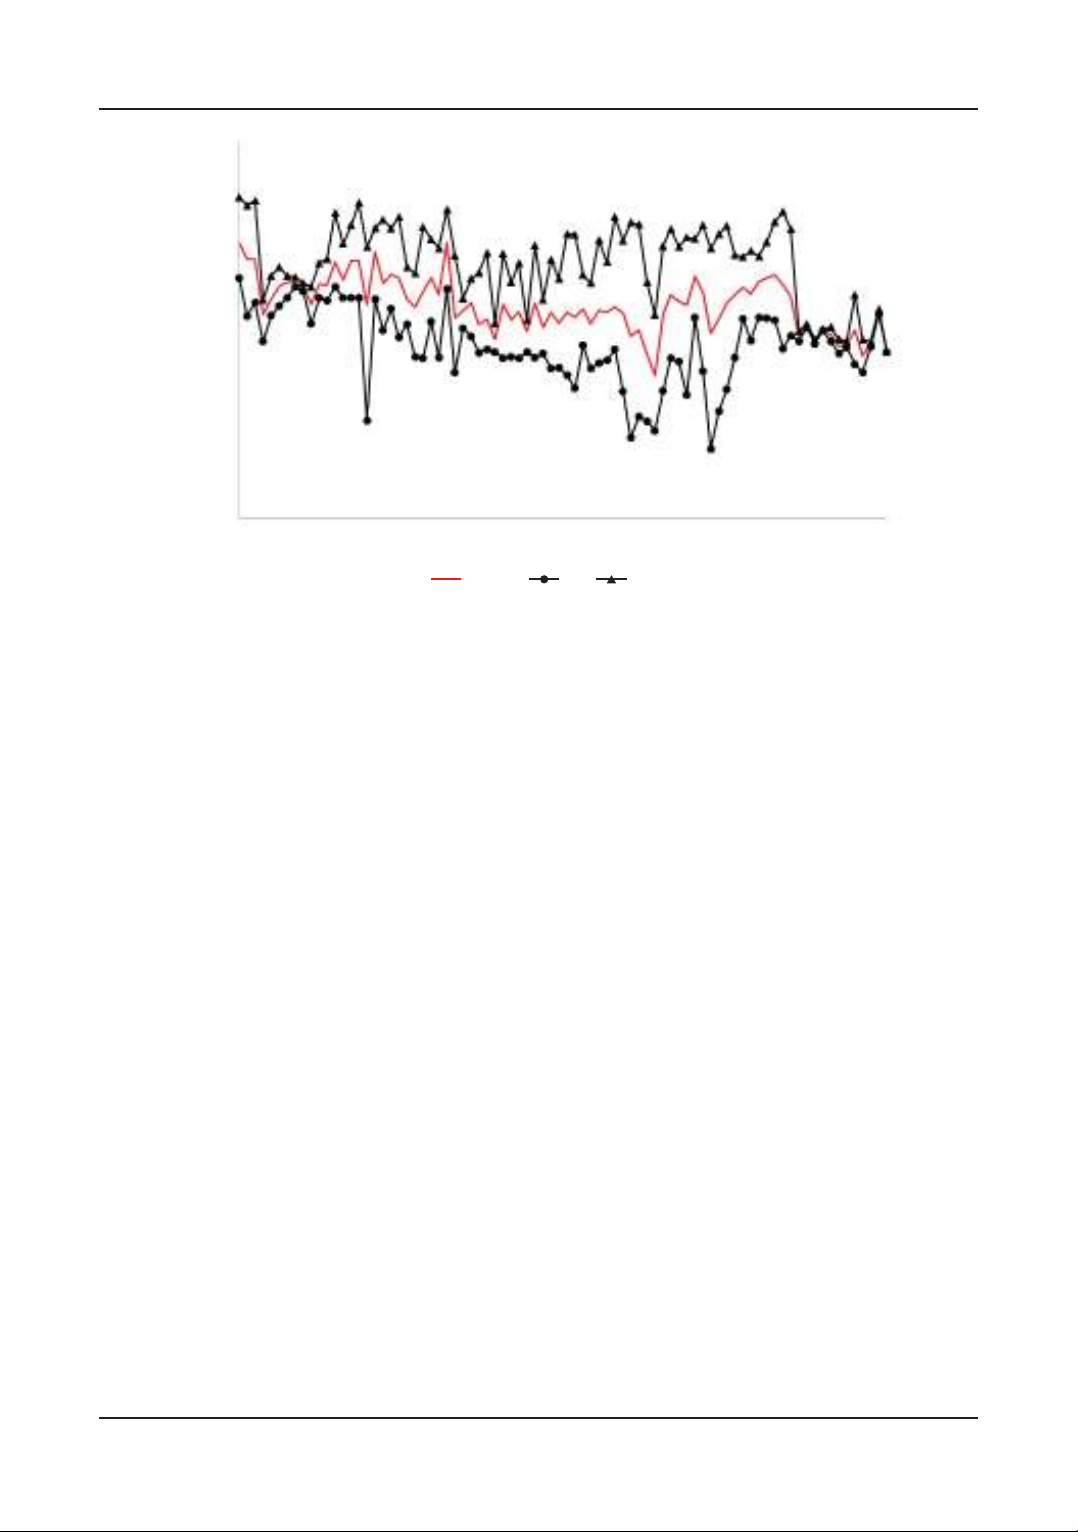
The fluctuating values of DO concentration in
a whiteleg shrimp farming cycle are presented in
Figure 2. The lowest concentration point occurs at
60 days of farming on the harvesting day of module
C4 at 4.73 mg/L, while the highest concentration
value is observed on the first day (7.41 mg/L).
The DO decrease may occur due to the retaining
feeding rate after dusk. The food surplus can
potentially increase synthesis and cause changes
in DO. Similarly, DO consumption levels decrease
along with the increase in feed input, due to the
biosynthesis process of waste and other organic
materials, align with Ma et al. (2013), Mirzaei
et al. (2019) and Wafi et al. (2021). Our results
are consistent with Ullman et al. (2019) and
Weldon et al. (2021), who reported that higher
feed amounts used generally lead to higher DO
consumption in the water. Other reasons for the
decrease at certain times include abiotic factors
such as water temperature, pH, and salinity. This
was reported by Boyd & Tucker (2012), Cao et al.
(2019) and Rozario & Devarajan (2021).
harvesting day during dry and rainy seasons.
Additionally, to examine how water quality
affects the growth of shrimp, the size of shrimp
(g/pcs) was monitored by request from post-
larvae phase to grow-out phase. The module
manager determined the optimal period for
measuring shrimp size.
2.3. Water sampling and analysis
Based on the experimental set-up, a Van
Dorn water sampler was used to take water
samples daily. A total of 506 water samples
were taken from 8 crops during the rainy and
dry season. Water samples were taken in the 30
- 50 cm from the surface layer. Some physical
parameters, such as DO, pH, temperature and
salinity were measured directly using Aqua
TROLL 500 Multiparameter Sonde (In-Situ Inc,
Fort Collins, USA). An on-site laboratory was set
up for the analysis of chemical parameters, such
as alkalinity, nitrite, phosphate, and TAN. These
parameters were determined as SMEWW by
using HI801-02 (iris Visible Spectrophotometer,
Hanna Instruments Inc, Woonsocket, RI, USA).
Normally, shrimp size is the most suitable
indicator in a batch. Previously, these assessments
were only done manually on the harvesting day
(Smith et al., 2002; Chen et al., 2019; Amalia et
al., 2022). In this article, the artificial intelligence
sizing machine S3 (Otanics Technology Jsc,
Vietnam) was used to determine the shrimp
body weight. With S3, we collected more data of
the growth rate in a crop than in other studies
because the growth rate of post-larvae phase
can be easily measured by S3 than before.
Furthermore, using S3 helps to keep the shrimp
alive after sizing and protects the survival rate of
the shrimp.
Nong Lam University, Ho Chi Minh City 159
The Journal of Agriculture and Development 23(Special issue 1) www.jad.hcmuaf.edu.vn
8.00
7.50
6.50
5.50
4.50
4.00
1 4 7 10 13 16 19 22 25 28 31 34 37 40
doc
DO mean MIN MAX
43 46 49 52 55 58 61 64 67 70 73 76 79 82
5.00
7.00
6.00
ppm
and upstream (C3 & C4) modules was observed
in Table 1. The average value of this parameter
in this study area is 30.29 ppt. The distinction
of module manager’s decision about daily water
exchange rate may be the reason of salinity
change. The DO level has an average value of 6.33
mg/L. The optimal pH range for whiteleg shrimp
farming is 7.5 - 8.5, with a fluctuation range of
0.5, algin with Reddy & Mounika (2018). The
obtained salinity value in this study is 30.29 ppt.
Meanwhile, the optimal range is approximately 20
- 25 ppt (Ferreira et al., 2011). On the other hand,
shrimp can naturally thrive within a salinity range
of 0 to 40 ppt due to their osmoregulatory system
(Ponce-Palafox et al., 1997; Jaffer et al., 2020;
Khanjani et al., 2020). The average temperature
obtained in the study is 27.53°C, optimal for
shrimp development. This was reported by
Wyban et al. (1995) and Madusari et al. (2022),
where the optimal range is 27 - 30°C. It can be
affirmed that DO concentration, pH, salinity, and
temperature during the shrimp farming period
all fall within optimal ranges.
The average DO concentration is presented
in Table 1. The average DO concentration is
6.33 ± 0.39 mg/L, with a minimum of 4.73 mg/L
and a maximum of 7.41 mg/L. This satisfied the
requirement of maintaining a DO level above 4.5
mg/L in shrimp farming during culture time, as
mentioned in studies of Simbeye & Yang (2014)
and Adetunji et al. (2022). The normal DO level
in our study was higher than the optimal value
for shrimp farming ranging between 4 - 5 mg/L
as reported by Islam et al. (2004). The optimal
value is crucial for changes in pond water quality
and is an important parameter for aerobic
respiration and redox processes in water and
pond sediments (Boyd, 2017).
The data on water quality parameters for each
module are presented in Table 1. The pH values
of C1, C2, C3, and C4 are 7.65 ± 0.34, 7.62 ± 0.31,
7.99 ± 0.14 and 7.96 ± 0.12, respectively. Daily pH
measurements for 4 modules yielded an average
value of 7.8 ± 0.23. The difference of the salinity
of the water in downstream (C1 & C2) modules
Figure 2. The fluctuation of dissolved oxygen levels during the shrimp farming period. MIN:
minimum value; DO: dissolved oxygen; MAX: maximum value; doc: days of culture.