
BioMed Central
Page 1 of 14
(page number not for citation purposes)
Journal of Translational Medicine
Open Access
Research
Gene profiling, biomarkers and pathways characterizing
HCV-related hepatocellular carcinoma
Valeria De Giorgi1,2, Alessandro Monaco3, Andrea Worchech3,4,5,
MariaLina Tornesello1, Francesco Izzo6, Luigi Buonaguro1,
Francesco M Marincola3, Ena Wang3 and Franco M Buonaguro*1
Address: 1Molecular Biology and Viral Oncogenesis & AIDS Refer. Center, Ist. Naz. Tumori "Fond. G. Pascale", Naples - Italy, 2Department of
Chemistry, University of Naples "Federico II", Naples, Italy, 3Infectious Disease and Immunogenetics Section (IDIS), Department of Transfusion
Medicine, Clinical Center and Trans-NIH Center for Human Immunology (CHI), National Institutes of Health, Bethesda, MD -USA, 4Genelux
Corporation, Research and Development, San Diego Science Center, San Diego, CA, USA, 5Department of Biochemistry, Biocenter, University of
Wuerzburg, Am Hubland, Wuerzburg, Germany and 6Div. of Surgery "D", Ist. Naz. Tumori "Fond. G. Pascale", Naples - Italy
Email: Valeria De Giorgi - valeriadegiorgi@tin.it; Alessandro Monaco - monacoal@cc.nih.gov; Andrea Worchech - worschecha@cc.nih.gov;
MariaLina Tornesello - mltornesello@alice.it; Francesco Izzo - izzo@connect.it; Luigi Buonaguro - lbuonaguro@tin.it;
Francesco M Marincola - FMarincola@mail.cc.nih.gov; Ena Wang - ewang@mail.cc.nih.gov; Franco M Buonaguro* - irccsvir@unina.it
* Corresponding author
Abstract
Background: Hepatitis C virus (HCV) infection is a major cause of hepatocellular carcinoma (HCC)
worldwide. The molecular mechanisms of HCV-induced hepatocarcinogenesis are not yet fully elucidated.
Besides indirect effects as tissue inflammation and regeneration, a more direct oncogenic activity of HCV
can be postulated leading to an altered expression of cellular genes by early HCV viral proteins. In the
present study, a comparison of gene expression patterns has been performed by microarray analysis on
liver biopsies from HCV-positive HCC patients and HCV-negative controls.
Methods: Gene expression profiling of liver tissues has been performed using a high-density microarray
containing 36'000 oligos, representing 90% of the human genes. Samples were obtained from 14 patients
affected by HCV-related HCC and 7 HCV-negative non-liver-cancer patients, enrolled at INT in Naples.
Transcriptional profiles identified in liver biopsies from HCC nodules and paired non-adjacent non-HCC
liver tissue of the same HCV-positive patients were compared to those from HCV-negative controls by
the Cluster program. The pathway analysis was performed using the BRB-Array- Tools based on the
"Ingenuity System Database". Significance threshold of t-test was set at 0.001.
Results: Significant differences were found between the expression patterns of several genes falling into
different metabolic and inflammation/immunity pathways in HCV-related HCC tissues as well as the non-
HCC counterpart compared to normal liver tissues. Only few genes were found differentially expressed
between HCV-related HCC tissues and paired non-HCC counterpart.
Published: 12 October 2009
Journal of Translational Medicine 2009, 7:85 doi:10.1186/1479-5876-7-85
Received: 2 July 2009
Accepted: 12 October 2009
This article is available from: http://www.translational-medicine.com/content/7/1/85
© 2009 De Giorgi et al; licensee BioMed Central Ltd.
This is an Open Access article distributed under the terms of the Creative Commons Attribution License (http://creativecommons.org/licenses/by/2.0),
which permits unrestricted use, distribution, and reproduction in any medium, provided the original work is properly cited.

Journal of Translational Medicine 2009, 7:85 http://www.translational-medicine.com/content/7/1/85
Page 2 of 14
(page number not for citation purposes)
Conclusion: In this study, informative data on the global gene expression pattern of HCV-related HCC
and non-HCC counterpart, as well as on their difference with the one observed in normal liver tissues
have been obtained. These results may lead to the identification of specific biomarkers relevant to develop
tools for detection, diagnosis, and classification of HCV-related HCC.
Introduction
Hepatocellular carcinoma (HCC) is the most common
liver malignancy as well as the third and the fifth cause of
cancer death in the world in men and women, respectively
[1-3]. As for other types of cancer, the etiology and patho-
genesis of HCC is multifactorial and multistep [4]. The
main risk factor for development of HCC are the hepatitis
B and C virus (HBV and HCV) infection [5-8]. Non viral
causes, such as toxins and drugs (i.e., alcohol, aflatoxins,
microcystin, anabolic steroids), metabolic liver diseases
(i.e., hereditary haemochromatosis, α1-antitrypsin defi-
ciency), steatosis and non-alcoholic fatty liver diseases as
well as diabetes, play a role in a minor number of cases [9-
11]. The prevalence of HCC in Italy, and in Southern Italy
in particular, is significantly higher compared to other
Western countries. Hepatitis virus infection, long-term
alcohol and tobacco consumption account for 87% of
HCC cases in Italian population and, among these, 61%
of HCC are attributable to HCV. In particular, a recent
seroprevalence surveillance study conducted in the gen-
eral population of Southern Italy Campania Region
reported a 7.5% positivity for HCV infection which
peaked at 23.2% positivity in the 65 years or older age
group [12]. The multistep progression to HCC, in particu-
lar the one associated to hepatitis virus, is characterized by
a process including chronic liver injury, tissue inflamma-
tion, cell death, cirrhosis, regeneration, DNA damage, dys-
plasia and finally, HCC. In this multistep process, the
cirrhosis represents the preneoplastic stage showing
regenerative, dysplastic as well as HCC nodules [13].
The precise molecular mechanism underlying the progres-
sion of chronic hepatitis viral infections to HCC is cur-
rently unknown. Activation of cellular oncogenes,
inactivation of tumor suppressor genes, overexpression of
growth factors, telomerase activation and defects in DNA
mismatch repair may contribute to the development of
HCC [14-16]. In this framework, differential gene expres-
sion patterns accompanying different stages of growth,
disease initiation, cell cycle progression, and responses to
environmental stimuli provide important clues to this
complex process.
DNA microarray enables investigators to study expression
profile and activation of thousands of genes simultane-
ously. In particular, the identification of cancer-related
stereotyped expression patterns might allow the elucida-
tion of molecular mechanisms underlying cancer progres-
sion and provides important molecular markers for
diagnostic purposes. This strategy has been recently used
to profile global changes in gene expression in liver sam-
ples obtained from patients with HCV-related HCC [17-
19]. Several of these studies identified gene sets that may
be useful as potential microarray-based diagnostic tools.
However, the direct or indirect HCV role in HCC patho-
genesis is still a controversial issue and additional efforts
need to be made aimed to specifically dissect the relation-
ship between stages of HCV chronic infection and pro-
gression to HCC.
The present study has been focused on investigating genes
and pathways involved in viral carcinogenesis and pro-
gression to HCC in HCV-chronically infected patients.
Materials and methods
Patient and Tissue Samples
Liver biopsies from fourteen HCV-positive HCC patients
and seven HCV-negative non-liver cancer control patients
(during laparoscopic cholecystectomy) were obtained
with informed consent at the liver unit of the INT "Pas-
cale" in Naples. In particular, from each of the HCV-posi-
tive HCC patients, a pair of liver biopsies from HCC
nodule and non-adjacent non-HCC counterpart were sur-
gically excised. All liver biopsies were stored in RNA Later
at -80°C (Ambion, Austin, TX). Confirmation of the his-
topathological nature of the biopsies was performed by
the Pathology lab at INT before the processing for RNA
extraction. The non-HCC tissue from HCV-positive
patient were an heterogeneous sample representing the
prevalent liver condition of each subject (ranging from
persistent HCV-infection to cirrhotic lesions). Further-
more, laboratory analysis confirmed that the 7 controls
were seronegative for hepatitis C virus antibodies (HCV
Ab).
Preparation of RNA, probe preparation, and microarray
hybridization
Samples were homogenized in disposable tissue grinders
(Kendall, Precision). Total RNA was extracted by TRIzol
solution (Life Technologies, Rockville, MD), and purity of
the RNA preparation was verified by the 260:280 nm ratio
(range, 1.8-2.0) at spectrophotometric reading with Nan-
oDrop (Thermo Fisher Scientific, Waltham, MA). Integrity
of extracted RNA was evaluated by Agilent 2100 Bioana-

Journal of Translational Medicine 2009, 7:85 http://www.translational-medicine.com/content/7/1/85
Page 3 of 14
(page number not for citation purposes)
lyzer (Agilent Technologies, Palo Alto, CA), analyzing the
presence of 28S and 18S ribosomal RNA bands as well as
the 28S/18S rRNA intensity ratio equal or close to 1.5. In
addition, phenol contamination was checked and a
260:230 nm ratio (range, 2.0-2.2) was considered accept-
able.
Double-stranded cDNA was prepared from 3 μg of total
RNA (T-RNA) in 9 μl DEPC -treated H2O using the Super
script II Kit (Invitrogen) with a T7-(dT15) oligonucleotide
primer. cDNA synthesis was completed at 42°C for 1 h.
Full-length dsDNA was synthesized incubating the pro-
duced cDNA with 2 U of RNase-H (Promega) and 3 μl of
Advantage cDNA Polymerase Mix (Clontech), in Advan-
tage PCR buffer (Clontech), in presence of 10 mM dNTP
and DNase-free water. dsDNA was extracted with phenol-
chloroform-isoamyl, precipitated with ethanol in the
presence of 1 μl linear acrylamide (0.1 μg/μl, Ambion,
Austin, TX) and aRNA (amplified-RNA) was synthesized
using Ambion's T7 MegaScript in Vitro Transcription Kit
(Ambion, Austin, TX). aRNA recovery and removal of
template dsDNA was achieved by TRIzol purification. For
the second round of amplification, aliquots of 1 μg of the
aRNA were reverse transcribed into cDNA using 1 μl of
random hexamer under the conditions used in the first
round. Second-strand cDNA synthesis was initiated by 1
μg oligo-dT-T7 primer and the resulting dsDNA was used
as template for in vitro transcription of aRNA in the same
experimental conditions as for the first round [20]. 6 μg of
this aRNA was used for probe preparation, in particular
test samples were labeled with USL-Cy5 (Kreatech) and
pooled with the same amount of reference sample (con-
trol donor peripheral blood mononuclear cells, PBMC,
seronegative for hepatitis C virus antibodies (HCV Ab))
labeled with USL-Cy3 (Kreatech). The two labeled aRNA
probes were separated from unincorporated nucleotides
by filtration, fragmented, mixed and co-hybridized to a
custom-made 36 K oligoarrays at 42°C for 24 h. The
oligo-chips were printed at the Immunogenetics Section
Department of Transfusion Medicine, Clinical Center,
National Institutes of Health (Bethesda, MD). After
hybridization the slides were washed with 2 × SSC/
0.1%SDS for 1 min, 1 × SSC for 1 min, 0.2 × SSC for 1
min, 0.05 × SSC for 10 sec., and dried by centrifugation at
800 g for 3 minutes at RT.
Data Analysis
Hybridized arrays were scanned at 10-μm resolution with
a GenePix 4000 scanner (Axon Instruments) at variable
photomultiplier tube (PMT) voltage to obtain maximal
signal intensities with less than 1% probe saturation.
Image and data files were deposited at microarray data
base (mAdb) at http://nciarray.nci.nih.gov and retrieved
after median centered, filtering of intensity (>200) and
spot elimination (bad and no signal). Data were further
analyzed using Cluster and TreeView software (Stanford
University, Stanford, CA).
Statistical Analysis
Unsupervised Analysis
For this analysis, a low-stringency filtering was applied,
selecting the genes differentially expressed in 80% of all
experiments with a >3 fold change ratio in at least one
experiment. 7'760 genes were selected for the analysis
including the three groups of analyzed samples (the HCV-
related HCC, their non-HCC counterpart, as well as sam-
ples from the controls); 5'473 genes were selected for the
analysis including the HCV-related HCC and normal con-
trol samples; 6'069 genes were selected for the analysis
including the HCV-related non-HCC paired tissue and
normal control samples. Hierarchical cluster analysis was
conducted on these genes according to Eisen et al. [21];
differential expressed genes were visualized by Treeview
and displayed according to the central method [22].
Supervised Analysis
Supervised class comparison was performed using the
BRB ArrayTool developed at NCI, Biometric Research
Branch, Division of Cancer Treatment and Diagnosis.
Three subsets of genes were explored. The first subset
included genes upregulated in HCV-related HCC com-
pared to normal control samples, the second subset
included genes upregulated in the HCV-related non-HCC
counterpart compared with normal control samples, the
third subset included genes upregulated in HCV-related
HCC compared to the non-HCC paired liver tissue sam-
ples. Paired samples were analyzed using a two-tailed
paired Student's t-test. Unpaired samples were tested with
a two-tailed unpaired Student's t-test assuming unequal
variance or with an F-test as appropriate. All analyses were
tested for an univariate significance threshold set at a p-
value < 0.01 for the first subset of genes and at a p-value <
0.001 for the second subset. Gene clusters identified by
the univariate t-test were challenged with two alternative
additional tests, an univariate permutation test (PT) and a
global multivariate PT. The multivariate PT was calibrated
to restrict the false discovery rate to 10%. Genes identified
by univariate t-test as differentially expressed (p-value <
0.001 and p-value < 0.01) and a PT significance <0.05
were considered truly differentially expressed. Gene func-
tion was assigned based on Database for Annotation, Vis-
ualization and Integrated Discovery (DAVID) and Gene
Ontology http://www.geneontology.org/.
Ingenuity pathway analysis
The pathway analysis was performed using the gene set
expression comparison kit implemented in BRB-Array-
Tools. The human pathway lists determined by "Ingenuity
Journal of Translational Medicine 2009, 7:85 http://www.translational-medicine.com/content/7/1/85
Page 4 of 14
(page number not for citation purposes)
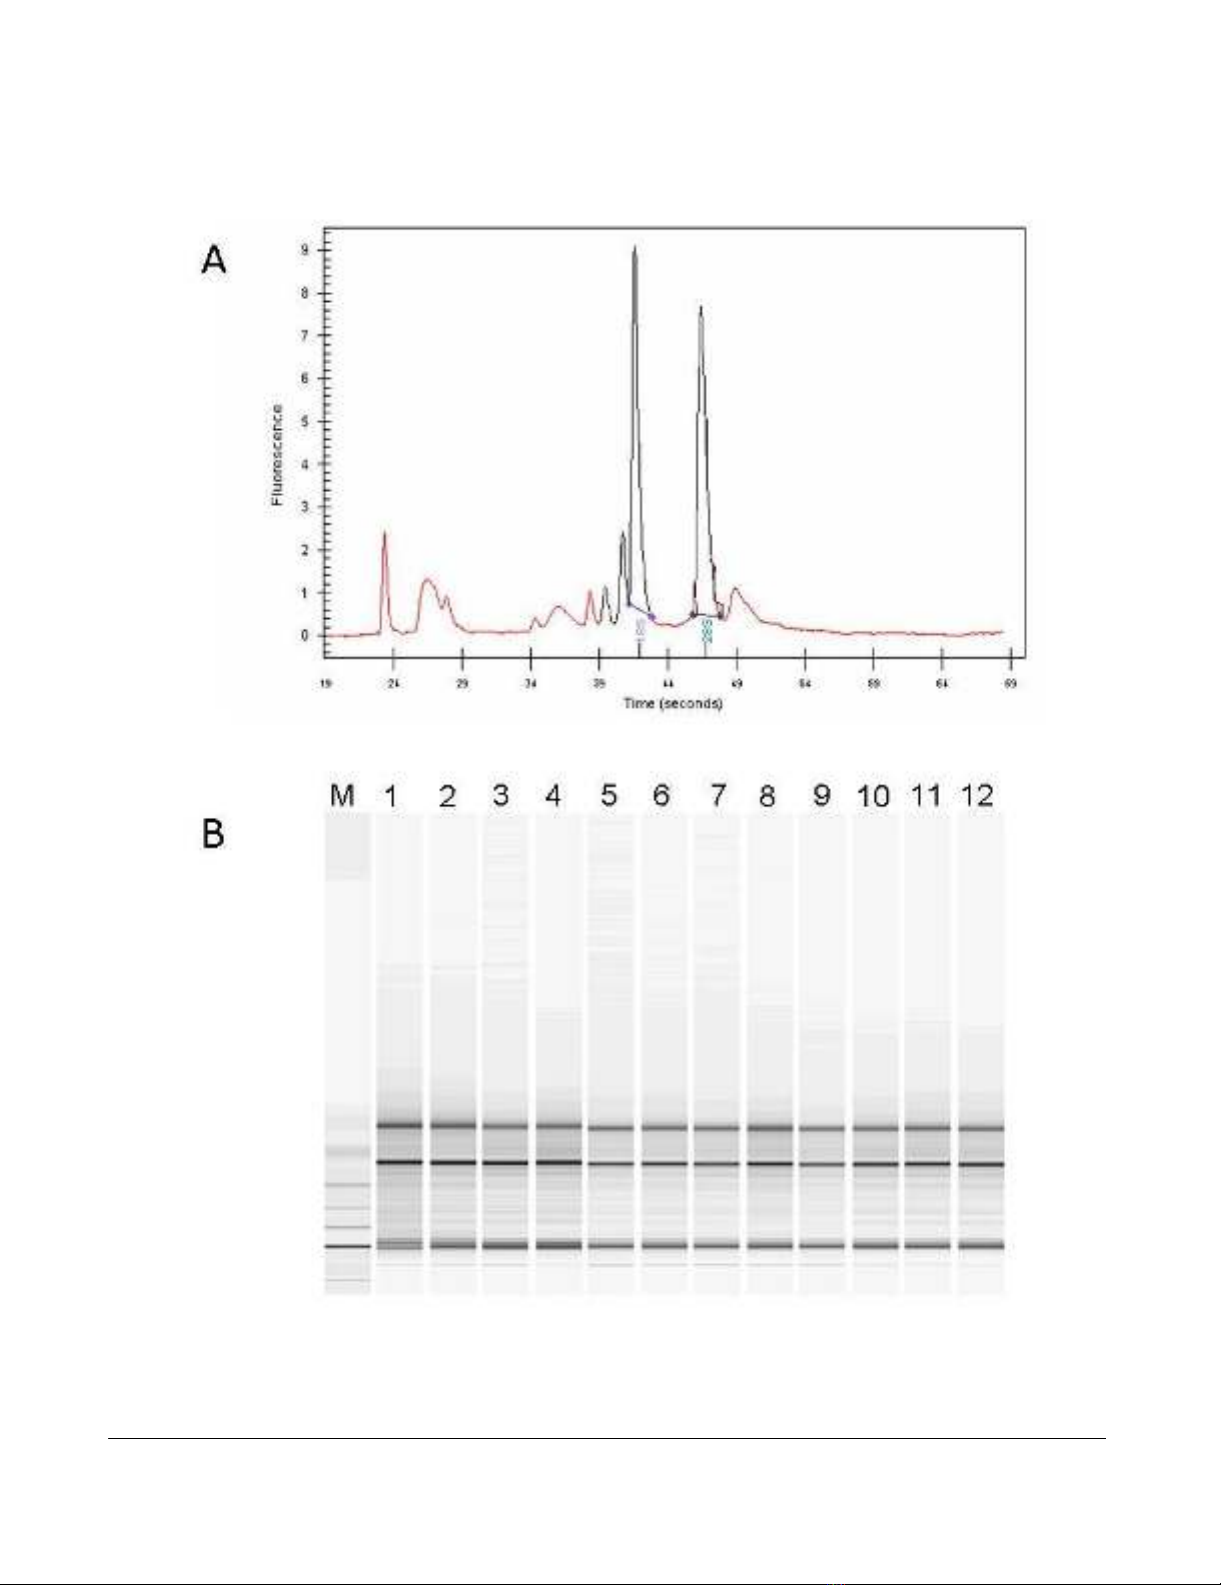
Purity and integrity quality control of total extracted RNAFigure 1
Purity and integrity quality control of total extracted RNA. (A) Representative Electropherogram of total RNA
extracted from samples included in the analysis. (B) Representative Gel image evaluation of RNA integrity and 28S/18S rRNA
ratio.
Journal of Translational Medicine 2009, 7:85 http://www.translational-medicine.com/content/7/1/85
Page 5 of 14
(page number not for citation purposes)
System Database" was selected. Significance threshold of
t-test was set at 0.001. The Ingenuity Pathways Analysis
(IPA) is a system that transforms large data sets into a
group of relevant networks containing direct and indirect
relationships between genes based on known interactions
in the literature.
Results
Quality Control
The quality of extracted total RNA was verified by Agilent
2100 Bioanalyzer (Agilent Technologies, Palo Alto, CA),
showing discrete 28S and 18S rRNA bands (Figure 1A) as
well as a 28S/18S rRNA intensity ratio equal or close to 1.5
which is considered appropriate for total RNA extracted
from liver tissue biopsies ("Assessing RNA Quality", http:/
/www.ambion.com/techlib/tn/111/8.html). Based on
this parameter, all extracted total RNA samples met the
quality control criteria (Figure 1B).
Unsupervised analysis is concordant with Pathological
Classification
The gene expression profiles of tissue samples from the
three groups of analyzed samples (the HCV-related HCC,
their non-HCC counterpart, as well as samples from con-
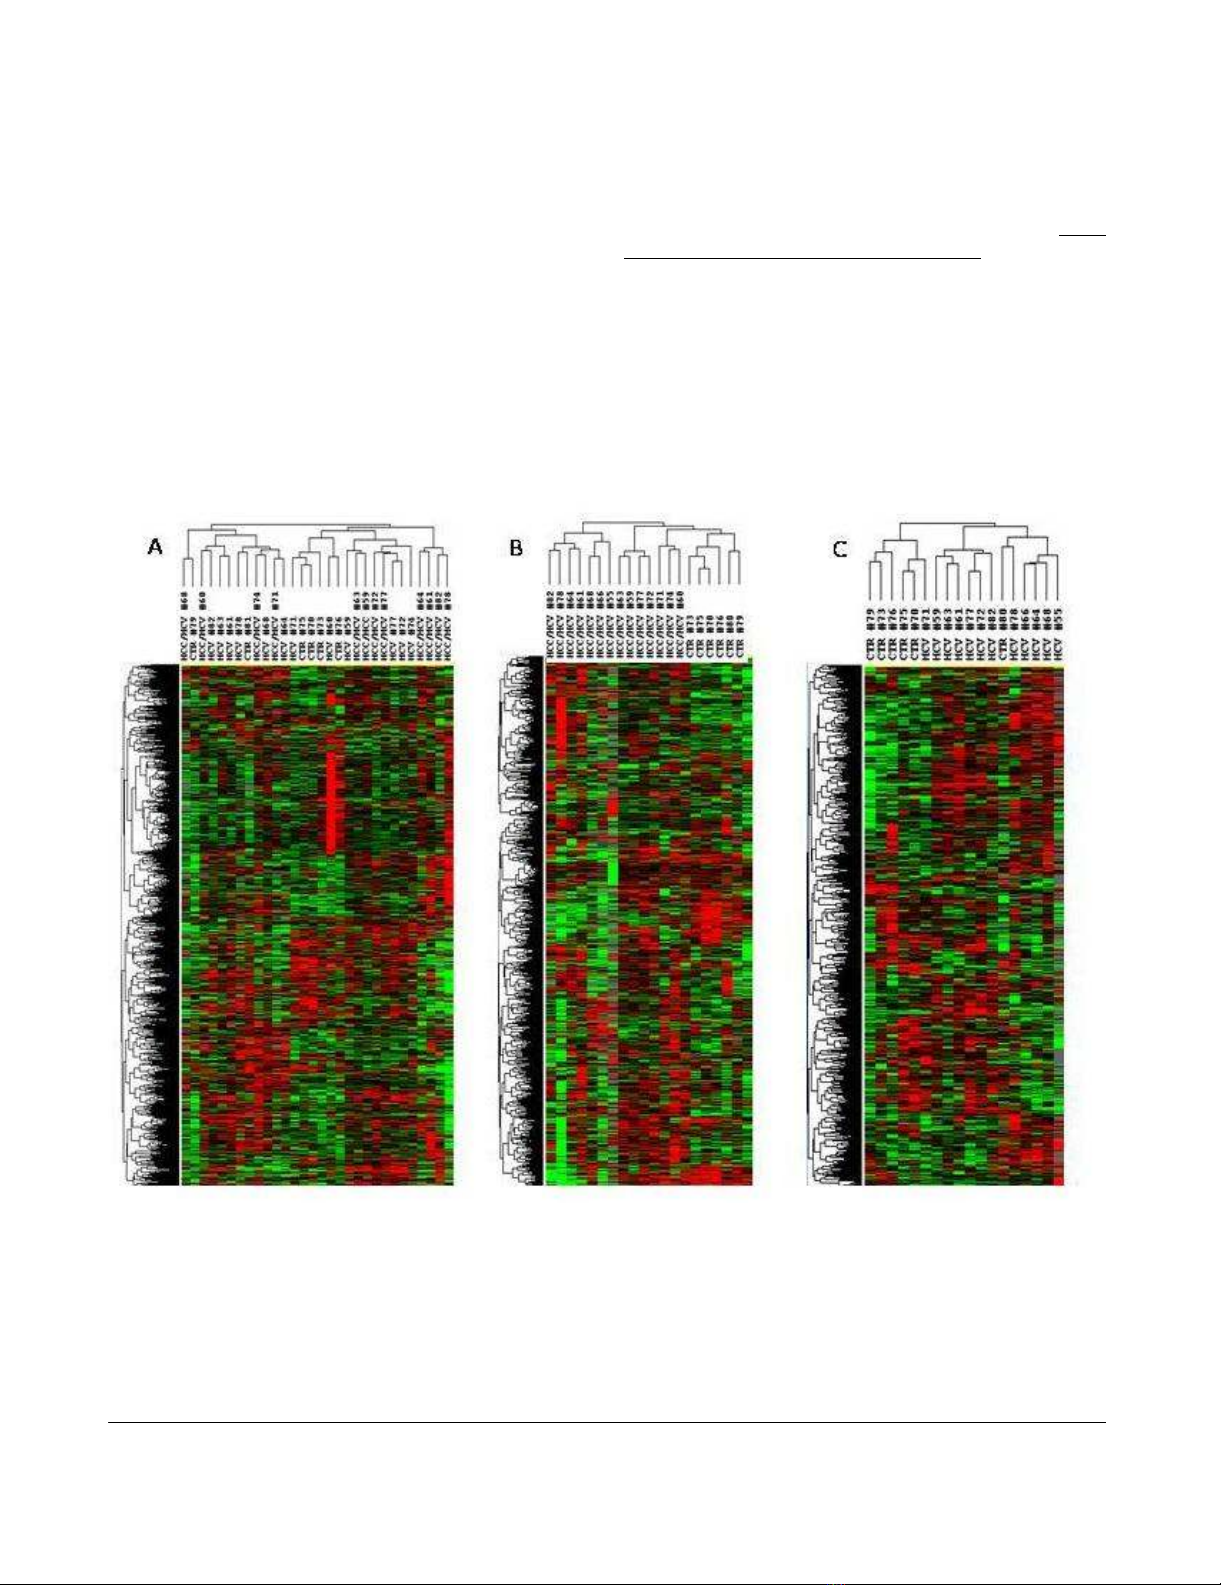
Unsupervised hierarchical clusteringFigure 2
Unsupervised hierarchical clustering. Overall patterns of expression of genes across the 14 HCV-related HCC and non-
HCC counterpart, as well as 7 HCV-negative control patients. Red indicates over-expression; green indicates under-expres-
sion; black indicates unchanged expression; gray indicates no detection of expression (intensity of both Cy3 and Cy5 below the
cutoff value). Each row represents a single gene; each column represents a single sample. The dendrogram at the left of matrix
indicates the degree of similarity among the genes examined by expression patterns. The dendrogram at the top of the matrix
indicates the degree of similarity between samples. Panel A, unsupervised analysis including all three set of samples; Panel B,
unsupervised analysis including HCV-related HCC and normal control liver samples; Panel C, unsupervised analysis including
HCV-related non-HCC counterpart and normal control liver samples.


![Báo cáo seminar chuyên ngành Công nghệ hóa học và thực phẩm [Mới nhất]](https://cdn.tailieu.vn/images/document/thumbnail/2025/20250711/hienkelvinzoi@gmail.com/135x160/47051752458701.jpg)


%20--%3e%3cdefs%3e%3cstyle%3e%20.st0%20{%20fill:%20%23fff;%20}%20.st1%20{%20fill:%20%237800fa;%20}%20%3c/style%3e%3c/defs%3e%3cpath%20class='st1'%20d='M117.78,12.18H43.11c2.9,3.47,4.65,7.94,4.65,12.82,0,5.6-2.3,10.66-6.01,14.29h76.02l7.22-13.56-7.22-13.56Z'/%3e%3cg%3e%3cpath%20class='st0'%20d='M53.58,26.17h-.59v-1.46h.59v-4.96h2.83c1.78,0,2.67.94,2.67,2.82v5.76c0,1.87-.89,2.81-2.67,2.81h-2.83v-4.96ZM55.36,21.37v3.34h1.1v1.46h-1.1v3.34h1.01c.61,0,.91-.37.91-1.1v-5.93c0-.74-.3-1.1-.91-1.1h-1.01Z'/%3e%3cpath%20class='st0'%20d='M65.99,31.14h-1.8l-.31-2.07h-2.19l-.31,2.07h-1.64l1.82-11.39h2.62l1.82,11.39ZM65.28,18.04c-.25.46-.51.77-.75.94-.21.15-.47.22-.79.22-.26,0-.57-.07-.92-.22l-.38-.15c-.14-.05-.26-.07-.37-.07-.3,0-.53.18-.71.54l-.91-.68c.25-.46.51-.77.75-.94.21-.14.48-.21.79-.21.26,0,.57.07.92.21l.38.15c.14.05.26.07.37.07.3,0,.53-.18.71-.54l.91.68ZM61.91,27.52h1.73l-.87-5.76-.87,5.76Z'/%3e%3cpath%20class='st0'%20d='M74.53,26.89v1.52c0,1.91-.89,2.86-2.67,2.86s-2.67-.95-2.67-2.86v-5.93c0-1.91.89-2.86,2.67-2.86s2.67.95,2.67,2.86v1.11h-1.69v-1.22c0-.75-.31-1.12-.93-1.12s-.93.37-.93,1.12v6.15c0,.74.31,1.11.93,1.11s.93-.37.93-1.11v-1.63h1.69Z'/%3e%3cpath%20class='st0'%20d='M81.4,31.14h-1.8l-.31-2.07h-2.19l-.31,2.07h-1.64l1.82-11.39h2.62l1.82,11.39ZM75.9,19.2l1.52-1.91h1.71l1.51,1.91h-1.61l-.76-.95-.75.95h-1.61ZM77.32,27.52h1.73l-.87-5.76-.87,5.76ZM83.1,15.99l-1.76,1.91h-1.26l1.17-1.91h1.86Z'/%3e%3cpath%20class='st0'%20d='M84.86,19.75c1.78,0,2.67.94,2.67,2.82v1.48c0,1.87-.89,2.81-2.67,2.81h-.85v4.28h-1.79v-11.39h2.64ZM84.01,21.37v3.86h.85c.58,0,.87-.36.87-1.08v-1.71c0-.71-.29-1.07-.87-1.07h-.85Z'/%3e%3cpath%20class='st0'%20d='M93.51,19.75c1.78,0,2.67.94,2.67,2.82v1.48c0,1.87-.89,2.81-2.67,2.81h-.85v4.28h-1.79v-11.39h2.64ZM92.66,21.37v3.86h.85c.58,0,.87-.36.87-1.08v-1.71c0-.71-.29-1.07-.87-1.07h-.85Z'/%3e%3cpath%20class='st0'%20d='M98.8,31.14h-1.79v-11.39h1.79v4.88h2.03v-4.88h1.83v11.39h-1.83v-4.88h-2.03v4.88Z'/%3e%3cpath%20class='st0'%20d='M105.36,24.55h2.46v1.62h-2.46v3.34h3.09v1.63h-4.88v-11.39h4.88v1.63h-3.09v3.18ZM108.17,17.29l-1.76,1.91h-1.26l1.17-1.91h1.86Z'/%3e%3cpath%20class='st0'%20d='M112.2,19.75c1.78,0,2.67.94,2.67,2.82v1.48c0,1.87-.89,2.81-2.67,2.81h-.85v4.28h-1.79v-11.39h2.64ZM111.35,21.37v3.86h.85c.58,0,.87-.36.87-1.08v-1.71c0-.71-.29-1.07-.87-1.07h-.85Z'/%3e%3c/g%3e%3ccircle%20class='st1'%20cx='25'%20cy='25'%20r='20'/%3e%3cpath%20class='st0'%20d='M32.78,19.27c2.92,0,4.43,2.55,5.28,5.33l.71,2.17c.14.38-.33.75-.71.75h-5.61c.19-.33.24-.71.09-1.08l-.75-2.45c-.43-1.32-.99-2.64-1.79-3.77.75-.57,1.65-.94,2.78-.94h0ZM25,18.38c3.25,0,4.9,2.78,5.89,5.89l.76,2.45c.14.42-.33.8-.8.8h-11.69c-.42,0-.94-.38-.8-.8l.75-2.45c.99-3.11,2.64-5.89,5.89-5.89h0ZM25,11.35c1.74,0,3.11,1.37,3.11,3.11s-1.37,3.11-3.11,3.11-3.11-1.41-3.11-3.11,1.41-3.11,3.11-3.11h0ZM17.27,19.27c1.08,0,1.98.38,2.73.94-.8,1.13-1.37,2.45-1.74,3.77l-.8,2.45c-.14.38-.05.75.09,1.08h-5.56c-.42,0-.9-.38-.75-.75l.71-2.17c.9-2.78,2.41-5.33,5.33-5.33h0ZM17.27,12.91c1.51,0,2.78,1.27,2.78,2.83s-1.27,2.83-2.78,2.83-2.83-1.27-2.83-2.83,1.27-2.83,2.83-2.83h0ZM32.78,12.91c1.56,0,2.78,1.27,2.78,2.83s-1.23,2.83-2.78,2.83-2.83-1.27-2.83-2.83,1.27-2.83,2.83-2.83h0ZM27.07,28.56v.09c0,.57-.24,1.08-.61,1.46h0v.05c-.38.33-.9.57-1.46.57s-1.08-.24-1.46-.61h0c-.38-.38-.61-.9-.61-1.46v-.09h1.41v.09c0,.19.05.38.19.47v.05c.09.09.28.19.47.19s.38-.09.47-.19v-.05c.14-.09.24-.28.24-.47t-.05-.09h1.41ZM30.99,28.56v.09c0,1.65-.66,3.16-1.74,4.24-1.08,1.08-2.59,1.79-4.24,1.79s-3.16-.71-4.24-1.79l-.05-.05c-1.04-1.08-1.7-2.55-1.7-4.2v-.09h1.41v.09c0,1.27.47,2.4,1.27,3.25h.05c.85.85,1.98,1.37,3.25,1.37s2.4-.52,3.25-1.37c.85-.8,1.37-1.98,1.37-3.25v-.09h1.37ZM34.99,28.56v.09c0,2.78-1.13,5.28-2.92,7.07-1.79,1.79-4.29,2.92-7.07,2.92s-5.23-1.13-7.07-2.92c-1.79-1.79-2.92-4.29-2.92-7.07v-.09h1.41v.09c0,2.4.94,4.53,2.5,6.08,1.56,1.56,3.72,2.5,6.08,2.5s4.52-.94,6.08-2.5c1.56-1.56,2.5-3.68,2.5-6.08v-.09h1.41Z'/%3e%3c/svg%3e)