
Vietnam Journal
of Agricultural
Sciences
ISSN 2588-1299
VJAS 2020; 3(4): 864-871
https://doi.org/10.31817/vjas.2020.3.4.10
864
Vietnam Journal of Agricultural Sciences
Received: April 17, 2020
Accepted: December 5, 2020
Correspondence to
ntthu@vnua.edu.vn
ORCID
Le Thanh Ha
https://orcid.org/0000-0001-5090-
5491
An Application of Image Processing in
Optical Mark Recognition
Tran Vu Ha1 & Nguyen Thi Thu2
1Faculty of Information Technology, Vietnam National University of Agriculture, Hanoi
131000, Vietnam
2Faculty of Animal Science, Vietnam National University of Agriculture, Hanoi 131000,
Vietnam
Abstract
The Optical Mark Recognition (OMR) is very popular with
universities for the reading of multiple-choice questions. In this
article, we presented a software system for processing surveys at the
Vietnam National University of Agriculture based on digital image
processing. This software was built using MATLAB and easy to use.
The surveys were digitized using a scanner and sent to the software
tool. In this study, we tested more than 170 surveys of nine different
types. The software tool correctly detected all the valid answers. It
was also able to detect all questions with no or multiple marks.
Keywords
Image processing, optical mark recognition, survey
Introduction
Optical mark recognition (OMR) is a form of automated data
processing. Questions with multiple choices are printed on paper.
Respondents then mark their answers using pens. In the next step, the
sheets are scanned and sent to a computer for processing. There are
many applications of OMR including multiple-choice examinations
(for students and pupils) and feedback collection (from customers,
students, and users, etc.). In universities (i.e., Vietnam National
University of Agriculture), collecting feedback from students plays
an important role in evaluating and improving the quality of
education.
Nowadays, many commercial solutions for OMR are available
(e.g., OpScan Series Product from SCANTRON). In common, these
products require a dedicated scanner and answer sheets, which
motivates the finding of cheaper solutions. Hong Duc University
created a software named TickREC for this purpose (Hong-Duc
University, 2014). The Vietnam Forestry University also has its
software solutions (Mai Ha An, 2014). Increasingly more methods
for mark detection have been published. Gaikwad (2015) applied a

Tran Vu Ha & Nguyen Thi Thu (2020)
https://vjas.vnua.edu.vn/
865
template matching algorithm after finding the
region of interest to find the answers marked
(Gaikwad, 2015). Loke et al. (2018)et al.
proposed a method based on pixel counting and
simple thresholding that can be used under a
variety of conditions . Another method by Belag
et al. was developed based on the creation of
template answer sheets and key points detection
algorithms (Belag et al., 2018). Each of these
methods (and corresponding software tools) has
its own advantages and disadvantages. For
example, Belag’s tool used a dedicated sheet for
answers, this sheet also had checkmarks that
helped in case the scanned image was rotated.
This kind of sheet is suitable for tests but is not
good for surveys. In cases of TickREC and the
tool of Mai Ha An (2014), they could process the
sheets that contained both questions and answers
(Mai Ha An, 2014). Because each software
works with a certain type of answer sheet, which
was designed as needed by the authors, it is not
possible to apply these softwares instantly for the
surveys at the Vietnam National University of
Agriculture.
Hence, in this work, we created a software
for processing surveys at the Vietnam National
University of Agriculture. The surveys were
scanned by an ordinary scanner and sent to the
software to process. This software was designed
in such a manner that it was easy to use and no
special training was required. This system was
cost-effective because no dedicated machine or
answer sheets were required.
Materials and Methods
Materials
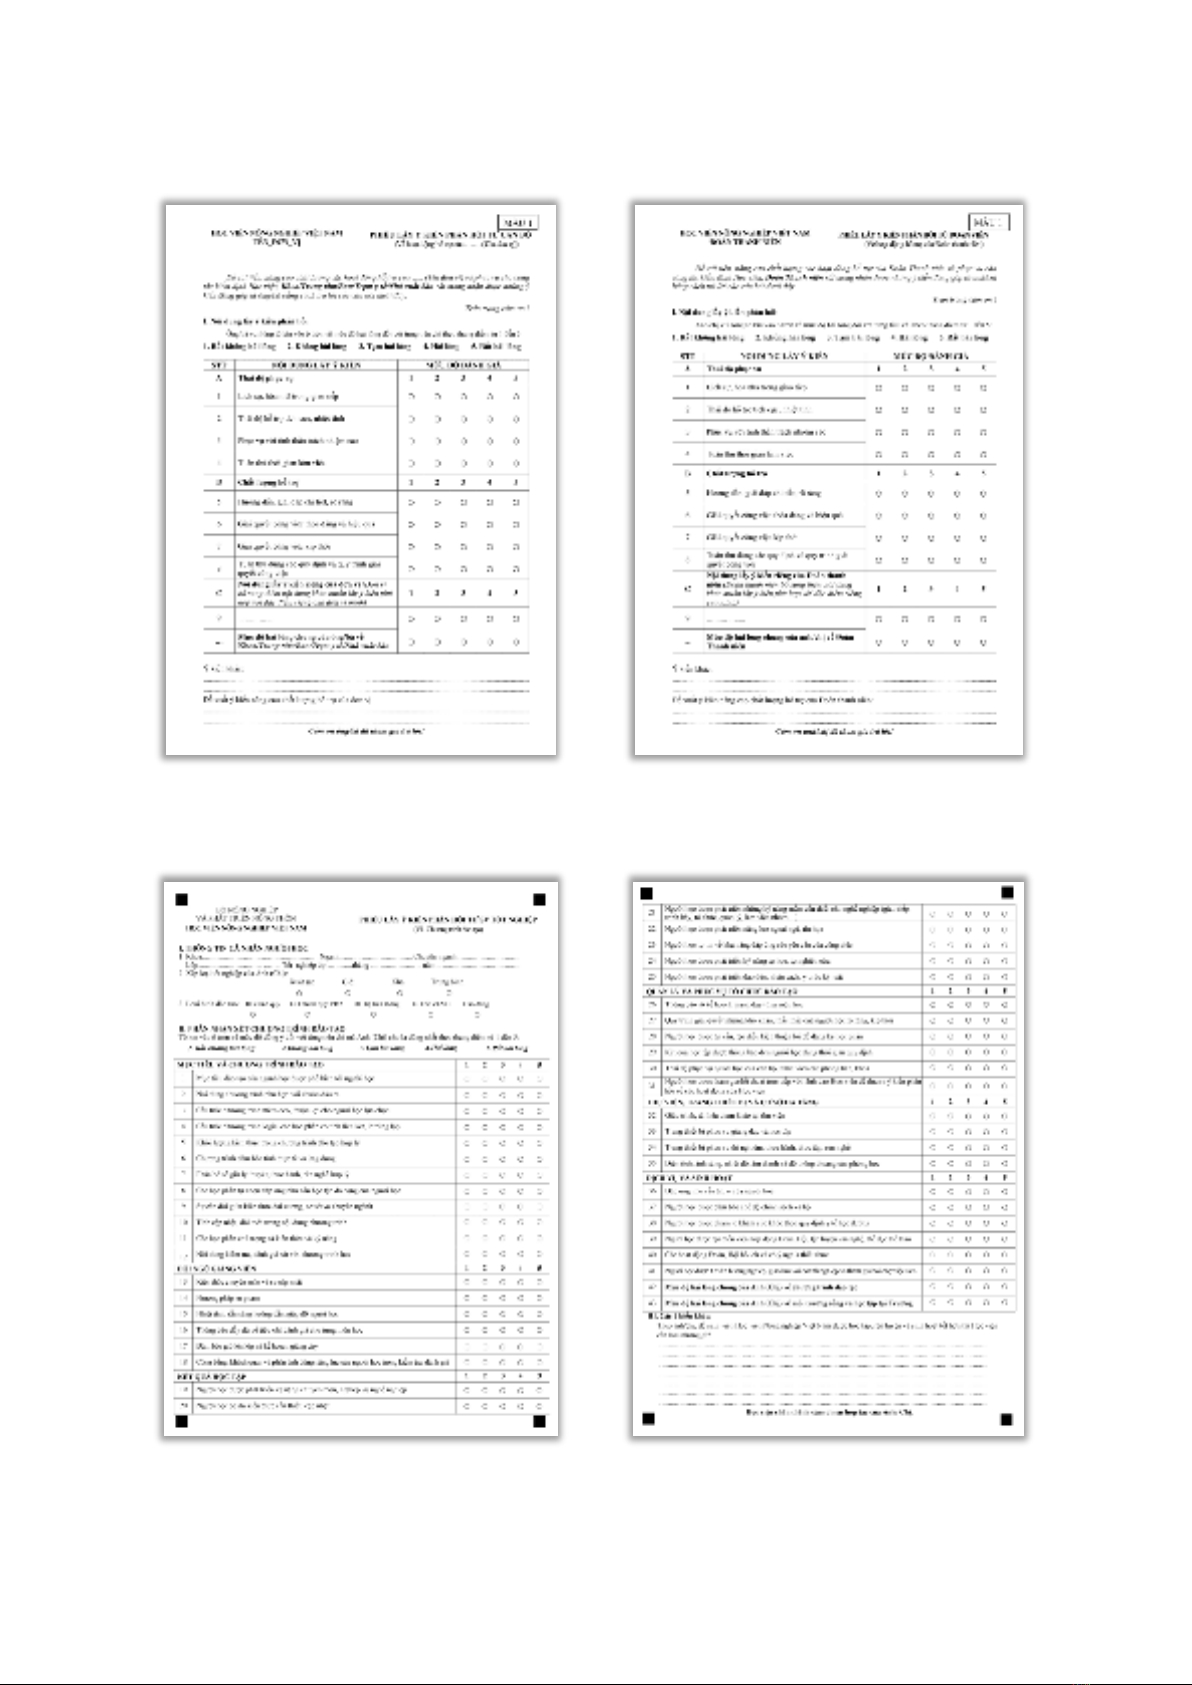
In this project, we used nine different types
of questionnaires. All of these were used by the
Center for Quality Assurance, Vietnam National
University of Agriculture:
(i) Employee feedback about the operation
of a number of divisions
(ii) Member feedback about the support of
the Ho Chi Minh Communist Youth Union
(iii) Student feedback about the support of a
number of divisions
(iv) Student feedback about an advanced
education program
(v) Master student feedback about a specific
course
(vi) Graduate student feedback about an
educational program
(vii) Student feedback about a theoretical
course of an ordinary education program
(viii) Student feedback about a practical
course of an ordinary education program
(ix) Student feedback about a theoretical
course of a Professional Oriented to Higher
Education (POHE) program
For each type of questionnaire, there were
more than 30 sheets that were randomly filled.
All of the sheets were scanned with an HP
scanner (ScanJet Pro 3000 s3). The output file
format was normally JPEG but could also be
PNG, BMP, or some other formats supported by
MATLAB (see method section for more details).
The width and the height of the images were
1655 and 2338 pixels, respectively (these
dimensions of images could be slightly different
depending on the scanner). The examples of
surveys are shown in Figures 1 and 2.
Methods
MATLAB - Environment for software
development
MATLAB (short name for matrix
laboratory) was developed in the 1970s by Cleve
Moler (Haigh, 2008). Most of the codes of
MATLAB was written by Cleve Moler using
FORTRAN. Jack Little and Steve Bangert then
reprogrammed MATLAB in C. Together with
Cleve Moler, three of them founded the
MathWorks in California in 1984. MathWorks
then develops, maintains, and distributes
MATLAB as a commercial product (Sandeep,
2017). Nowadays, MATLAB supports various
platforms such as LINUX, Windows, and
MacOS. With MATLAB, users write a few lines
of code to acquire instant results without
involving a compiler. MATLAB is used for data
analysis and visualization. It supports multiple
types of data (audios, images, videos, CSV, and
An application of image processing in Optical Mark Recognition
866
Vietnam Journal of Agricultural Sciences
(a) A survey for employees
(b) A survey for students
Figure 1. Example of surveys with one page
(a) The first page of a student survey
(b) The second page of a student survey
Figure 2. Example of surveys with two pages
Tran Vu Ha & Nguyen Thi Thu (2020)
https://vjas.vnua.edu.vn/
867
different databases). MATLAB also provides
App Designer tool which allows the users to
different databases). MATLAB also provides
App Designer tool which allows the users to
build GUI (Graphical User Interface) for their
programs (Educba, 2020). For these reasons, we
used MATLAB to develop our software tool for
data processing.
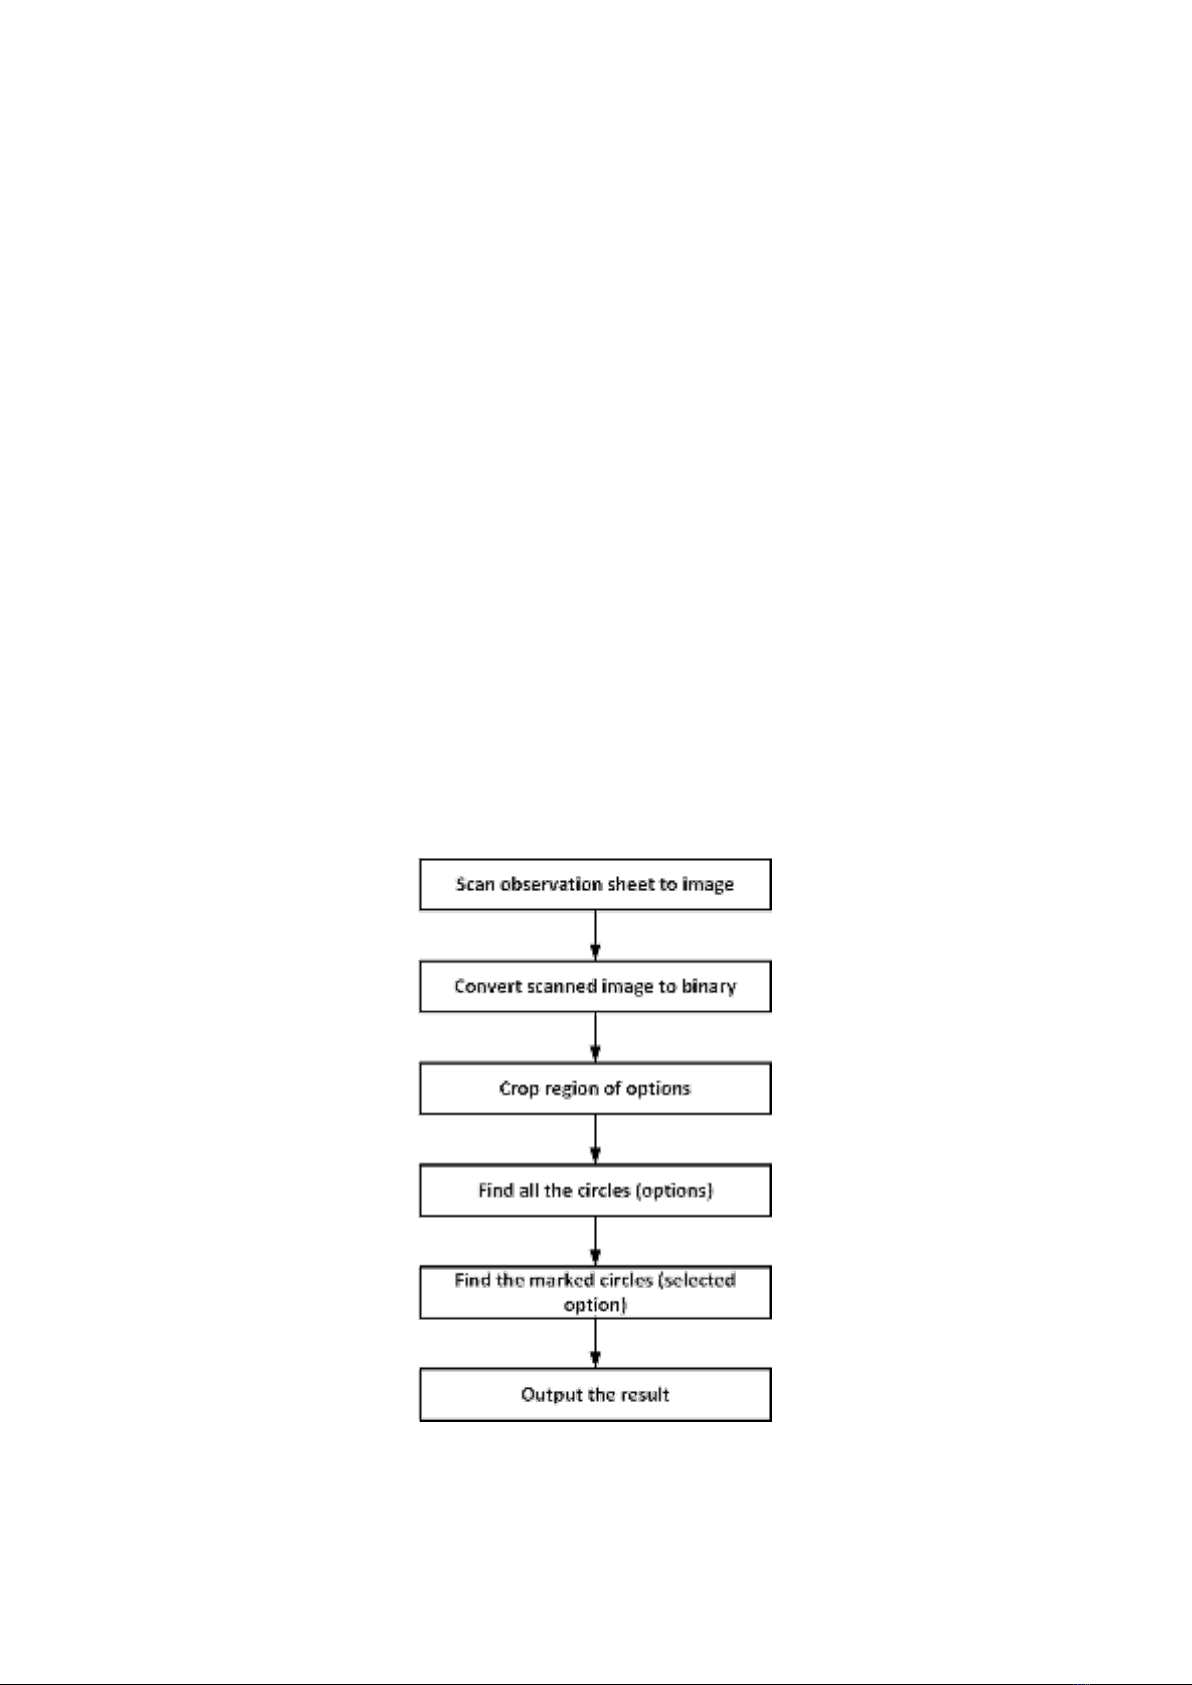
Processing workflow
Figure 3 shows the basic steps needed for
the processing of one scanned page of
questionnaires. For the first step, the selected
machine (ScanJet Pro 3000 s3) scanned multiple
pages in a single run. After that, our software tool
then came into play.
Because our questionnaires were printed in
monochrome and then filled using black or blue
(the colors of most ballpoint pens), converting
images to binary would save us memory and time
for processing. With the support from MATLAB,
converting images to binary was straightforward.
We only needed to call the im2bw function with
the original image as a parameter, the function
then returned a binary image.
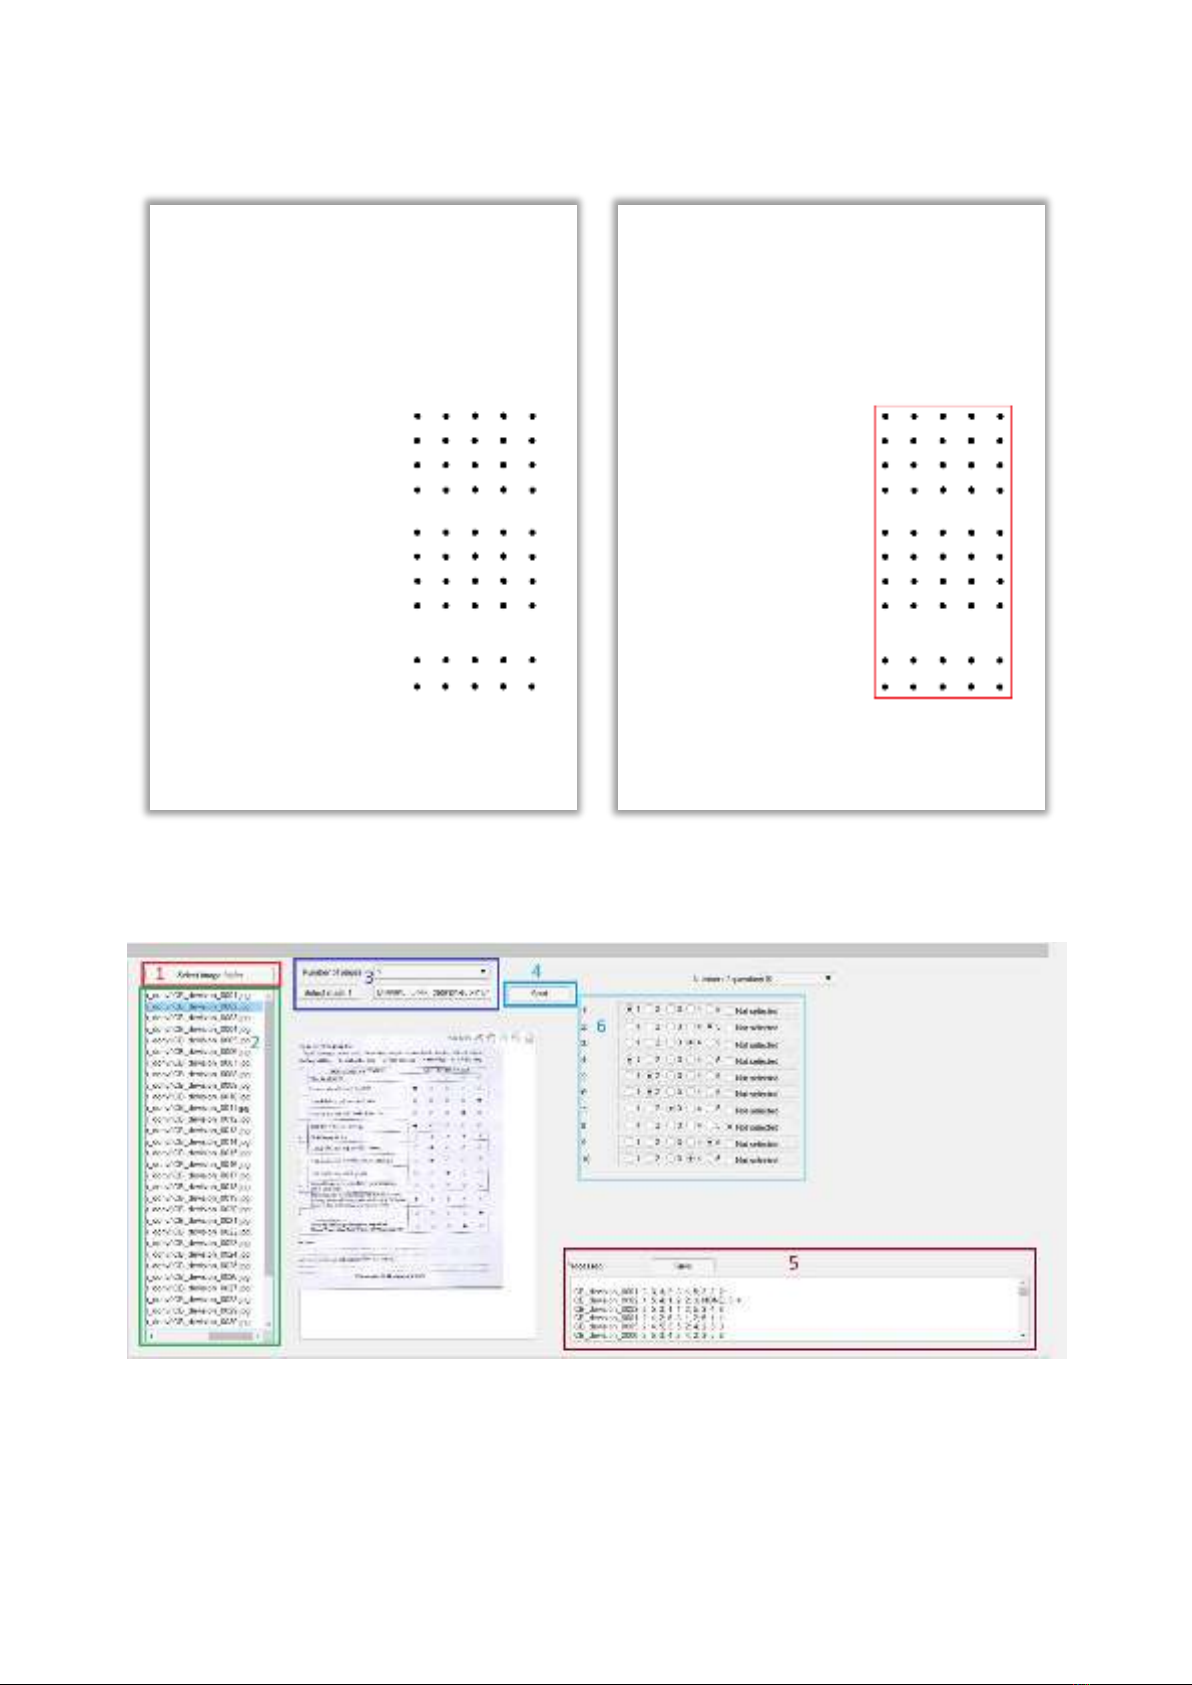
To extract the region of interest (ROI), the
region in which people filled in the options, we
used a special image called a mask. As shown in
Figure 4a, a mask contained only filled options.
Our program would then find the ROI. The
position and size of ROI (the region inside the red
rectangle, Figure 4b) was then used to crop the
other scanned images.
With the function imfindcircles from
MATLAB, we were able to locate all the options
on the cropped images. The number of black
pixels in each circle helped us to indicate the
selected one.
Our software tool then outputted the selected
options for every question on the sheet. The
output was eventually stored in a plain text file.
Results and Discussion
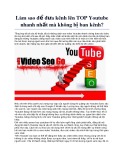
The software tool
Figure 5 shows the main graphical user
interface (GUI) of the program. The user first
needed to specify the directory of scanned
images by clicking Select image folder button
Figure 3. The proposed stages for data processing
An application of image processing in Optical Mark Recognition
868
Vietnam Journal of Agricultural Sciences
(a) An example of mask image
(b) ROI on mask image (the area inside the red rectangle)
Figure 4. Mask image
Figure 5. The main user interface of the program


%20--%3e%3cdefs%3e%3cstyle%3e%20.st0%20{%20fill:%20%23fff;%20}%20.st1%20{%20fill:%20%237800fa;%20}%20%3c/style%3e%3c/defs%3e%3cpath%20class='st1'%20d='M117.78,12.18H43.11c2.9,3.47,4.65,7.94,4.65,12.82,0,5.6-2.3,10.66-6.01,14.29h76.02l7.22-13.56-7.22-13.56Z'/%3e%3cg%3e%3cpath%20class='st0'%20d='M53.58,26.17h-.59v-1.46h.59v-4.96h2.83c1.78,0,2.67.94,2.67,2.82v5.76c0,1.87-.89,2.81-2.67,2.81h-2.83v-4.96ZM55.36,21.37v3.34h1.1v1.46h-1.1v3.34h1.01c.61,0,.91-.37.91-1.1v-5.93c0-.74-.3-1.1-.91-1.1h-1.01Z'/%3e%3cpath%20class='st0'%20d='M65.99,31.14h-1.8l-.31-2.07h-2.19l-.31,2.07h-1.64l1.82-11.39h2.62l1.82,11.39ZM65.28,18.04c-.25.46-.51.77-.75.94-.21.15-.47.22-.79.22-.26,0-.57-.07-.92-.22l-.38-.15c-.14-.05-.26-.07-.37-.07-.3,0-.53.18-.71.54l-.91-.68c.25-.46.51-.77.75-.94.21-.14.48-.21.79-.21.26,0,.57.07.92.21l.38.15c.14.05.26.07.37.07.3,0,.53-.18.71-.54l.91.68ZM61.91,27.52h1.73l-.87-5.76-.87,5.76Z'/%3e%3cpath%20class='st0'%20d='M74.53,26.89v1.52c0,1.91-.89,2.86-2.67,2.86s-2.67-.95-2.67-2.86v-5.93c0-1.91.89-2.86,2.67-2.86s2.67.95,2.67,2.86v1.11h-1.69v-1.22c0-.75-.31-1.12-.93-1.12s-.93.37-.93,1.12v6.15c0,.74.31,1.11.93,1.11s.93-.37.93-1.11v-1.63h1.69Z'/%3e%3cpath%20class='st0'%20d='M81.4,31.14h-1.8l-.31-2.07h-2.19l-.31,2.07h-1.64l1.82-11.39h2.62l1.82,11.39ZM75.9,19.2l1.52-1.91h1.71l1.51,1.91h-1.61l-.76-.95-.75.95h-1.61ZM77.32,27.52h1.73l-.87-5.76-.87,5.76ZM83.1,15.99l-1.76,1.91h-1.26l1.17-1.91h1.86Z'/%3e%3cpath%20class='st0'%20d='M84.86,19.75c1.78,0,2.67.94,2.67,2.82v1.48c0,1.87-.89,2.81-2.67,2.81h-.85v4.28h-1.79v-11.39h2.64ZM84.01,21.37v3.86h.85c.58,0,.87-.36.87-1.08v-1.71c0-.71-.29-1.07-.87-1.07h-.85Z'/%3e%3cpath%20class='st0'%20d='M93.51,19.75c1.78,0,2.67.94,2.67,2.82v1.48c0,1.87-.89,2.81-2.67,2.81h-.85v4.28h-1.79v-11.39h2.64ZM92.66,21.37v3.86h.85c.58,0,.87-.36.87-1.08v-1.71c0-.71-.29-1.07-.87-1.07h-.85Z'/%3e%3cpath%20class='st0'%20d='M98.8,31.14h-1.79v-11.39h1.79v4.88h2.03v-4.88h1.83v11.39h-1.83v-4.88h-2.03v4.88Z'/%3e%3cpath%20class='st0'%20d='M105.36,24.55h2.46v1.62h-2.46v3.34h3.09v1.63h-4.88v-11.39h4.88v1.63h-3.09v3.18ZM108.17,17.29l-1.76,1.91h-1.26l1.17-1.91h1.86Z'/%3e%3cpath%20class='st0'%20d='M112.2,19.75c1.78,0,2.67.94,2.67,2.82v1.48c0,1.87-.89,2.81-2.67,2.81h-.85v4.28h-1.79v-11.39h2.64ZM111.35,21.37v3.86h.85c.58,0,.87-.36.87-1.08v-1.71c0-.71-.29-1.07-.87-1.07h-.85Z'/%3e%3c/g%3e%3ccircle%20class='st1'%20cx='25'%20cy='25'%20r='20'/%3e%3cpath%20class='st0'%20d='M32.78,19.27c2.92,0,4.43,2.55,5.28,5.33l.71,2.17c.14.38-.33.75-.71.75h-5.61c.19-.33.24-.71.09-1.08l-.75-2.45c-.43-1.32-.99-2.64-1.79-3.77.75-.57,1.65-.94,2.78-.94h0ZM25,18.38c3.25,0,4.9,2.78,5.89,5.89l.76,2.45c.14.42-.33.8-.8.8h-11.69c-.42,0-.94-.38-.8-.8l.75-2.45c.99-3.11,2.64-5.89,5.89-5.89h0ZM25,11.35c1.74,0,3.11,1.37,3.11,3.11s-1.37,3.11-3.11,3.11-3.11-1.41-3.11-3.11,1.41-3.11,3.11-3.11h0ZM17.27,19.27c1.08,0,1.98.38,2.73.94-.8,1.13-1.37,2.45-1.74,3.77l-.8,2.45c-.14.38-.05.75.09,1.08h-5.56c-.42,0-.9-.38-.75-.75l.71-2.17c.9-2.78,2.41-5.33,5.33-5.33h0ZM17.27,12.91c1.51,0,2.78,1.27,2.78,2.83s-1.27,2.83-2.78,2.83-2.83-1.27-2.83-2.83,1.27-2.83,2.83-2.83h0ZM32.78,12.91c1.56,0,2.78,1.27,2.78,2.83s-1.23,2.83-2.78,2.83-2.83-1.27-2.83-2.83,1.27-2.83,2.83-2.83h0ZM27.07,28.56v.09c0,.57-.24,1.08-.61,1.46h0v.05c-.38.33-.9.57-1.46.57s-1.08-.24-1.46-.61h0c-.38-.38-.61-.9-.61-1.46v-.09h1.41v.09c0,.19.05.38.19.47v.05c.09.09.28.19.47.19s.38-.09.47-.19v-.05c.14-.09.24-.28.24-.47t-.05-.09h1.41ZM30.99,28.56v.09c0,1.65-.66,3.16-1.74,4.24-1.08,1.08-2.59,1.79-4.24,1.79s-3.16-.71-4.24-1.79l-.05-.05c-1.04-1.08-1.7-2.55-1.7-4.2v-.09h1.41v.09c0,1.27.47,2.4,1.27,3.25h.05c.85.85,1.98,1.37,3.25,1.37s2.4-.52,3.25-1.37c.85-.8,1.37-1.98,1.37-3.25v-.09h1.37ZM34.99,28.56v.09c0,2.78-1.13,5.28-2.92,7.07-1.79,1.79-4.29,2.92-7.07,2.92s-5.23-1.13-7.07-2.92c-1.79-1.79-2.92-4.29-2.92-7.07v-.09h1.41v.09c0,2.4.94,4.53,2.5,6.08,1.56,1.56,3.72,2.5,6.08,2.5s4.52-.94,6.08-2.5c1.56-1.56,2.5-3.68,2.5-6.08v-.09h1.41Z'/%3e%3c/svg%3e)