
REGULAR ARTICLE
Measurements of the effective cumulative fission yields of
143
Nd,
145
Nd,
146
Nd,
148
Nd and
150
Nd for
235
U in the PHENIX
fast reactor
Edwin Privas
1
, Gilles Noguere
1,*
, Jean Tommasi
1
, Cyrille De Saint Jean
1
, Karl-Heinz Schmidt
2
, and Robert Mills
3
1
CEA, DEN Cadarache, 13108 Saint Paul Les Durance, France
2
Centre d’Etudes Nucléaires Bordeaux Gradignan, CNRS/IN2P3, Univ. Bordeaux 1, 33175 Gradignan, France
3
National Nuclear Laboratory, B170 Sellafield Works, Seascale, Cumbria CA20 1PG, UK
Received: 8 March 2016 / Received in final form: 13 June 2016 / Accepted: 20 June 2016
Abstract. The effective Neodymium cumulative fission yields for 235 Uhave been measured in the fast reactor
PHENIX relatively to the 235Ufission cross-section. The data were derived from isotope-ratio measurements
obtained in the frame of the PROFIL-1, PROFIL-2A and PROFIL-2B programs. The interpretations of the
experimental programs were performed with the ERANOS code in association with the Joint Evaluated Fission
and Fusion library JEFF-3.1.1. Final results for 143 Nd,145Nd,146Nd,148Nd and 150 Nd were 5.61%, 3.70%, 2.83%,
1.64% and 0.66%, respectively. The relative uncertainties attached to each of the cumulative fission yields lie
between 2.1% and 2.4%. The main source of uncertainty is due to the fluence scaling procedure (<2%). The
uncertainties on the Neodymium capture cross-sections provide a contribution lower than 1%. The energy
dependence of the fission yields was studied with the GEF code from the thermal energy to 20 MeV. Neutron
spectrum average corrections, deduced from GEF calculations, were applied to our effective fission yields with the
aim of estimating fission yields at 400 keV and 500 keV, as given in the International Evaluated Nuclear Data
Files (JEFF, ENDF/B and JENDL). The neutron spectrum average correction calculated for the PROFIL
results remains lower than 1.5%.
1 Introduction
The present work reports experimental cumulative fission
yields YcðANdÞthat represent the total number of atoms of
ANd produced over all time after one fission of 235Uand
averaged over the fast-neutron spectrum of the PHENIX
reactor. Such experimental results are needed for the
computer simulation of reactors, fuel cycles and waste
management [1,2]. Values and relative uncertainties from
current evaluations of interest for this work are listed in
Table 1. A good knowledge of these quantities enables
estimation of the spent fuel inventories and resultant
quantities such as decay heat, delayed neutron and gamma
ray emissions. They are also important in understanding fuel
performance, such as reactivity loss during reactor operation.
Apart from burnup and safety calculation, the isotope
inventories can be used to characterize a spent fuel. The
percentage burnup of actinide in the fuel can be determined
by analyzing the fission product inventories. One of the
fission yields routinely used for reactor applications is 148Nd.
The burnup of fuel can be estimated using the stable
nuclide 148Nd, which is determined by destructive assay.
The precursors of 148Nd are all short lived and have small
cross-sections and thus the cumulative yield can be used to
determine the number of fissions that has taken place in
the fuel.
Previous interpretations of the PROFIL-1, PROFIL-2A
and PROFIL-2B integral experiments carried out in
the PHENIX reactor (CEA Marcoule, France) with the
ERANOS code [6,7] in association with the evaluated
nuclear data library JEFF-3.0 and JEFF-3.1 showed some
significant discrepancies for the cumulative fission yields of
several Neodymium isotopes for the fast fission of 235U[8,9].
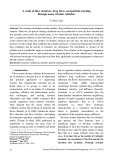
The average calculated-to-experimental ratios C/Eassoci-
ated to the Neodymium produced by fission in several
samples are gathered in Figure 1. Conspicuously, there is a
large drift with respect to the atomic mass number Afrom
A=143toA= 150, far exceeding the claimed experimental
uncertainties on fission yields, which lie in the range between
1% and 2.4%. Such a drift is not observed for the 239Pu and
241Pu samples.
A reanalysis of the PROFIL experiments was performed
with the ERANOS code by using the nuclear data of
the JEFF-3.1.1 library [5,10]. A similar drift of the average
C/Evalues related to the Nd isotopes measured in the
* e-mail: gilles.noguere@cea.fr
EPJ Nuclear Sci. Technol. 2, 32 (2016)
©E. Privas et al., published by EDP Sciences, 2016
DOI: 10.1051/epjn/2016025
Nuclear
Sciences
& Technologies
Available online at:
http://www.epj-n.org
This is an Open Access article distributed under the terms of the Creative Commons Attribution License (http://creativecommons.org/licenses/by/4.0),
which permits unrestricted use, distribution, and reproduction in any medium, provided the original work is properly cited.

235Usamples was observed. This result confirms that the fast
cumulative fission yields of the Nd isotopes recommended in
the JEFF-3.1.1 library need to be revised with improved
experimental values. The present work details how experi-
mental fission yields with realistic uncertainties can be
extracted from the integral trends provided by the PROFIL
experiments. The originality of our data reduction and
uncertainty analysis relies on the use of the Generalized
Perturbation Theory [11], implemented in the ERANOS
code, and of sensitivity coefficients calculated by direct
perturbations of the nuclear data and experimental correc-
tion parameters.
The effective cumulative fission yields, given for the
PHENIX neutron spectrum, were derived from the C/E
values with an uncertainty lying between 2.1% and 2.4%.
Special care was taken in evaluating the uncertainties related
to the use of a new ERANOS calculation scheme in
association with an improved fluence scaling procedure,
needed to normalize the experimental results to the 235U
fission cross-section. Biases caused by the Neodymium
neutron capture reactions during irradiation were studied
and quantified by direct perturbations of the capture cross-
sections of the 143Nd,145Nd,146Nd,148Nd and 150Nd
isotopes. Additional calculations performed with the GEF
code [12,13] allowed accounting for the systematic behavior
of the fission yields with the incident neutron energy. Final
results are compared with experimental data reported in the
literature and with evaluated data given at 400 keV or
500 keV in the JENDL, ENDF/B and JEFF nuclear data
libraries.
2Definition of the effective cumulative
fission yields
Afission product is defined symbolically by the notation
(A,Z,I) where Aand Zare respectively the mass number
and the atomic number, and Iindicates the isomeric state.
The ground state is denoted by I= 0 and I=1, 2, . . .
represents the 1st, 2nd, . . . isomeric states. If a fission
product has no isomers, or if one is referring to the sum of
yields of all its isomers, the notation (A,Z) is used. Using
this terminology, we can distinguish the independent and
cumulative fission yields. For a given incident neutron
energy E, the independent fission yield Y
post
(A,Z,I,E)is
the number of atoms of a specific nuclide produced directly
per 100 fission reactions, after prompt neutrons evaporation
but before any radioactive decay. To take into account
radioactive decay, cumulative fission yield Y
c
(A,Z,I,E)is
used. It represents the number of atoms of a specific nuclide
produced directly and via decay of precursors per 100 fission
reactions. The cumulative fission yields can be defined by
the expression [14]:
YcðAi;Zi;Ii;EÞ¼YpostðAi;Zi;Ii;EÞ
þX
N
j¼0
YcðAj;Zj;Ij;EÞbjiðEÞ;ð1Þ
where Nis the dimension of the whole fission fragment
inventory, iindicates a generic triplet (A
i
,Z
i
,I
i
) and b
ji
(E)
is the branching ratio, which gives the probability that an
isomer (A
j
,Z
j
,I
j
) decays into (A
i
,Z
i
,I
i
).
In the present work, we report effective cumulative
fission yields Ycmeasured in 235Usamples, which have been
irradiated in the fast reactor PHENIX. They can be
obtained from:
YcðA;Z;IÞ¼∫Emax
0YcðA;Z;I;EÞsfðEÞ’ðEÞdE
∫Emax
0sfðEÞ’ðEÞdE ;ð2Þ
Table 1. Cumulative fission yields and relative uncertainties of 143Nd,145Nd,146Nd,148Nd and 150 Nd for the fission of
235Uin the fast-energy range recommended in the evaluated nuclear data libraries ENDF/B [3], JENDL [4] and JEFF [5].
Neodymium isotopes ENDF/B-V11.1
500 keV
JEFF-3.1.1
400 keV
JENDL-4.0
500 keV
143Nd 0.05731 (0.5%) 0.05533 (1.0%) 0.05722 (0.5%)
145Nd 0.03776 (0.5%) 0.03797 (1.8%) 0.03768 (0.5%)
146Nd 0.02921 (0.5%) 0.02927 (1.8%) 0.02917 (0.5%)
148Nd 0.01683 (0.5%) 0.01697 (1.2%) 0.01680 (0.6%)
150Nd 0.00686 (0.5%) 0.00702 (2.4%) 0.00685 (0.5%)
Fig. 1. Average C/Eratios for the prediction of the Neodymium
buildup in the PROFIL-1 and PROFIL-2 programs for 235U,239Pu
and 241Pu obtained with the ERANOS code and the JEFF-3.1
library [9].
2 E. Privas et al.: EPJ Nuclear Sci. Technol. 2, 32 (2016)

in which s
f
(E) is the 235Ufission cross-section and ’(E)
stands for the fast-neutron spectrum representative of the
PROFIL experiment. The maximum energy E
max
is set to
20 MeV.
As stable Neodymium isotopes (Z= 60) in the ground
state deformation (I= 0) are considered in this work, the
notation Y
c
(A,Z,I,E)andYcðA;Z;IÞwill be replaced
throughout the document by the explicit notation
YcðANd;EÞand YcðANdÞ.
3 Description of the PROFIL-1
and PROFIL-2 programs
The PROFIL programs were carried out in the fast reactor
PHENIX (CEA Marcoule, France) from 1974 to 1980. They
are mainly used to provide nuclear data feedbacks on
neutron cross-sections ((n,g), (n,2n), (n,f)) of several fission
products and actinides. A detailed study of the integral
results related to the cumulated fission yields of 143Nd,
145Nd,146Nd,148Nd and 150Nd for 235Uwere never reported.
The principle of the experimental setup is briefly described
below. More information can be found in previous
papers [8,9].
3.1 Principle of the experiments
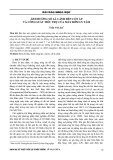
The PROFIL experiments were designed to study the fast
energy range of the neutron cross-sections, called
“continuum”in Figure 2. In the same figure, the 235U
capture and fission cross-sections are compared to the
fast-neutron spectrum calculated by using the ECCO
lattice code of the ERANOS system [6,7] with 1968
energy groups and a critical buckling. Fission yields for
the main actinides such as 235U,238U,238Pu,239Pu,240Pu,
241Pu,242Pu and 241Am are also available. Only results
obtained for the fission of 235Uare presented in this
paper.
The principle of the experiments consists of irradiating
samples containing a small amount of pure isotope in a fast-
neutron flux. The two experiments were carried out four
decades ago during the first cycles of the 250 MWe sodium-
cooled fast reactor PHENIX (CEA Marcoule, France). A
simplified radial view of the core is presented in Figure 3.
The first phase (PROFIL-1) was composed of a single
experimental pin loaded in a standard PHENIX assembly
placed at the center of the core. The pin contained 46
separate samples. The second phase (PROFIL-2A and
PROFIL-2B) was a more ambitious program with two
experimental pins, labelled A and B, placed in the inner
core of PHENIX. Each pin contained 42 separate samples.
Figure 3 also shows the pin location in their respective
fuel subassemblies. A total of 130 samples were irra-
diated during four cycles for PROFIL-1 and PROFIL-2
(>10 months).
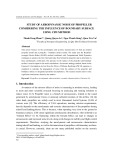
Samples loaded in the PROFIL pins were cylindrical
containers with an outer diameter of 5.5 mm and a height of
8 mm. An example of a stainless steel double container is
shown in Figure 3. For 235U, a total of 6 and 7 regularly
spaced samples were loaded in the PROFIL-1 and in each
PROFIL-2 pins, respectively. As shown in the axial layout
of the PROFIL-1 pin (Fig. 4), the location of the 235 U
samples was chosen to provide accurate information for
fluence scaling issue. We were able to use the experimental
results of the 6 samples loaded in the PROFIL-1 pin, while
only 3 samples (of the 7 samples) were analyzed in each
PROFIL-2 pins. In total, up to 12 integral trends were
collected for determining the cumulative fission yield of
148Nd and 9 integral trends for the other Neodymium
isotopes.
10−2 10−1 100101102103104105106107
Ener
g
y (eV)
10−3
10−2
10−1
100
101
102
103
104
105
U−235 cross section (barns)
Resolved Resonance Range
(n,f)
"Continuum"
(n,γ)
Fig. 2. 235Ucapture and fission cross-sections available in the JEFF-3.1.1 library compared to a neutron spectrum, in arbitrary unit,
representative of the PROFIL experiment (red histogram).
E. Privas et al.: EPJ Nuclear Sci. Technol. 2, 32 (2016) 3

3.2 Isotope-ratio measurements
The experimental results used for the interpretation of the
PROFIL experiments are the isotopic composition of the
samples before and after the irradiation period. As
indicated in Section 3.1, the time interval dtis of the order
of 10 months. The variation, or equivalently the buildup, of
the number of atoms provides integral information on the
capture, fission and (n,2n) cross-sections.
We focus the present work on the isotopic composition
of the 235Usamples before and after the irradiation
time dt. At the beginning of the experiment, the 235U
samples are uranium oxide samples composed of 235U
(≃90%), 234U(≃1%) and 236U(>0.5%). After the
irradiation period, we observe a decrease of ≃20% of
the 235Ucontent.
The determination of the sample composition was
achieved by Inductively Coupled Plasma Mass Spectrome-
try (ICPMS) [15]. For each sample k, mass spectrometry
measurements supplied high precision isotopic ratios
ðNk
i=Nk
jÞwhose relative uncertainties range from 0.1% to
0.2%. The variations DðNk
i=Nk
jÞbetween t
0
and t
0
+dt
define the following experimental quantities:
Ek
ijðdtÞ¼DNk
i
Nk
j
!
¼Nk
iðt0þdtÞ
Nk
jðt0þdtÞNk
iðt0Þ
Nk
jðt0Þ:ð3Þ
Experimentally, the isotopic variations DðNk
143Nd =
Nk
148Nd Þ,DðNk
145Nd =Nk
148Nd Þ,DðNk
146Nd =Nk
148Nd Þand
DðNk
150Nd =Nk
148Nd Þhave to be combined with the
ratio DðNk
148Nd =Nk
235UÞin order to deduce the isotopic
variations of interest DðNk
143Nd =Nk
235UÞ,DðNk
145Nd =Nk
235UÞ,
DðNk
146Nd =Nk
235UÞand DðNk
150Nd =Nk
235UÞ. The corresponding
values calculated with the ERANOS code are denoted by
Ck
ijðdtÞ. Throughout the document, the C/Eratios have
the generic form:
C=E≡Ck
ijðdtÞ=Ek
ijðdtÞ:ð4Þ
In references [8,9], the quantities Ek
ijðdtÞare assumed
to be normally distributed and independent. As a
consequence, the weighted average over the samples k
of the calculated-to-experimental ratios, formally defined
as:
⟨C=E⟩≡⟨Ck
ijðdtÞ=Ek
ijðdtÞ⟩;ð5Þ
are characterized by unrealistic small relative uncertainties.
In practice, correlations between the uncertainties of the
different ICPMS results were not provided by the
experimentalists. Mathematical solutions to calculate
appropriate uncertainties were discussed in reference [16]
in which the experimental uncertainty on each isotopic
Radial core geometry of PHENIX
Fuel assembly containing
PROFIL-2A and PROFIL-2B pins
Axial layout
of the PROFIL-1 pin
Stainless steel
double container
(dimensions are in mm)
Fuel assembly containing
PROFIL-1 pin
Fig. 3. Radial core geometry of the fast reactor PHENIX, location of the subassemblies containing the PROFIL pins, axial layout of the
PROFIL-1 pin and example of a stainless steel double container designed for the PROFIL irradiation.
4 E. Privas et al.: EPJ Nuclear Sci. Technol. 2, 32 (2016)

ratio is treated as a “statistical”contribution while the
“systematic”part is driven by two fluence scaling
parameters.
3.3 Fluence scaling issue
The interpretation of the PROFIL experiments is
performed with the deterministic code ERANOS [6,7].
The calculation scheme relies on several hypotheses that
are used to obtain a mean neutron flux over the irradiation
period dt. The dispersion of the C/Eratios, observed for
the 235Usamples, suggests that such a raw treatment
overestimates the magnitude of the global fluence. The
origins of the observed dispersions could be due to the
approximations used in the calculation scheme but also to
the influence of the surrounding materials, such as the
steel containers, that could locally change the neutron
spectrum. The strategy for solving the inconsistency
between the calculations and the experimental results
consists in normalizing the results utilizing the 235Ufission
cross-section. For that purpose, two free parameters were
introduced in the ERANOS calculations. The first
parameter was introduced to shift the axial shape of the
flux and the second parameter was introduced to normalize
the global fluence level. Optimal parameter values are
determined by using as reference the following fission
indicator:
Ek
ð235Uþ236UÞ238UðdtÞ¼DNk
235UþNk
236U
Nk
238U
!
;ð6Þ
so that the related calculated-to-experimental ratios satisfy
the following constraint:
Ck
ð235Uþ236UÞ238UðdtÞ
Ek
ð235Uþ236UÞ238UðdtÞ¼1:ð7Þ
For example, in the case of the PROFIL-2A configura-
tion, the sensitivity of this experimental ratio to the 235U
fission cross-section is close to unity (1.07), whereas the
sensitivity is relatively small to the 238Ucapture cross-
section (0.14) and negligible to the 235;236Ucapture cross-
sections (0.04 and 0.01, respectively). The 235Ufission
cross-section is one of the major reactions investigated
within the “neutron cross-section standards”group
of the International Atomic Energy Agency (IAEA) [17].
This cross-section is considered as a standard at
thermal energy (25.3 meV) and from 0.15 MeV to
c
235U Sample 1-10
235U Sample 1-19
235U Sample 1-28
235U Sample 1-37
235U Sample 1-46
235U Sample 1-1
Fig. 4. Axial layout of the PROFIL-1 pin with the position of the 235 Usamples used in this work. The sample number 19 is located at
z= 0 mm, which corresponds to the core midplane of the PHENIX reactor.
E. Privas et al.: EPJ Nuclear Sci. Technol. 2, 32 (2016) 5


![Đề ôn tập cuối kỳ môn Kỹ thuật nhiệt - Nhiệt động học [mới nhất]](https://cdn.tailieu.vn/images/document/thumbnail/2026/20260310/hoaphuong0906/135x160/60681773197823.jpg)

