JST: Engineering and Technology for Sustainable Development
Volume 35, Issue 1, March 2025, 051-058
51
Analytical Methods for Determination of Total Nitrogen Content
in the Process of Synthesizing Chemically Modified Rubber Materials
Than Van Hau, Vu Tue Minh, Dinh Duy Nham, Tran Huy Trong,
Tran Quang Tung, Tran Thi Thuy*
Hanoi University of Science and Technology, Ha Noi, Vietnam
*Corresponding author email: thuy.tranthi3@hust.edu.vn
Abstract
In the study, the total nitrogen content of natural rubber was determined to evaluate the effectiveness of
deproteinization on the synthesis of chemically modified rubber materials. The remaining protein content in
the obtained deproteinized natural rubber (DPNR) was analyzed as nitrogen content using the Kjeldahl
method. In this method, the amine nitrogen present in the proteins was converted into ammonia, which was
subsequently determined by chemical and physical methods. From the findings obtained from the examination
of experimental conditions, a novel procedure was devised to determine the total nitrogen content in rubber
using traditional titration, potential titration and UV-Vis spectrophotometry methods. The newly established
techniques exhibited favorable results regarding the method detection limit (MDL) and limit of quantification
(LOQ). Among these methods, spectrophotometry displayed exceptional sensitivity, enabling precise and
accurate quantification of low nitrogen concentrations. Notably, these methods exhibit a high degree of
recovery, ranging from 94.5% to 106.3%.
Keywords: Nitrogen content, deproteinized natural rubber, Kjeldahl method.
1. Introduction1
In the study of synthesizing chemically modified
rubber materials from natural rubber (NR), the general
process includes the removal of proteins from NR,
subsequent grafting polymerization with monomers,
and coprecipitation of modified deproteinized natural
rubber (DPNR) with appropriate fillers [1, 2].
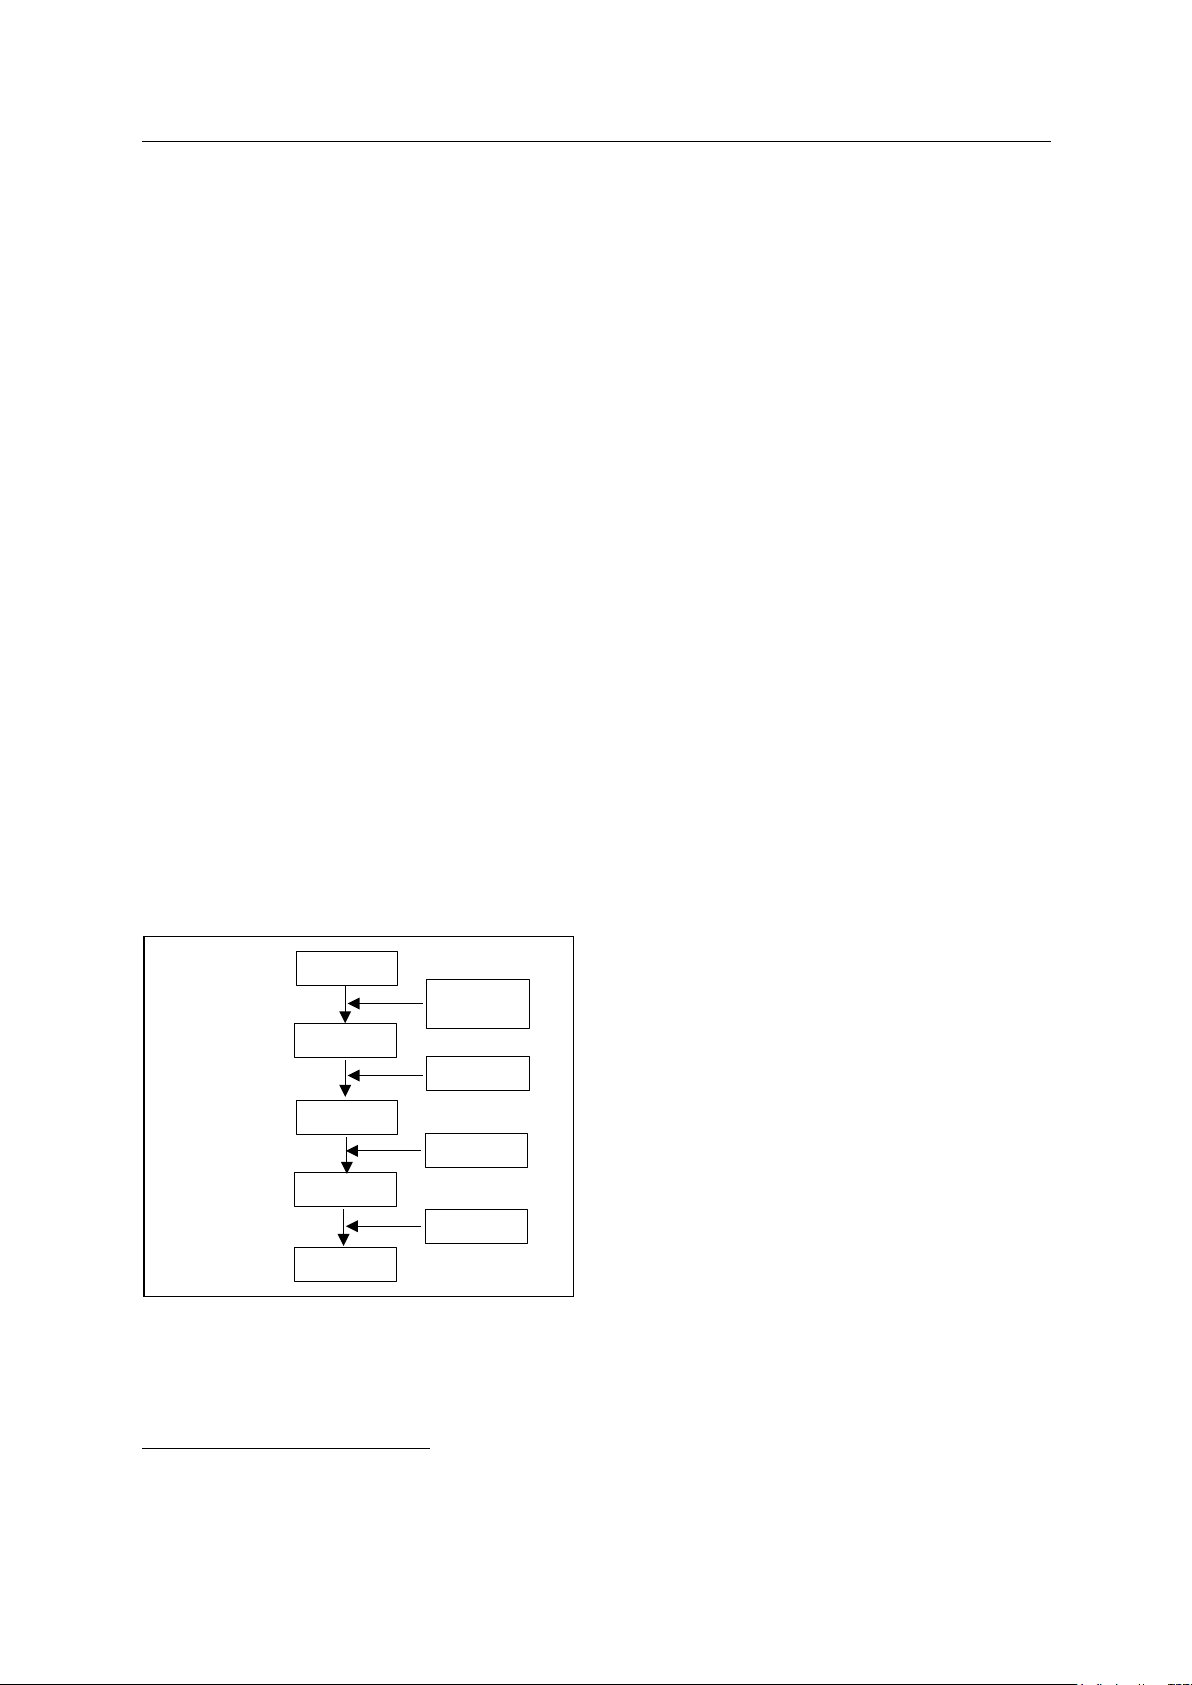
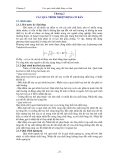
Fig. 1. Procedure of protein removal from NR
Protein removal is accomplished by removing the
protein layer covering the rubber particles [3, 4]. After
the rubber is deproteinized, grafting polymerization
with monomers will be more effective. Examining the
ISSN 2734-9381
https://doi.org/10.51316/jst.180.etsd.2025.35.1.7
Received: Aug 5, 2024; revised: Sep 30, 2024;
accepted: Oct 3, 2024
effectiveness of removing protein from rubber will be
done by evaluating the total nitrogen content of the
product after protein removal, which is called protein
nitrogen content. The depletion of nitrogen content in
the sample is directly correlated with the effectiveness
of protein separation. As protein separation improves,
the nitrogen content in the sample decreases
accordingly.
The Kjeldahl nitrogen analysis method is the
global standard for calculating protein content in a
variety of sample materials. However, the application
of this method in the synthesis of chemically modified
natural rubber has not yet been scientifically and
specifically evaluated with a focus on the analysis of
nitrogen content. The determination of total nitrogen
content through the Kjeldahl digestion process
includes decomposing the sample into ammonia
(NH3). The NH3 is subsequently distilled and then
measured by photometry or titration techniques [5-9].
Total Kjeldahl nitrogen is the sum of organic
nitrogen compounds and free ammonia converted into
ammonium sulfate, under decomposition conditions.
The rubber latex sample for total nitrogen analysis
from the process of deproteinization is heated in the
presence of concentrated sulfuric acid, catalyzed and
evaporated until SO3 fume is obtained and the solution
becomes colorless or pale yellow [10-13]:
HANR
DPNR 1st
1% SDS
+ 0,1%
U
DPNR 2nd
0,5% SDS
DPNR 3rd
DPNR 3rd
1st centrifugation
2nd centrifugation
3rd centrifugation
0,5% SDS
1% SDS

JST: Engineering and Technology for Sustainable Development
Volume 35, Issue 1, March 2025, 051-058
52
Protein + H2SO4 → (NH4)2SO4 + CO2 + SO3 + H2O (1)
During the deproteinization process, when
concentrated sulfuric acid is utilized, the temperature
can rise to around 330 °C. The addition of salts such as
K2SO4 can increase the solution temperature of the
decomposition mixture to 390 °C or higher, depending
on the ratio of salt and acid [10-13].
After the digestion process is completed, the
mixture is added with excess base (NaOH) to convert
NH4+ into NH3:
(NH4)2SO4 + 2NaOH → Na2SO4 + 2H2O + 2NH3 (2)
NH3 is obtained by distillation, where it is
converted into a volatile gas through the elevation of
the temperature to the boiling point. The distillate
vapor containing NH3 is subsequently trapped in a
solution of boric acid, sulfuric acid, or hydrochloric
acid depending on the selection of different
ammonium concentration measurement methods
[10-13].
H+ + NH3 → NH4+ (3)
1.1. Traditional Titration Method
Protein nitrogen content is measured by titration
of ammonium borate solution with standard solutions
of sulfuric acid or hydrochloric acid, using appropriate
indicators to determine the end point of the reaction
[10-12].
H3BO3+ NH3 → NH4+ + H2BO3- (4)
H2BO3- + H+ → H3BO3 (5)
The concentration of H+ ions (mol) required to
reach the titration endpoint is equivalent to the initially
present nitrogen concentration, see (4), (5). The
formula for determining the percentage of protein
nitrogen in a rubber latex sample m (g) using HCl acid
solution C (mol/l) for titration [10-13] is:
%𝑁𝑁=𝐶𝐶.(𝑉𝑉
𝑠𝑠−𝑉𝑉𝑏𝑏)
1000.𝑚𝑚×14 ×100% (6)
where C (mol/L) is the molar concentration of HCl
solution, Vs and Vb (mL) are the volumes of acid
solution used to titrate the sample and blank sample,
respectively, m (g) is the mass of the decomposed
sample and 14 is the equivalent weight of nitrogen. A
blank sample, which contains a solution of boric acid
and indicator, is often run at the same time as the
analytical samples to evaluate the possible nitrogen
content of the reagent used. Once the nitrogen content
has been determined, it is converted to protein content
using the appropriate conversion factor.
1.2. Potential Titration Method
Potentiometric titration is similar to traditional
titration but does not rely on chemical indicators. In
this method, the potential difference between two
electrodes is used to determine the equivalence point
of the titration reaction. An indicator electrode, which
is immersed in the sample solution, is connected to a
reference electrode by a salt bridge containing an inert
electrolyte such as potassium chloride, forming an
electrochemical cell. The potential of the reference
electrode is constant while the potential of the
indicator electrode changes depending on the ions
present in the sample solution. The variation in cell
potential is monitored during the addition of the titrant
and is subsequently plotted as a function of the added
volume. Since the potential is dependent on the
concentrations of the analyte and titrant in the solution,
the plot can be used to determine the equivalence
point, found at the steepest section of the
potentiometric titration curve [14].
1.3. Spectrophotometric Method
The concentration of NH3 ions in the distillate
can be determined by UV-Vis spectrophotometric
method based on the complex chemical reaction with
inorganic reagents (Nessler) or organic reagents
(indo-blue) and ammonia ions in an alkaline medium.
The Nessler method, historically utilized for ammonia
determination, is now less commonly employed and
has been substituted by other methods that offer
reduced interference. In the Nessler method, K2HgI4 is
used as the indicator, which, if not carefully controlled,
can have adverse environmental implications due to
the potential release of mercury [15].
In this study, we use a spectroscopic device to
determine NH3 ions according to the salicylate
method. Spectrophotometric measurement at 655 nm
involves the analysis of the blue compound formed by
the reaction of ammonium with salicylate and
hypochlorite ions. This reaction takes place in the
presence of sodium nitrosopentaxyano iron (III)
taxyano iron (nitroprusside). Hypochlorite ions are
generated in situ by alkaline hydrolysis of N,
N‘-dichloro-1,3,5-triazine-2,4,6 (1H,3H,5H)-trione,
and sodium salt (sodium dichloro isocyanurate). The
reaction of cioramine chloramine with sodium
salicylate occurs at pH 12.6 with the participation of
sodium nitroprusside. Any chloramine present in the
sample is also determined. [15].
The distillate should be captured in 1 %V/V HCl
instead of boric acid/indicator. The formula to
determine the protein nitrogen percentage of rubber
latex sample m (g) is as follows:
%𝑁𝑁=(𝐶𝐶𝑠𝑠𝑉𝑉
𝑠𝑠−𝐶𝐶𝑏𝑏𝑉𝑉𝑏𝑏)
106.𝑚𝑚.100% (7)
where Vs and Vb (mL) are the volumes of the test
sample and blank sample respectively after distillation,
Cs and Cb (mg/L) are the measured concentrations of
the test sample and blank sample after distillation,
m (g) is the mass of the rubber latex sample. To
evaluate the potential nitrogen content of the reagent
used, a blank sample containing boric acid is often
analyzed concurrently with the analytical samples.

JST: Engineering and Technology for Sustainable Development
Volume 35, Issue 1, March 2025, 051-058
53
The percentage of nitrogen content of dry rubber
is calculated after calculating the dry coefficient
content of the rubber.
1.4. Determination of Method Detection Limit and
Limit of Quantification
The method detection limit (MDL) is defined as
the minimum concentration of a substance that can be
measured and reported with 99% confidence that the
analyte concentration is greater than zero and is
determined from analysis of a sample in a given matrix
containing the analyte. In this study, the MDL was
calculated based on the analysis of 10 replicates of real
samples [16].
The formula to determine MDL is as follows:
MDL = t(n-1, 1-α=0,99)Ss (8)
Where t(n-1, 1-α=0.99) is the Student’s t-value
appropriate for a single-tailed 99th percentile t statistic
and a standard deviation estimate with n-1 degrees of
freedom and Ss is the sample standard deviation of the
replicate sample analyses.
Table 1. Single-Tailed 99th Percentile t-Statistic
Number of
replicates
Degrees of
freedom (n-1)
t(n-1, 0,99)
7 6 3,143
8 7 2,998
9 8 2,896
10 9 2,821
11 10 2,764
16 15 2,602
21 20 2,528
Limit of quantification (LOQ) is the lowest
possible concentration of the analyte that can be
quantified by the method in a reliable way.
The formula for determining LOQ is as follows:
LOQ = 10. Ss (9)
1.5. Determination of Spiked Recovery
Let C stand for concentration. One definition of
spike recovery is
R (%) = 𝐶𝐶𝑠𝑠𝑠𝑠𝑠𝑠𝑠𝑠𝑠𝑠𝑠𝑠 𝑠𝑠𝑠𝑠𝑠𝑠𝑠𝑠𝑠𝑠𝑠𝑠−𝐶𝐶𝑢𝑢𝑢𝑢𝑠𝑠𝑠𝑠𝑠𝑠𝑠𝑠𝑠𝑠𝑠𝑠 𝑠𝑠𝑠𝑠𝑠𝑠𝑠𝑠𝑠𝑠𝑠𝑠
𝐶𝐶𝑠𝑠𝑠𝑠𝑠𝑠𝑠𝑠𝑠𝑠
×100, (%) (10)
The acceptable recovery is specified to be in the
range. This range is established in the laboratory as a
primary backup on the approval method.
A spike of 𝐶𝐶𝑎𝑎𝑎𝑎𝑎𝑎𝑎𝑎𝑎𝑎 was added to a replicate
portion of unknown nitrogen sample
(𝐶𝐶𝑢𝑢𝑢𝑢𝑢𝑢𝑢𝑢𝑢𝑢𝑢𝑢𝑎𝑎𝑎𝑎 𝑢𝑢𝑎𝑎𝑚𝑚𝑢𝑢𝑠𝑠𝑎𝑎 ). Analysis of the spiked sample gave
a concentration of 𝐶𝐶𝑢𝑢𝑢𝑢𝑢𝑢𝑢𝑢𝑎𝑎𝑎𝑎 𝑢𝑢𝑎𝑎𝑚𝑚𝑢𝑢𝑠𝑠𝑎𝑎 .
2. Materials and Methods
2.1. Materials
The experimental materials utilized in this study
consisted of reagents of analytical grade and
ammonium-free distilled water.
HCl 1.18 g/mL, H2SO4 1.84 g/mL and potassium
sulfate were employed as reagents in the study.
Sodium hydroxide (NaOH) was used in the form
of a 32% solution, prepared by dissolving a measured
quantity of NaOH (320 g ± 20 g) in approximately
800 mL of water. The solution was then cooled to room
temperature and diluted to a final volume of 100 mL
using additional water. It was stored in a polyethylene
bottle to maintain its integrity.
Devarda’s alloy, comprising approximately
45% m/m aluminium (Al), 50% m/m copper (Cu), and
5% m/m zinc (Zn), was utilized in powdered form.
Care was taken to procure an alloy with the lowest
possible nitrogen content to ensure accurate results.
A boric acid (H3BO3) solution/indicator was
prepared by dissolving bromocresol blue
(0.10 g ± 0.01 g) and methyl red (0.020 g ± 0.005 g) in
approximately 80 mL of ethanol. The solution was
then diluted to a final volume of 100 mL using ethanol.
Separately, H3BO3 was dissolved in warm water
(20 g ± 1 g) and cooled to room temperature. To this
solution, 10 mL ± 0.5 mL of the indicator solution was
added, followed by dilution to a final volume of 1 liter
using water. The resulting H3BO3 solution/indicator
was employed for subsequent analysis.
A HCl standard solution with a concentration of
c(HCl) = 0.10 mol/L was utilized, either prepared by
mixing HCl solution and standardized through
conventional analytical methods or obtained
commercially.
A color reagent was formulated by dissolving
sodium salicylate (130 g ± 1 g) and trisodium citrate
dihydrate (130 g ± 1 g) in 1000 mL of volumetric
water. The liquid volume was adjusted to
approximately 950 mL by adding water. Subsequently,
sodium nitrosopentaxyano iron(III) dihydrate [sodium
nitroprusside, {Fe(CN)5NO}Na2.2H2O] weighing
0.970 g ± 0.005 g was added to the solution and
dissolved completely. The resulting solution was then
diluted to the final volume with water. The color
reagent was stored in amber glass vials and retained
stability for a minimum of two weeks.
To prepare the sodium dichloroisocyanurate
solution, NaOH (32.0 g ± 0.1 g) was dissolved in
500 mL ± 50 mL of water and allowed to cool

JST: Engineering and Technology for Sustainable Development
Volume 35, Issue 1, March 2025, 051-058
54
to room temperature. Subsequently, sodium
dichloroisocyanurate (2.00 g ± 0.02 g) was added to
the solution and dissolved completely. The entire
solution was transferred to a 1000 mL volumetric flask
and diluted to the mark with water. The sodium
dichloroisocyanurate solution was stored in amber
glass vials, maintaining stability for at least two weeks.
2.2. Methods
2.2.1. Sampling samples
Samples were transferred to polyethylene bottles
and either immediately processed for analysis or stored
at temperatures between 2 °C and 5 °C until analysis.
The digestion process was performed using the
DK6 digestion equipment, which includes a Kjeldahl
digester with 800 mL digestion vessels. For the blank
test, 50 mL of water was taken instead of the sample.
To prepare the sample for analysis, 5 ÷ 10 g of the
sample was placed in a digestion tube. Distilled water
was added to reach a total volume of 50 mL. Next,
4.0 mL ± 0.1 mL of H2SO4, 0.20 g ± 0.01 g of
Devarda’s alloy, and 2.00 g ± 0.05 g of K2SO4 were
added to the digestion tube. After a minimum of
60 minutes, a few grains of pumice were added, and
the contents of the flask were boiled under a fume
hood. The volume gradually decreased due to water
evaporation. When white smoke became visible, the
neck of the Kjeldahl flask was covered with a small
funnel to reduce evaporation. Care was taken not to
boil the contents until completely dry. The temperature
during this period should not exceed 370 °C. Once the
fuming ceased, the decomposed liquid sample turned
colorless or slightly green. The boiling process was
continued for an additional 60 min ± 5 min to ensure
complete digestion [17-18]. After decomposition, the
sample was allowed to cool to room temperature
before proceeding with the analysis using the specified
methods.
In the distillation step, the UDK142 automatic
steam distillation unit was used. For the traditional
titration method, a distillation vessel was filled with
50 mL ± 2 mL of boric acid/indicator solution. For the
potential titration method, only the boric acid solution
was used. It was ensured that the condenser tube's tip
was fully immersed in the indicator solution.
Subsequently, a neutralized sample flask received a
careful addition of 10 mL ± 1 mL of water, followed
by the introduction of 25 mL of 32% NaOH solution.
The flask was immediately connected to the distiller.
The flask was heated to maintain a distillation rate of
approximately 5 mL/min, and the distillation process
was stopped upon collecting about 30 mL of distillate.
If needed, the system could be cleaned using a rinsing
solution after storage.
2.2.2. Determination of nitrogen content by traditional
titration method
In the traditional titration method, the distillate
obtained previously was titrated with HCl (0.02 mol/L)
using the red indicator present in the receiving flask.
The volume of HCl consumed during titration was
recorded. The %N can be calculated using (7).
2.2.3. Determination of nitrogen content by potential
titration method
The potential titration method was implemented
as depicted in Fig. 2. A HCl standard solution
(0.04 mol/L) was prepared and placed in a burette for
titration. An electrode specifically prepared for this
purpose was inserted into the analytical solution, and
the change in mV electrode potential (pH) was
monitored during the titration process. The mV (pH)
electrode potential value at the end of the titration is
recorded. By utilizing this information, the Veq value
can be determined, allowing for the calculation of the
analyte's concentration in the analytical solution.
Fig. 2. Schematic diagram for potential titration
method
2.2.4. Determination of nitrogen content by
spectrophotometric method
To perform the analysis, 50 ml of the digested
sample was taken and mixed with 5.00 ml ± 0.05 ml of
a color reagent. The resulting mixture was thoroughly
shaken. Subsequently, 5.00 ml ± 0.05 ml of a sodium
dichlororoisocyanurate solution was added, and the
mixture was shaken thoroughly once again. The flask
containing the solution was then placed in an
incubator, maintaining a temperature of 25 °C ± 10 °C.
After a minimum of 60 minutes, the flask was removed
from the incubator, and the absorbance of the solution
was measured at a wavelength of 655 nm. The samples
were measured and analyzed using the Agilent Cary
60 spectrophotometer.

JST: Engineering and Technology for Sustainable Development
Volume 35, Issue 1, March 2025, 051-058
55
3. Results and Discussion
3.1. Method Detection Limit and Limit of
Quantification Survey
The results of graphing the standard curve at
5 standard points using the photometric method are
presented in Table 2.
Table 2. Results of building the standard curve
C (mg/L
NH4-N) 0.05 0.1 0.2 0.3 0.4
Absorbance 0.156 0.285 0.560 0.825 1.029
R2 0.9985
The results of building standard curves show that
the standard curves are linear and relatively stable with
good correlation coefficients.
Given the minimal standard deviations observed
across all three methods, it can be affirmed that the
repeatability of these approaches is acceptable. This
characteristic not only underscores the methods'
reliability but also indicates a high level of accuracy,
rendering them well-suited for precise determination
of nitrogen content within the sampled specimens.
The average nitrogen content values exhibit
minimal variation among the different methods, which
are presented in Table 3. Notably, the MDL and LOQ
values, as well as the standard deviation, of the
spectrophotometric method were lower than those of
the corresponding titration methods. Collectively,
these results denote the elevated sensitivity and
precision characteristic of the spectrophotometric
approach.
Table 3. Results from experiments involving the repetition of spiked samples tẹn times to determine MDL and
LOQ values through traditional titration, potential titration, and spectrophotometric methods
Method Acid-base titration Potential titration
Spectrophotometric
method
Result (% N)
0.042 0.043 0.041
0.046 0.041 0.040
0.045 0.043 0.041
0.048 0.044 0.039
0.043 0.044 0.039
0.043 0.044 0.041
0.044 0.045 0.040
0.042 0.044 0.042
0.043 0.040 0.040
0.045 0.040 0.041
Average (% N) 0.0440 0.0429 0.0405
SD 0.0018 0.0017 0.0009
MDL (% N) 0.0051 0.0049 0.0024
LOQ (% N) 0.0180 0.0174 0.0087
![Đề cương môn học Chuyển đổi Nhiệt động lực học [chuẩn nhất]](https://cdn.tailieu.vn/images/document/thumbnail/2020/20200302/covid19/135x160/7991583168321.jpg)


![Đề ôn tập cuối kỳ môn Kỹ thuật nhiệt - Nhiệt động học [mới nhất]](https://cdn.tailieu.vn/images/document/thumbnail/2026/20260310/hoaphuong0906/135x160/60681773197823.jpg)

![Bài giảng thang máy và thang cuốn: Tổng hợp kiến thức [chuẩn nhất]](https://cdn.tailieu.vn/images/document/thumbnail/2026/20260310/hoaphuong0906/135x160/41471773283876.jpg)
