380
JOURNAL OF SCIENCE AND TECHNOLOGY DONG NAI TECHNOLOGY UNIVERSITY
Special Issue
RESEARCH TO OPTIMIZE PRODUCT SHAPE USING AUTODESK INVENTOR PRO SOFTWARE
Nguyen Nhat Duy*
Dong Nai Technology University *Corresponding author: Nguyen Nhat Duy, nguyennhatduy@dntu.edu.vn GENERAL INFORMATION ABSTRACT
Received date: 16/03/2024
Revised date: 11/05/2024
Accepted date: 26/07/2024
KEYWORD
FEM;
Stress analysis;
inventor software;
Shape optimization;
Reducing the weight of aesthetically pleasing machine parts is one of the biggest trends today. Applications and variations of the part are determined using the Finite Element Method (FEM). Shape optimization is a method by which lighter details can be obtained while preserving the safety and durability of components. This article deals with optimizing the shape of a bearing plate commonly found in mechanical engineering. The verification of the suitability of the newly optimized model will be done on the basis of a static simulation of the shape using Inventor Pro 2023 software. Optimum results in lighter weight detail, higher aesthetics while ensuring durability. This optimization ensures novelty because it has only been integrated into inventors recently and continues to be developed.
1. INTRODUCTION
position, size, and hollow positions in the shape (X-duan, 2002).
Shape optimization is one of the design methods that has evolved rapidly in recent decades. The main goal of shape optimization is to find the optimal material layout on a specific design domain with given edge conditions.
The main goal of shape optimization is to find the optimal layout of a shape in a defined area (RONG, 2022). The input parameters when designing are the applied load, the structural mass, and the design constraints such as the location and size of some zones that are not allowed to change when optimized (Po, 2016).
2. RESEARCH METHODOLOGY
the other hand,
In this paper, the optimization will focus on the shape of a bearing plate that has been designed using conventional methods. Using Inventor Pro 2023 simulation software, the new bearing plate shape design based on edge conditions aims to reduce bearing plate weight.
This method is often used to improve the overall features such as rigidity, deformation and external force resistance of the machine part (Lin D. , 2013). Shape optimization methods are divided into the following three categories: size optimization, shape optimization, and shape optimization. In typical size optimization, the aim is to find the optimal thickness of the shape. On the goal of shape optimization is to find the optimal shape of the texture (Kang, 2014). Shape optimization involves identifying features such as shape,
381
JOURNAL OF SCIENCE AND TECHNOLOGY DONG NAI TECHNOLOGY UNIVERSITY
Special Issue
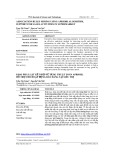
Figure 1. Shape optimization analysis tool table
evaluation of different options quickly under different conditions, e.g. the use of different materials, loads and constraints (boundary conditions), etc.
tools
Autodesk
Inventor provides
3. RESULTS AND DISCUSSION
3.1. The product needs to be optimal, materials and border conditions
3.1.1. Introduce
Original Product
safety
and
to determine structural design performance (shape engine) directly on the Autodesk Inventor Shape Generator model. Stress analysis includes tools for placing loads and constraints on a part or assembly and calculating stress, strain, resonant coefficient, frequency mode.
With stress analysis tools, we can:
Perform structural, static, or modal
analysis of a tool part or tool assembly.
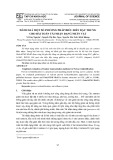
In the study, the Inventor Pro 2023 software was used to simulate a bearing frame (Figure 2) that is stressed by two forces in different directions. The weight and volume of the bearing plate are calculated to be 5.79e-3 kg and 0.739 cm before optimization.
Apply force, pressure, bearing load, torque, or body load to the top, face, or edge of the tool model, or import the motion load from the dynamic simulation.
Apply fixed or non-zero displacement
constraints to the tool model.
Model the different mechanical contact
conditions between adjacent tool parts.
Evaluate
the
impact of multiple
parametric design changes.
Figure 2. Original Bearing Frame Products
View analysis results for equivalent stress, minimum and maximum principal stress, strain, safety factor, or method frequency.
3.1.2. Product Materials and Edge Conditions
Add or block features such as building parts, design re-evaluations, and solution updates.
Animate the model through different stages of distortion, stress, safety factor, and frequency.
Generate complete and automated technical design reports of the visualization tool in HTML formatting.
The bracket is made of steel material. The mechanical properties of the material are presented in Table 1. The optimization of the shape of the bearing plate will be carried out on the basis of simulating a static problem with the use of Inventor Pro 2023 simulation software. The applied load is two forces with magnitude Fx = 50N and Fy = 100N shown in (Figure 3). 6 degrees of freedom binding is applied at holes A and B to fix the bearing plate during the simulation.
The stress analysis environment allows for the analysis of assembly or part design and the
382
JOURNAL OF SCIENCE AND TECHNOLOGY DONG NAI TECHNOLOGY UNIVERSITY
Special Issue
Table 2. Product Meshing Parameters Table 1. Mechanical properties of the material
0.1
Avg. Element Size (fraction of model diameter)
0.2
Min. Element Size (fraction of avg. size)
Coefficient Poisson
Specific Volume [kg/cm3]
Flow Stress [MPa]
Elastic Module [GPa]
1.5
Grading Factor
235
207
0.3
7800
Max. Turn Angle
60 deg
Yes
Create Curved Mesh Elements
Figure 3. Model border conditions
3.2. Simulate and optimize product shapes
The process of shape optimization is carried out in several cycles, starting with the meshing of the shape of the object to be optimized, the object's conducting an analysis of workability based on the finite element method, changing the density of the elements based on the defined optimization algorithm, and repeating the process with a new mesh based on the newly formed shape. The design space during the TO process is divided into two main areas. The first zone represents the "design space", namely the location of elements whose density is allowed to be modified (added or subtracted) when optimized, while the second zone represents the "non-design space", namely the zone consisting of elements that cannot be modified. (Figure 5) shows that the parts that can be optimized are highlighted in red, and those that are not applicable to the optimization process are highlighted in light green.
The finite element method (FEM) is often used as part of a two-stage design process for size, shape, and shape optimization problems. In the simulations, the tetrahedral element is used with a size of 0.1 mm in the model meshing (Figure 4).
Figure 4. Detailed gridding
Figure 5. Optimal surface (covered with red block), non-optimal (covered with light green block).
383
JOURNAL OF SCIENCE AND TECHNOLOGY DONG NAI TECHNOLOGY UNIVERSITY
Special Issue
The goal is to optimize the shape and weight of the bearing plate by adding or removing materials to elements in the optimized surface to achieve the desired design. In which, the volume is retained at least 50% of the volume compared to the original design of the model (Figure 6).
Figure 7. Optimal shape analyzed
For each calculation cycle, the optimization process includes: creating new material properties and elements during the shape optimization process; modify the coordinates of the nodes during shape optimization in order to create a new model; redesigning the product shape based on the optimal Inventor software shape (Figure 8); analyze the newly created model and record and evaluate the analysis results.
Figure 6. Optimal parameter setting
Figure 8. New product redesigned for optimal shape
satisfies
that
3.3. Testing the new product adaptation analysis
Shape optimization is finding the optimal material distribution function that satisfies constraints throughout the design domain. The goal of shape optimization is to minimize the deformation energy of the design shape, and the binding function is the density of the material (volume). A variety of combinatorial textures can be considered to obtain the optimal texture shape the objectives and constraints with the help of developing multiple shape optimization algorithms. Evolutionary optimization diagrams are another method being studied to achieve shape optimization results (Figure 7).
The output of a math solver is generally a significant amount of raw data. This amount of raw data would often be difficult and tedious to data the explain without
traditional
384
JOURNAL OF SCIENCE AND TECHNOLOGY DONG NAI TECHNOLOGY UNIVERSITY
Special Issue
arrangement and graphical representation known as post-processing. Post-processing is used to create a graphical display that shows the stress distribution, deformation, and other characteristics of the tool model.
Figure 10. New Product Displacement
The outline color displayed in the results corresponds to the range of values displayed in the commentary. In most cases, the results displayed in red are of the most interest, as they exhibit high stress or high deformation or low safety factor.
Stresses (Von Mises), to represent these
multidimensional stresses is to summarize them into an equivalent stress, also known as von Mises stress σv.
(1)
2
𝜎𝑣 = √(1−2)2+ (2−3)2+(3−1)2 In which:
Figure 11. New Product Safety Factor
σv is the von Mieses stress in MPa,
σ1, σ2, σ3 is the main stress in MPa.
Von Mises stress results use colored outlines to show us the stresses calculated in the solution for our drawing tool model.
Re-analyze the stress according to the new shape to check the required guaranteed detail (Figure 9).
Figure 12. New Product Safety Stress
Figure 9. New Product Stress Analysis
Figure 13. New Product Strain
385
JOURNAL OF SCIENCE AND TECHNOLOGY DONG NAI TECHNOLOGY UNIVERSITY
Special Issue
Table 3. Analysis Results
Name Minimum Maximum
2820.4 mm^3 Volume
0.022 kg Mass
Displacement parameters comply with the conditions of (Figure 10). Safety factor complies with the conditions of (Figure 11). And many images show the stress satisfying the conditions as in (Figure 12) and (Figure 13).
0.15 MPa 10.87 MPa Von Mises Stress
-3.22 MPa 10.75 MPa 1st Principal Stress
The analysis results show that the maximum stress value has not yet exceeded the load capacity for the material.
-10.10 MPa 2.61 MPa 3rd Principal Stress
Some important things to consider when
performing shape optimization:
0.0014mm 0 mm Displacement
15 ul 15 ul Safety Factor
-8.52 MPa 8.45 MPa Stress XX
-5.88 MPa 3.05 MPa Stress XY
-1.07 MPa 1.49 MPa Stress XZ
-7.45 MPa 8.26 MPa Stress YY
(1) Meshing: Shape optimization results when analyzing finite elements can be affected by the mesh density of the shape. Therefore, it is worth considering how different types of meshes affect the analysis of the shape being designed.
-0.92 MPa 0.97 MPa Stress YZ
-3.23 MPa 3.11 MPa Stress ZZ
-0.00022 mm X Displacement 0.00023 mm
-0.00140 mm Y Displacement 0.00001 mm
-0.00002 mm Z Displacement 0.00003 mm
(2) Minimum Element Size: Shape optimization can produce a very small shape thickness by finely dividing the mesh when designing which is difficult to produce in practice. Thus, it is recommended to consider the feasibility of production before making a decision on the smoothness of the mesh when optimal.
0.00001 ul 0.00004 ul Equivalent Strain
(3) Fabrication
0.00001 ul 0.00005 ul 1st Principal Strain
-0.00005 ul -0.00001 ul 3rd Principal Strain
feasibility: Fabrication methods according to shape features are often predetermined such as extrusion, casting, so the optimal shape is considered feasible in terms of fabrication using existing methods.
-0.00003 ul 0.00003 ul Strain XX
4. CONCLUSION
-0.00003 ul 0.00002 ul Strain XY
-0.000006 ul 0.000009 ul Strain XZ
-0.00002 ul 0.00003 ul Strain YY
-0.000005 ul 0.000006 ul Strain YZ
-0.000010 ul 0.000009ul Strain ZZ
In this paper, a load-bearing plate model is designed based on the results of a static problem simulation using shape optimization in Inventor Pro 2023 software. The results of the shape optimization analysis are highly dependent on the boundary conditions. When conducting shape optimization design, the edge conditions that affect the optimized shape need to be considered and applied correctly.
The stress analysis results show that the maximum stress result is 10.87 MPa as shown in (Figure 9). The blue stress zone has a fairly small stress of 0.15MPa, which is negligible compared to the flow limit of the material used.
386
JOURNAL OF SCIENCE AND TECHNOLOGY DONG NAI TECHNOLOGY UNIVERSITY
Special Issue


![Cơ sở dữ liệu: Tập bài giảng Phần 1 [Full]](https://cdn.tailieu.vn/images/document/thumbnail/2026/20260306/hoaphuong0906/135x160/46691773028939.jpg)


![Giáo trình Hệ quản trị cơ sở dữ liệu (Nghề: Kỹ thuật sửa chữa, lắp ráp máy tính - Trình độ: Trung cấp) - Trường Cao đẳng nghề Long Biên [Mới nhất]](https://cdn.tailieu.vn/images/document/thumbnail/2025/20251231/gaupanda090/135x160/35251771987392.jpg)
