
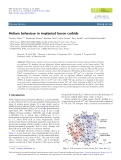
REGULAR ARTICLE
Safety operation of chromatography column system
with discharging hydrogen radiolytically generated
Sou Watanabe*, Yuichi Sano, Kazunori Nomura, Yoshikazu Koma, and Yoshihiro Okamoto
Japan Atomic Energy Agency, 4-33, Muramatsu, Tokai-mura, Naka-gun, Ibaraki 319-1194, Japan
Received: 30 April 2015 / Received in final form: 18 September 2015 / Accepted: 5 October 2015
Published online: 09 December 2015
Abstract. In the extraction chromatography system, accumulation of hydrogen gas in the chromatography
column is suspected to lead to fire or explosion. In order to prevent the hazardous accidents, it is necessary to
evaluate behaviors of gas radiolytically generated inside the column. In this study, behaviors of gas inside the
extraction chromatography column were investigated through experiments and Computation Fluid Dynamics
(CFD) simulation. N
2
gas once accumulated as bubbles in the packed bed was hardly discharged by the flow of
mobile phase. However, the CFD simulation and X-ray imaging on g-ray irradiated column revealed that during
operation the hydrogen gas generated in the column was dissolved into the mobile phase without accumulation
and discharged.
1 Introduction
The extraction chromatography technology is one of the
promising methods for the partitioning of minor actinide
(MA: Am and Cm) from spent nuclear fuel [1], and Japan
Atomic Energy Agency (JAEA) has been conducting
research and development for the implementation. In those
studies, we carried out design of an appropriate flow sheet
[2], laboratory scale separation experiments on a genuine
high level liquid waste [3], development of the engineering
scale apparatus [4] and inactive repeated separation
experiments using the large scale apparatus [5]. In order
to progress the implementation, not only the performance
of the column but also the safety of this system have to be
guaranteed.
In respect of the safety, fire and explosion are one of the
influential accidents which should be evaluated for nuclear
chemical processing including the chromatography system.
They are suspected to be caused by accumulation of
hydrogen gas produced by radiolysis of adsorbents or
mobile phase. Since radioactive nuclides in the aqueous
solution are processed by adsorbents involving organic
compounds, generation of hydrogen gas caused by
radiolysis of water and the organic compounds is an
unavoidable phenomenon. Consequently, the generated
hydrogen gas has to be safely discharged from the column
for the purpose of preventing fire or explosion.
Gas and heat are considered to be generated at the
adsorption band of MA simultaneously. An increase in
temperature of the mobile phase will lead to a decrease in
the solubility of H
2
gas into it, thus heat from radioactive
elements has also to be discharged as fast as possible. Our
previous study has shown that flow of the mobile phase
transports the decay heat to the outside of the column [4].
In this study, generation, accumulation and discharge
behavior of hydrogen gas were investigated through
experiments and Computation Fluid Dynamics (CFD)
simulation.
2 Experimental
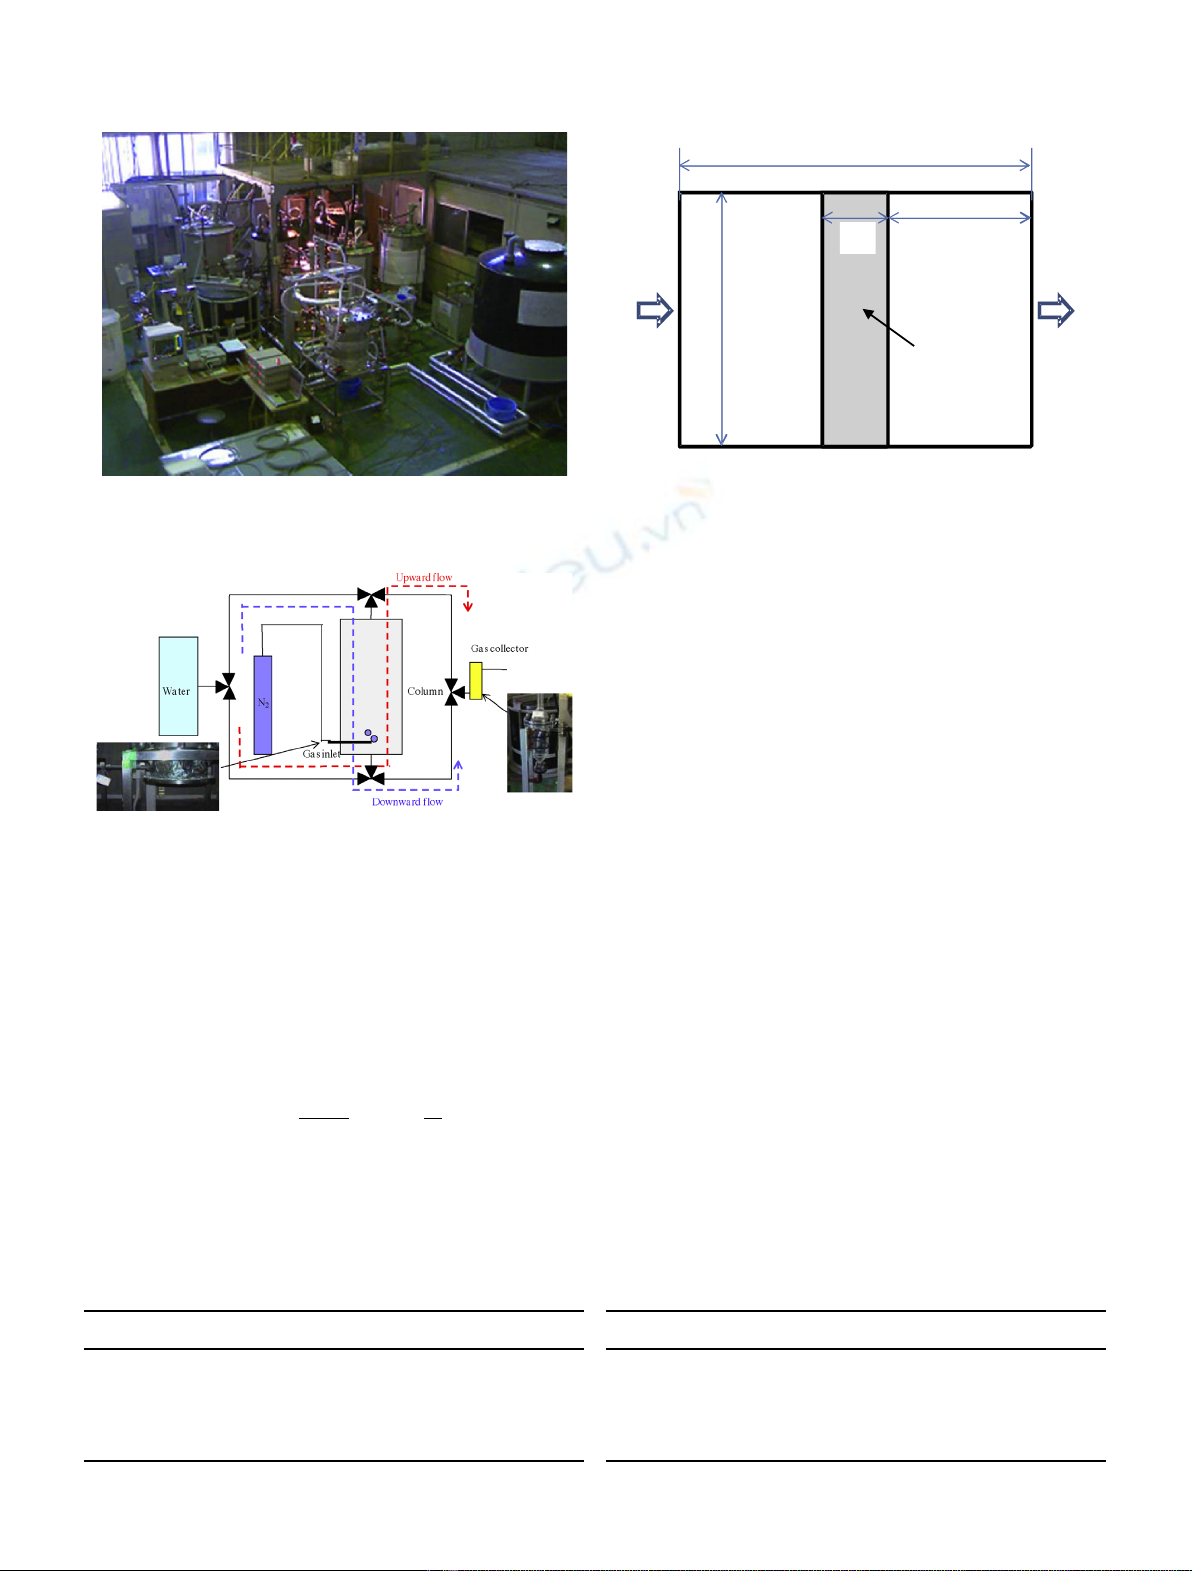
2.1 Behavior of gas in the engineering scale column
The large scale testing system consists of a column, tanks
and pumps as shown in Figure 1. The column of ID
200 mmFwith 650 mm height was used for the experi-
ments. The column has 18 ports for sensors for measuring
the electric conductivity of the mobile phase, and a gas inlet
was installed at the bottom of the column. The SiO
2
-P
support, which was prepared according to the article [6],
was mixed with water in the slurry tank and transferred to
the column by a mohno pump for packing.
N
2
gas was supplied into the packed bed through the gas
inlet, and then N
2
gas discharged from the column was
collected at downstream of the column as shown in Figure 2.
In this measurement, amount of the supplied gas and flow
*e-mail: watanabe.sou@jaea.go.jp
EPJ Nuclear Sci. Technol. 1, 9 (2015)
©S. Watanabe et al., published by EDP Sciences, 2015
DOI: 10.1051/epjn/e2015-50006-1
Nuclear
Sciences
& Technologies
Available online at:
http://www.epj-n.org
This is an Open Access article distributed under the terms of the Creative Commons Attribution License (http://creativecommons.org/licenses/by/4.0),
which permits unrestricted use, distribution, and reproduction in any medium, provided the original work is properly cited.
direction were parametrically changed as shown in Table 1.
The average flow velocity in the column was determined by
detecting the change in the electric conductivity of the mobile
phase when certain amount of Cu(NO
3
)
2
solution was mixed
in the water carrier as a tracer [4]. The tracer profiles were
analyzed by the same manner with deriving the height
equivalent of the theoretical plate (HETP) according to the
following equations:
N¼2pth
A
2
;H¼L
N;ð1Þ
where Nis the number of the theoretical plate, tis the
retention time, his the height of the profile, Ais the area of
the profile, His the HETP, Lis the length of the column.
2.2 CFD simulations
Simulation on two-dimensional side view of the column with
480 mm ID and 650 mm height was carried out to evaluate
the accumulation behavior of heat and gas. Two-dimensional
geometry was employed in order to evaluate influence of wall
on distributions of velocity, temperature inside the column.
The system consists of the bed, wall, inlet and outlet of the
mobile phase as shown in Figure 3. Mobile phase was water,
and outlet of the column was not pressured. Uniform and
immobile adsorption band of MA was assumed at middle of
the column. Heat from the adsorption band, which was
calculated from the decay heat of
241
Am and
244
Cm, was
0.023 W/cm
3
and constant. Temperature of the wall was
constant at 323 K which is one of the typical operational
conditions of the extraction chromatography process [5]. In
this simulation, H
2
,O
2
,NO
2
and CO
2
were considered as the
products at the adsorption band by radiolysis. The
generation rate of the gas was given by:
Ni¼3:73 104PGi;ð2Þ
where N,Pand Gare amount of the generated gas [mol/h],
heat from the adsorption band [W] and Gvalue [molecules/
100 eV] of component i, respectively. Gvalues shown in
Table 2 except for that of CO
2
are taken from an article [7],
and Gvalue of CO
2
was estimated from the results of g-ray
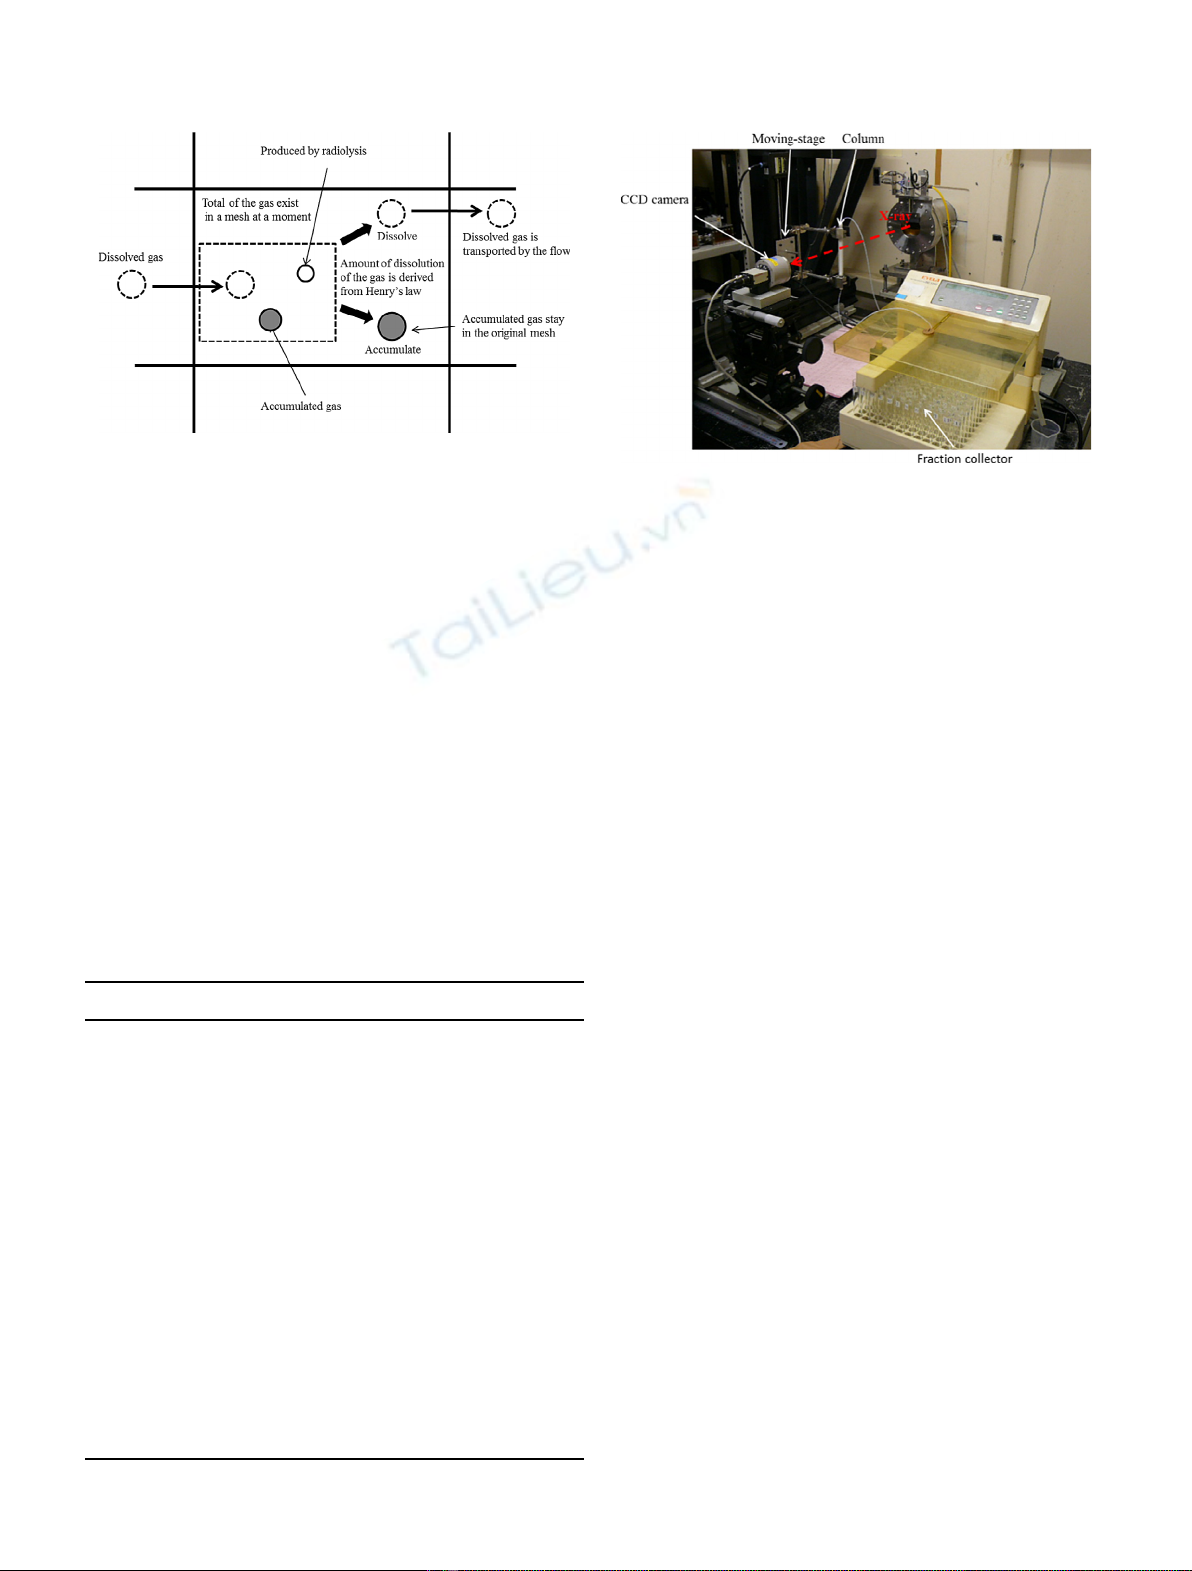
irradiation experiments on the adsorbents [8]. As shown in
Figure 4, generated gas was assumed to stay at the original
mesh unless it dissolves into the mobile phase. Dissolution
of the gas into the mobile phase follows the Henry’s law [9].
Fig. 1. Overview of the large scale system.
Fig. 2. Outline of the experiments for gas recovery.
Table 1. The experimental conditions for gas recovery.
No. Amount of N
2
gas (mL) Flow direction
(a) 200 Downward
(b) 50 Downward
(c) 200 Upward
(d) 50 Upward
Table 2. Gvalues of the gas components.
Component Gvalue [molecules/100 eV]
H
2
1.6
O
2
0.20
NO
2
1.1
CO
2
3.9
29
.
5 cm
48 cm
Inlet Outlet
Adsorption band
6 cm
65 cm
Fig. 3. Column configuration for the CFD calculation.
2 S. Watanabe et al.: EPJ Nuclear Sci. Technol. 1, 9 (2015)
Geometry was produced by GAMBIT 2.4.6 [10] software
and calculation was carried out by FLUENT 12.0 software
[11]. The packed bed was simulated by water and porous
media with porosity of 0.37, and the pressure drop of the bed
was proportional to the velocity of the water. The thermal
conductivity and heat capacity of the bed were experimentally
measured to be l
eff
=0.525W/m·KandCp
eff
=7.40J/g·K,
respectively. General features of CFD simulation are shown in
Table 3.Theflow velocity distribution was calculated with
different mesh sizes, and an appropriate size was selected to
eliminate dependence of results on the mesh.
2.3 X-ray imaging on g-ray irradiated columns
The CMPO/SiO
2
-P adsorbent contained CMPO (n-octyl
(phenyl)-N,N-diisobutylcarbamoyl-methylphosphine oxide)
as the extractant by impregnating it into the SiO
2
-P support.
The packed columns of 3 mmf-100 mmH (cylindrical bed) or
3mm10 mm 100 mmH (rectangular parallelepiped bed)
containing the adsorbent were irradiated by g-ray at
60
Co
irradiation facility in Takasaki Laboratory of Japan Atomic
Energy Agency. During the irradiation, mobile phase inside
the column was continuously supplied with 0.9 mL/min or
was stopped by closing the line. The irradiation dose rate was
3 kGy/h, and integrated irradiation dose was about 0.1 MGy.
Bubbles produced inside the bed by the irradiation
were observed by X-ray imaging. The experiment was
carried out at BL27B beamline of Photon Factory in High
Accelerator Research Organization, Japan. Experimental
setup for the imaging is shown in Figure 5. The incident
X-ray obtained from synchrotron radiation was mono-
chromaterized by Si(3 1 1) double crystal to 18.1 keV and
then guided inside of the experimental hatch. Intensity of
the X-ray passing through the column was measured by
the CCD camera. The resolution of the X-ray imaging was
about 25 mm. The column was set at moving-stage, and
X-ray image of whole of the column was obtained by 2 min
scanning. A pump for supplying solution and a fraction
collector for sampling effluent were set at upstream and
downstream of the column, respectively. Pump and tanks
for the solutions were located outside the experimental
hatch.
In order to evaluate influences of the bubbles on the
separation performance, column separation experiments using
the rectangle columns before and after the irradiation were
also carried out. A feed solution (3 M HNO
3
containing Y(III),
Sr(II)andZr(IV)),washsolution(3MHNO
3
), eluents (H
2
O
and 50 mM Diethylene Triamine Pentaacetic Acid [DTPA]
solution at pH = 3) were sequentially supplied to the columns,
andtheneffluents were fractionally collected at every 1.2 BV of
the column. Concentrations of the cations in the effluents were
analyzed by ICP-AES measurements. During the separation
experiments on the g-ray irradiated column, distributions of
Y(III) and Zr(IV) inside the column were evaluated from the
X-ray absorption intensities in the same way to that described
in reference [12].
Fig. 4. Conceptual diagram of behavior of gas in the CFD
calculation.
Table 3. General features of the CFD model.
Parameter Model
Solver Pressure based, double precision
Geometry 2-dimensional axisymmetric
Turbulence Laminar flow
Discretization Pressure: standardDensity: first order
upwindMomentum: first order
upwindTurbulent kinetic energy: first
order upwindSpecific dissipation rate:
first order upwind
Walls No-slip
Temperature
of the wall
323 K
Time step size 1 s
Mesh type Uniform rectangle
Mesh size 1 mm 1mm
The number
of mesh
156000
Pressure drop
of the bed
DP/L[kPa/m] = av[m/s],
a= 1.45 10
5
[kPa·s/m
2
]
Fig. 5. Experimental setup for the X-ray imaging.
S. Watanabe et al.: EPJ Nuclear Sci. Technol. 1, 9 (2015) 3
3 Results and discussion
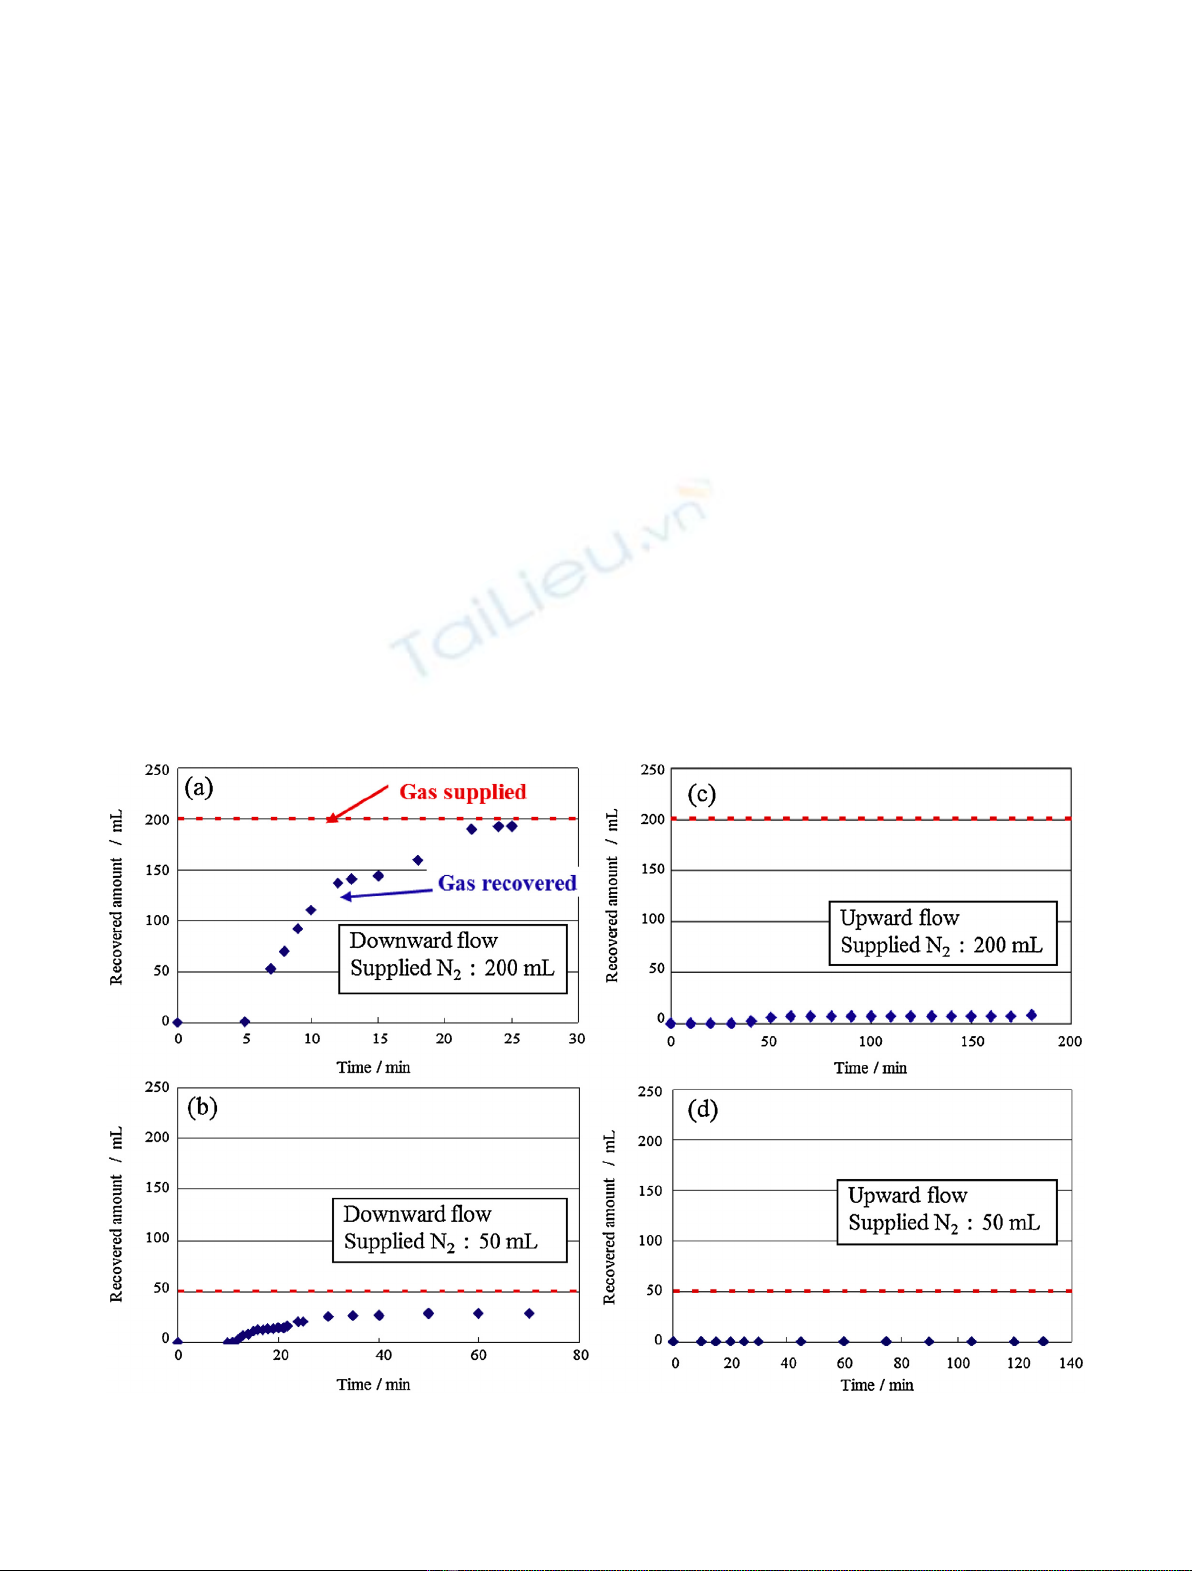
3.1 Behavior of gas in the engineering scale column
Figure 6 shows amount of the discharged N
2
gas plotted as
time after the injection of the gas, where the broken line
shows total amount of the supplied gas. Although almost all
the supplied gas was accumulated inside the column when
the flow direction is upward, the downward flow succeeded
in discharging large part of the supplied gas. Since the gas
inlet is located at the bottom of the column, the distance
from the location of the gas to the outlet rather than the
direction of the flow even when it is opposite to gravity must
be essential for the difference in the results. If gases generate
at close to the outlet of the column, almost all of them would
be discharged through normal operation.
Although upward flow could not discharge the supplied
gas, the accumulated gas was discharged when the upward
flow was restarted after stopping the flow. The stop and
restart of the upward flow was considered to change the
distribution of gas, and then the gas accumulating inside
the bed must be discharged. Therefore, switching of the feed
pump is expected to be one of the effective methods to
discharge the accumulated gas.
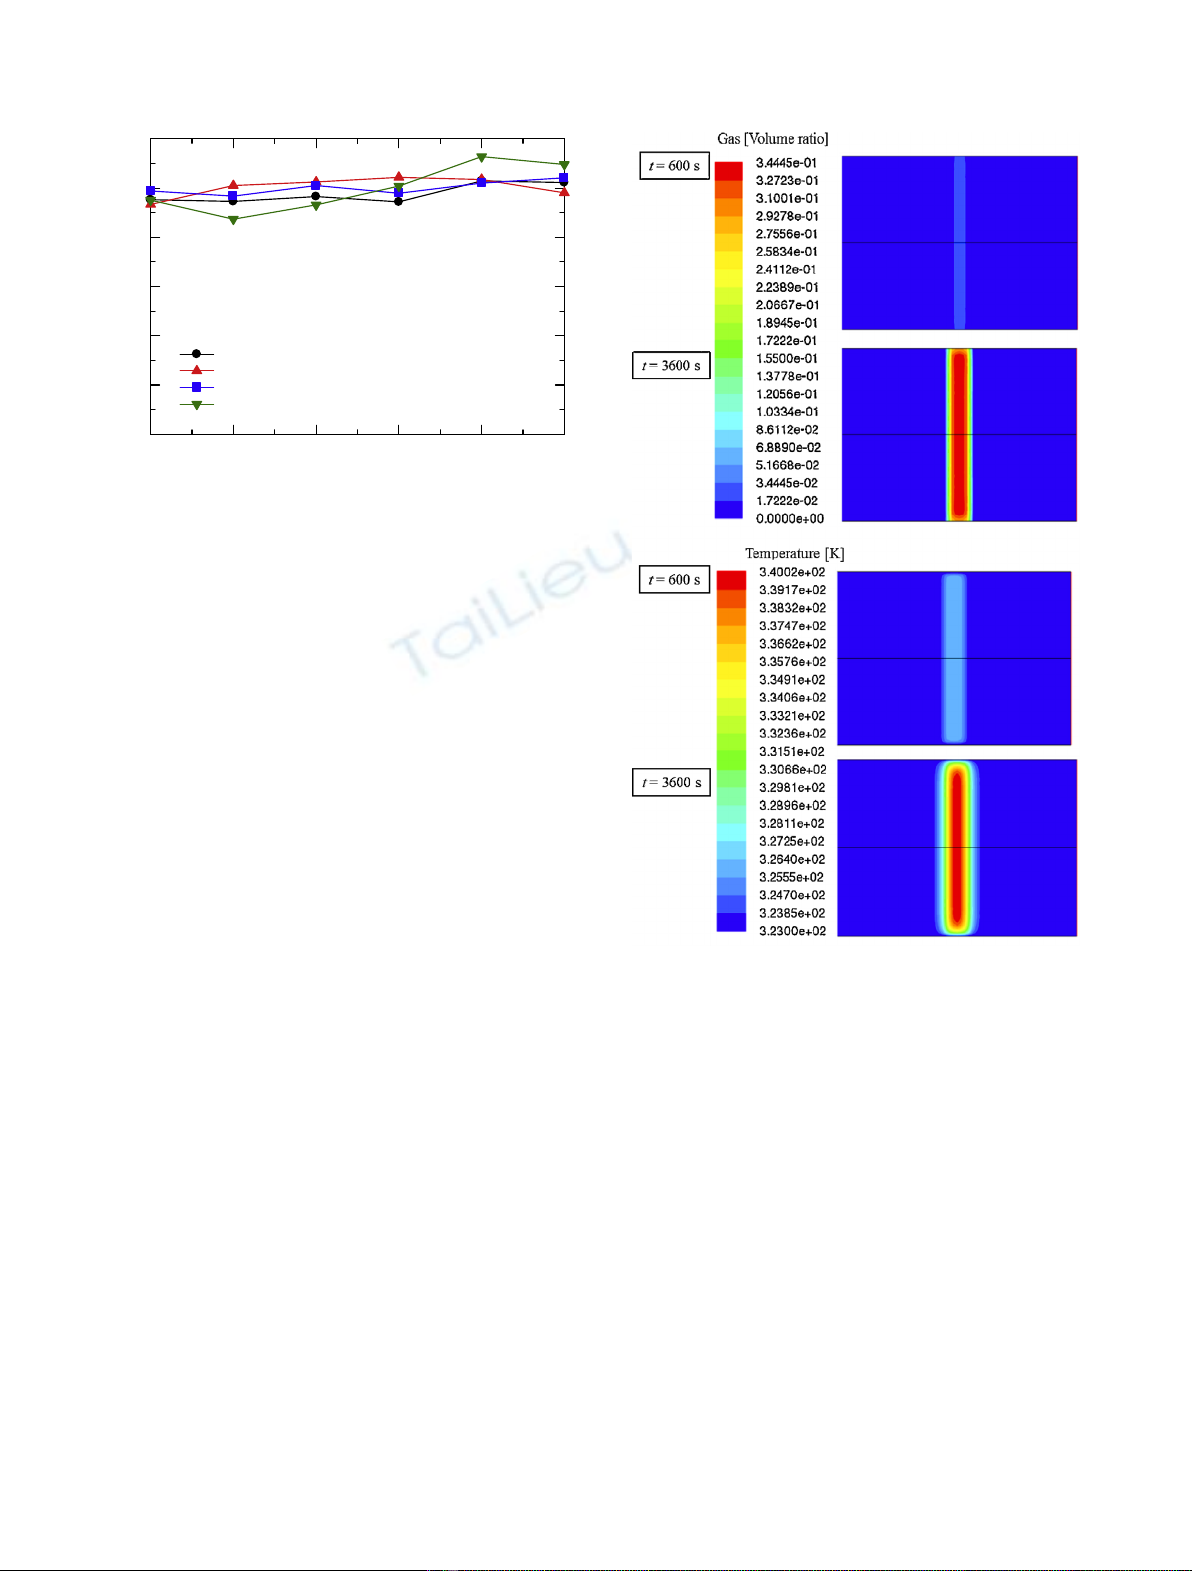
The flow velocity distribution inside the column and
height equivalent of the theoretical plate (HETP) at the
conditions of (a) and (c) were shown in Figure 7, where the
flow velocities and the HETPs for the columns without
supplying gas were also shown. The HETP at the condition
of (c) shows greater value than that evaluated for the
column without supplying the gas, whereas HETP of (a)
showed little difference from that of without supplying gas.
Therefore, accumulated gas may disturb the flow inside the
bed. There is distinct difference in the flow velocity between
at the center of the column and at close to the wall. The
accumulation of gas must be impediment for obtaining the
uniform flow. The gases generated by radiolysis have to be
discharged with respect to not only the safety but also the
separation performance of the column.
3.2 CFD simulations
The amount of the gas and increased temperature due to
radioactive nuclides were calculated under the condition of
T= 323 K for the initial and ambient temperature and
v= 4 cm/min for the mobile phase. The generated products
were properly dissolved into the mobile phase, and the gases did
not accumulate. Temperature inside the column was almost
constant, and the heat from adsorption band was transported
to the downstream by the flow. Generation rate of the hydrogen
from the adsorption band is 3.2 10
–5
mol/dm
3
·sandthe
Fig. 6. Amount of recovered gas from the column. (a) Flow direction was downward and amount of supplied N
2
was 200 mL; (b) Flow
direction was downward and amount of supplied N
2
was 50 mL; (c) Flow direction was upward and amount of supplied N
2
was 200 mL;
(d) Flow direction was upward and supplied N
2
was 50 mL. Flow velocity was controlled at 4 cm/min.
4 S. Watanabe et al.: EPJ Nuclear Sci. Technol. 1, 9 (2015)
solubility of the hydrogen gas into the water at 1 atm and 300 K
is ca. 7 10
–4
mol/dm
3
, then the generated products are
considered to dissolve into the mobile phase immediately. In the
case of O
2
,CO
2
and NO
2
, ratios of G values to the solubility of
them into water are smaller than that of hydrogen, so they
should dissolve in water as well. Therefore, hydrogen and
oxygen do not accumulate inside the column but dissolve into
the mobile phase and are dischargedwithaneluentduringthe
operation.
Figure 8 shows the distribution of the accumulated gas and
temperature inside the column at t= 600, 3,600 s, where the
flow was stopped at t= 0 s. The gas began to accumulate
before t= 600 s, and amount of the accumulated gas increased
with proceed with time. About 1,700 mL (0.15 mL/1 mL bed)
of gases at the standard condition was accumulated at
t= 3,600 s. Composition of the gas is 93% of H
2
and 7% of O
2
.
Generated CO
2
and NO
2
were properly dissolved into the
water. Since the mixture of hydrogen and oxygen shows
explosive nature, the accumulated gases should be discharged
from the column. The decay heat also accumulated at the
adsorption band after the stop of the flow, and wall cooling
was effective only at close to the wall. Thermal conductivity of
the adsorbents must be too small to remove the decay heat
inside the bed only by the wall cooling.
In order to evaluate the performance of chilled eluent for
discharging the accumulated gas, the amount of the
accumulated gas inside the column after the restart of
the flow was calculated. This calculation was started from
the state of 3,600 s after the stop of the operation as shown
in Figure 8. The flow velocity and temperature of the
coolant were v= 16 cm/min and T= 278 K, respectively. In
this simulation, flow velocity and temperature of the mobile
phase were changed from those for the normal operation in
order to enhance the dissolution of the gas into the mobile
phase. The accumulated gas and gas generated from the
adsorption band were gradually dissolved into the coolant,
and they were entirely discharged from the column at
t= 1,020 s. The accumulated heat was simultaneously
discharged from the column by the coolant. Since a part
of gas accumulating at the lower part of the column could
be pushed out by the mobile phase as seen in the previous
section, it must be required shorter time to discharge the
gas accumulated. An equipment for supplying the emer-
gency coolant which consists of pumps, tanks and pipes is
important for the safety of the system.
3.3 X-ray imaging on g-ray irradiated columns
Figure 9 shows X-ray image of the cylindrical columns.
Bubbles generated by the external irradiation inside the
bed were not confirmed in the images of the unirradiated
column and of the irradiated column with the flow of the
mobile phase. This result agrees with those obtained by the
CFD simulation described in the previous section, and
radiolytically generated hydrogen and oxygen should be
dissolved in the mobile phase and be discharged. On the
other hand, small bubbles with the size of ∼0.3 mm
ununiformly distributed inside the bed of the column
irradiated without the flow of the mobile phase. As well as
in the cylindrical column, bubbles were observed in the
0 2 4 6 8 10
0
1
2
3
4
5
6
Distance from the column wall [cm]
Average velocity magnitute [cm/min]
Downward flow, without gas, HETP = 1.70 mm
Upward flow, without gas, HEHP = 2.78 mm
(a) Downward flow, with gas, HEHP = 1.54 mm
(c) Upward flow, with gas, HEHP = 3.03 mm
Fig. 7. The flow velocity distribution inside the column (ID = 20 cm)
and HETP.
Fig. 8. Volume ratio of gas and temperature inside the column.
S. Watanabe et al.: EPJ Nuclear Sci. Technol. 1, 9 (2015) 5


![Đề ôn tập cuối kỳ môn Kỹ thuật nhiệt - Nhiệt động học [mới nhất]](https://cdn.tailieu.vn/images/document/thumbnail/2026/20260310/hoaphuong0906/135x160/60681773197823.jpg)

![Bài giảng thang máy và thang cuốn: Tổng hợp kiến thức [chuẩn nhất]](https://cdn.tailieu.vn/images/document/thumbnail/2026/20260310/hoaphuong0906/135x160/41471773283876.jpg)
