823
Ann. For. Sci. 60 (2003) 823–831 © INRA, EDP Sciences, 2004 DOI: 10.1051/forest:2003077
Original article
Effects of tree species on understory vegetation and environmental conditions in temperate forests
Laurent AUGUSTOa*, Jean-Luc DUPOUEYb, Jacques RANGERb
a INRA UMR-TCEM, 71 av. Edouard Bourlaux, 33883 Villenave d’Ornon, France b INRA, 54280 Champenoux, France
(Received 25 November 2002; accepted 05 December 2002)
Abstract – The objective of this study was to compare the impact of six tree species on vegetation and soil. Eighty stands growing side by side, and of different dominant species, were selected in 26 locations. Within each location the stands had the same soil condition, landscape position and previous land-use history. Ground vegetation and soil were sampled in each stand. The tree species were: Norway spruce (Picea abies Karsten.), Scots pine (Pinus sylvestris L.), Douglas-fir (Pseudotsuga menziesii (Mirb.) Franco), silver fir (Abies alba Miller), European beech (Fagus sylvatica L.) and oaks (Quercus robur L., Quercus petraea (Matt.) Liebl.). The geographic and geological characteristics of sites influenced the vegetation and the soil chemistry more than the tree species did. Forest management influenced the ground flora more than the tree species did. Number of species and equitability differed little with tree species. The ground flora under Norway spruce included more mosses than under the other trees species except silver fir. The ground flora under Norway spruce was more typical of oligotrophic and acidic conditions than the flora under European beech. Soils under coniferous species, especially Norway spruce, were more acidic and had higher concentrations of aluminium than soils under hardwoods. The effect of tree species on soils was greatest in the topsoil (0–10 cm).
acidification / biodiversity / understory / plantation / tree species
Résumé – Effet des essences sur la flore et la composition du sol en forêt tempérée. L’objectif de cette étude était de comparer l’effet sur la végétation et le sol de six essences forestières. Quatre-vingts peuplements répartis sur 26 sites ont été sélectionnés. Sur chacun des sites, les peuplements étaient d’essence différente mais comparables en termes de sol, de topographie et de passé cultural. Dans chaque peuplement, le sol a été échantillonné et la végétation a été déterminée. Les essences étaient : l’épicéa commun (Picea abies Karsten.), le pin sylvestre (Pinus sylvestris L.), le sapin Douglas (Pseudotsuga menziesii (Mirb.) Franco), le sapin pectiné (Abies alba Miller), le hêtre (Fagus sylvatica L.) et le chêne (Quercus robur L., Quercus petraea (Matt.) Liebl.). Les caractéristiques géographiques et géologiques des sites ont plus influencé la végétation et la chimie des sols que les essences. La gestion sylvicole a plus d’impact sur la flore accompagnatrice que les essences. La richesse spécifique et l’équitabilité végétales diffèrent peu selon les essences. La strate muscinale des pessières est plus abondante que sous les autres essences, sauf le sapin pectiné. La végétation sous l’épicéa est plus typique de conditions oligotrophes et acides que celle sous le hêtre. Les sols sous les conifères, notamment l’épicéa commun, étaient plus acides et riches en aluminium que les sols sous les feuillus. L’effet des essences sur les sols était essentiellement significatif dans les dix centimètres les plus superficiels.
acidification / biodiversité / végétation / plantation / essence
1. INTRODUCTION
The development of human societies often has caused an overexploitation of forests and a decrease in their area. In France, the minimum of forest cover coincided with the increase of industrial activities during the 19th century [15]. Threatened by wood shortages, some countries tried to increase their wood production by planting unforested areas and also by transforming some native forests to plantations. In most cases, these plantations were composed of exotic productive tree spe- cies. The abundance of native tree species decreased, in abso- lute and relative terms, from this period to the present. This
trend was very pronounced in several countries of western Europe, such as Scotland [51]. Exotic tree species have an undeniable economic value for wood production, thus the area covered by these species reached a high level in countries like France [43] and is still increasing. However, in order to ensure sustainable management, it is necessary to know the effects of these tree species substitutions. Several studies have already been carried out on the impact of tree species on litter (e.g. [47]), atmospheric deposition (e.g. [8]), bulk precipitation intercep- tion (e.g. [5, 26]), soil solutions (e.g. [25]), surface waters (e.g. [1, 22]) and soil (e.g. [46]). Nevertheless, few studies have examined the impact of tree species on the composition of
* Corresponding author: laugusto@bordeaux.inra.fr
824
L. Augusto et al.
by recent silvicultural activities. However, these stands were used for soil analysis purposes (see Sect. 2.2.2.). For each sample plot, the vegetation surveys were done in two seasons in 1998: spring (22 March to 10 April) and summer (21 June to 9 July). The names of vascular species follow the Flora europaea [60]. The percent cover of each vegetation layer (trees, shrubs, herbs, mosses) was visually esti- mated. An abundance-dominance coefficient using the Braun-Blanquet scale (‘+’ to ‘5’ equivalent to mean percentage cover class for data analysis: 1, 3, 15, 38, 63 and 88% respectively) was assigned to each species in each vegetation layer [11]. Species which were absent from the sample plot but nearby (distance < 1 m) were indexed separately. The same was true for species present in small heterogeneous areas (e.g. a micro-depression) of the sample plot. Species which could not be identified in the field were brought to the laboratory for definitive identification. All vegetation surveys were done by the same pair of observers working together.
understory vegetation. The work which has been done is not easily generalised as it involved very few sites (e.g. [39]), mixed-species stands [7, 16], young stands [48] or a vegetation specific to a region. It is important to study the effect of over- story species on understory species because ground flora, when it is significantly present, plays a role in the functioning of for- est ecosystems. The understory can contain a significant part of the nutrient content of the forest (e.g. [49]), especially in the younger stages of stand development [56]. It may also influence the nutrient fluxes in the ecosystem during throughfalls [35], mineralisation [40], nitrification (e.g. [65]) and after clear-fell- ing [18]. Moreover, vegetation can influence the microflora [41] and enhance the weathering of soil minerals (e.g. [32]). It is also notable that the understory can be an obstacle to planting operations, as well as a competitor with trees for light, water and nutrients [64] which can cause a decrease in tree growth [27, 63]. The understory is part of the biodiversity of stands and, as such, interacts with animal communities. Finally, a natural and diverse understory vegetation may be very important to societies beyond any effect on growth or nutrients.
Σ Shannon density index (H’ = – (pi)(ln pi), where pi = relative cover value) and equitability (H’/H’max; H’max = ln(n), where n = number of species) were calculated. Average Ellenberg indicator val- ues [23] were used to indirectly characterize the environmental fac- tors: light (L), temperature (T), moisture (F), pH (R) and nitrogen availability (N). These indicator values vary from 1 to 9 (or 12 for F). The value ‘1’ corresponds to the lowest levels of the factor whereas the value ‘9’ (or ‘12’ for F) corresponds to the highest levels. The cal- culation of the average Ellenberg values for a plot was done over all species present in the plot. Results for ground vegetation and average Ellenberg values, based on presence/absence data were very similar to those based on cover data. Therefore, only results of presence/ absence data are presented.
The objectives of this study were to (i) compare understory vegetation under different tree species, and (ii) determine the differences in environmental conditions which could explain the possible changes of vegetation. To guarantee some homo- geneity among the set of studied sites, only one main type of soil was considered: non-hydromorphic acidic soil. This study was based on vegetation surveys, dendrometric measurements, light transmittance estimations, and soil chemical analysis.
2.2.2. Environmental conditions
2. MATERIALS AND METHODS
2.1. Material
Soils were described based on three soil pits in each stand. Five soil samples were taken with a cylinder (Ø = 8 cm) for each horizon and composed for analysis. Soils were analysed down to 40 cm depth. The variables were: apparent soil density (cylinder method), particle size distribution (five main phases using the Robinson method), C content (oxydation by K2Cr2O7 in H2SO4 [3]), N content (Kjeldahl method [12]), pH (soil:water ratio = 1.25), cationic saturation and Cationic Exchange Capacity [52], ‘available’ phosphorus (extracted by H2SO4 0.004 M and NaOH 0.1 M [20]), free iron and aluminium [59]. Litter was described and the thickness of its layer was measured. The height of the three largest trees were measured with a Blume- Leiss dendrometer. Basal surface area was measured with a Bitterlich’s relascope. Stand age was estimated by coring the base of a tree with an increment borer. Health of stands (indications of decline) and sil- vicultural management (uneven-aged stand or recent thinnings) were recorded based on visual inspection.
In each stand, mean transmittance of radiation by the canopy was estimated in the global solar irradiance (0.3–3.0 nm) with two sola- rimeter tubes (TLS-970, Delta-T devices Ltd., Cambridge, UK). One device measured the irradiance (I) in the stand (12 measurements divided into two parallel transects of 15 m long) while the second device simultaneously measured the irradiance in the nearest open area (Io). For each measurement, the radiation transmittance was cal- culated as I/Io.
A total of 80 stands were selected from 26 forests with acidic soils (soil pH < 5). The sites were located in the northern half of France. At each site, two to five stands, growing side by side and of different dominant species, were selected (Tab. I). The tree species studied were: sessile and pedunculate oak (Quercus robur L., Quercus petraea (Matt.) Liebl.), European beech (Fagus sylvatica L.), Nor- way spruce (Picea abies Karsten.), silver fir (Abies alba Miller), Douglas-fir (Pseudotsuga menziesii (Mirb.) Franco) and Scots pine (Pinus sylvestris L.). Douglas-fir is native to north western America. The other tree species are European, but some of them (Norway spruce and Scots pine) have spread widely outside their natural area through the action of forest managers. The two species of oak were considered here as a single species as there were few pedunculate oak stands (Quercus robur). Soil conditions, previous land use and eco- logical conditions (slope, exposition, landscape position) of the dif- ferent stands within a site were identical. In most cases, stands within the same site were side by side, or separated by less than 100 meters. All stands were even-aged except six hardwood stands (Haye and Monthermé: coppice with standards; Coat-an-Noz, Moux, Paimpont and Soulles: uneven-aged high forest). It was not possible to find sites with stands of the same age.
2.2.3. Data analysis
2.2. Methods
2.2.1. Understory
As all tree species were not present on all sites and as the distribu- tion of tree species in the sites was not random (e.g., the frequency of Scots pine stands was low in the less acidic sites), it was not possible to directly compare tree species means without introducing a substan- tial error linked to site differences. Indeed, the effect of the “site” fac- tor was much greater than the effect of the “tree species” factor.
In the centre of each stand of each site, a sample plot with a surface area of 400 m2 was laid out in a homogenous area. A few stands were not used in the vegetation surveys because of heterogeneities caused
Effects of tree species on vegetation and soil
825
Table I. Site characteristics.
T R Altitude Soil Bedrock pH CEC Oak Beech Spruce Fir Douglas Pine Site (°C) (mm) (m) (F.A.O.) (generic terms) # (age) *
Aubure NE 5.5 1500 1000 dystric cambisol granite 110 90 9.6 3.7 90
Bisshoffsheim NE dystric cambisol sandstone 70 (§) 9 950 500 4.7 4.0 80 90
dystric cambisol granite 13.3 20 Breuil 9 1000 CF 550 4.3 20 20 20
Coat-an-Noz NW 11 950 haplic luvisol silt 160 7.6 4.0 119 32 34 35
La Courtine 7.5 1250 dystric cambisol 14.2 90 (§) 45 (§) 41 CF 820 granite 4.5 47 48
Couturas 10 1400 CF 650 granite dystric cambisol 8.2 4.7 110 55
Epinal 9 1000 NE 390 dystric cambisol sandstone 6.5 4.7 48 35 35
NW 10 65 (r.) 60 (§) 60 (§) Eu 780 200 dystric cambisol silt 6.5 4.7 95
Haye 9.5 760 NE 370 haplic luvisol silt 6.7 4.8 76 65 65 65
Hochkopf 9 800 NE 370 cambic podzol sandstone 3.7 3.6 78 75 75
Lucenay 9 1000 CF 540 dystric cambisol rhyolithe 6.9 4.3 66 41
Monthermé 8 1100 NE 390 dystric cambisol silt 14.1 3.4 140 58
Mouterhouse 9 820 NE 345 cambic podzol sandstone 3.3 4.2 120 114 46
Moux 9 1000 CF 560 dystric cambisol granite 10.4 4.5 83 64 65 (§)
Oberbronn 9.5 870 NE 410 dystric cambisol sandstone 4.1 3.9 91 87 85
Orléans 10 600 CF 130 haplic luvisol sand 11.3 4.4 45 47
870 250 Paimpont NW 11 dystric cambisol silt 7.4 3.7 47 33
450 8.7 4.4 35 Peyrat CF 8.5 1400 dystric cambisol granite 65 (r.) (§)
8 1100 700 Pilon CF 3.9 46 46 dystric cambisol silt 11.8 143
9 790 380 La Petite-Pierre NE haplic luvisol sandstone 8.1 3.7 57 78 35 43
630 150 Rambouillet NW 10 haplic podzol sand 4.7 3.9 92 44
8 1470 NE 610 Remiremont dystric cambisol silt 9.2 4.1 190 35 35 35
9 1000 NE 650 Rosheim dystric cambisol granite 8.0 4.5 70 110 65
CF 750 Royat 10.3 4.6 48 64 62 8.5 890 dystric cambisol granite
150 Soulles 7.0 3.8 34 38 NW 11 1100 gleyic luvisol silt 57 (r.) (§)
58 Thann NE 8.5 1000 850 dystric cambisol granite 4.6 8.7 76 70 (§) 68
≤
≤
≤
0.05; (*) = P
0.01; * = P
≤
(axis scores for correspondence analysis). Ellenberg indicator values [23] were used to characterize the environment. All the results which showed a significant effect of the tree species were based on relative values (except Fig. 1). Data were analysed with SAS [54] using anal- ysis of variance (one-way ANOVA; factor = tree species), corre- spondence analysis and Bonferroni t-tests. The number of sites was not sufficient to test the effect of the interaction between sites and tree ≤ species. Significance of statistic tests were noted as follow: *** = P 0.001; ** = P 0.1; n.s. = P > 0.1. When P
0.1, we assumed that a weak relationship existed.
Therefore, relative values were calculated for each pairwise combina- tion of tree species present in the same site. A positive relative value indicates that the first tree species has a higher value than the second tree species (see Tab. II for an example). This calculation made it possible to compare two tree species located in the same sites while partly discarding site effects. The “division” relative values were pre- ferred to “subtraction” relative values when differences between tree species increased with the site mean value. The “division” relative values do not match discontinuous variables (percentage of cover, lit- ter thickness and Ellenberg indicator values) or relatives variables
NW = northwestern France; CF = center of France; NE = northeastern France. T = temperature (annual mean); R = rainfall (annual mean); # = mean soil pH at 0–5 cm depth; * = mean soil CEC at 0–5 cm depth (cmol c·kg–1); (§) = only soil analysis. Oak = Quercus petraea (Matt.) Liebl. or (r.) Quecus robur L.; Beech = Fagus sylvatica L.; Spruce = Picea abies Karsten; Fir = Abies alba Miller; Douglas = Pseudotsuga menziesii (Mirb.) Franco; Pine = Pinus sylvestris L.
826
L. Augusto et al.
Table II. Calculation of relative values, an example: soil pH at 5-cm depth (Pilon site).
Value
Comparison
Calculation
Final Value
3.90
Douglas fir
.
3.82
Original value
Norway spruce
.
4.13
Sessil oak
.
+0.08
Absolute
S(douglas-spruce)
3.90 – 3.82
–0.23
difference
S(douglas-oak)
3.90 – 4.13
–0.31
(substraction)
S(spruce-oak)
3.82 – 4.13
+0.02
Relative
D(douglas/spruce)
(3.90 / 3.82) – 1
–0.06
difference
D(douglas/oak)
(3.90 / 4.13) – 1
(division)
D(spruce/oak)
(3.82 / 4.13) – 1
–0.08
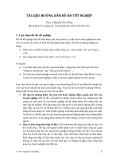
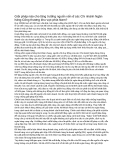
Figure 1. Correspondence analysis of vegetation.
Due to the nature of the survey, some tree species comparisons were not repeated enough to be analysed statistically. Such was the case for comparisons (oak / silver fir) and (European beech / Scots pine). The comparisons (Douglas-fir / silver fir), (Douglas-fir / Scots pine) and (silver fir / Scots pine) were studied only in terms of soil characteristics. A ‘hardwood’ category was created by taking the val- ues of the oak stand or, when none was present, of the beech stand in each site. Data from the coniferous stands were systematically com- pared to this hardwood reference.
under Scots pine. There were not enough pairs (Douglas-fir; Scots pine) to demonstrate a gradient for equitability as fol- lows: Douglas-fir > Norway spruce > Scots pine.
3. RESULTS
3.1. Ground vegetation
3.1.1. Cover of vegetation layers
The cover of trees was higher for oak and silver fir stands than for Scots pine stands (Tab. III). The cover of shrubs was higher under hardwood and Scots pine canopies than under Douglas-fir and Norway spruce canopies. The cover of herbs in summer was higher under oak than under Douglas-fir. The cover of mosses was higher under Norway spruce than under hardwoods, Douglas-fir and Scots pine.
3.1.2. Species richness and diversity
A correspondence analysis of the entire dataset was per- formed. The cumulated principal inertia of the five first-axes was 20%. Analysis of variance revealed highly significant dif- 0.001) between sites on these axes. This is what ≤ ferences (P we called the “site factor”. First-axis scores were correlated with Ellenberg indicator values for pH (r = –0.91***), Ellenberg indicator values for nitrogen availability (r = –0.89***), spe- cies richness (r = –0.86***), Shannon’s index (r = –0.79***), saturation index of soils for exchangeable earth-alkaline cations (r = –0.60***), C/N ratio (r = +0.59***) and soil pH (r = –0.54***). These statistics clearly showed that the main factors accounting for variation in ground vegetation were soil acidity, nitrogen content and base saturation of the sites. They also showed that Ellenberg indicator values (pH, nitrogen availability) were well correlated with soil characteristics (pH, C/N ratio). Second-axis scores were correlated to longitudinal position of stands (r = +0.72***). There were significant differences between tree species in their relative values for the first-axis scores (Fig. 1 and Tab. III), with Norway spruce > silver fir > European beech, indicating an increasingly rich and nitrogen-requiring vegetation. Species richness was correlated primarily to Ellen- berg indicator values for pH (r = +0.79***) and nitrogen avail- ability (r = +0.70***).
For the entire dataset, there were few significant differences between tree species for species richness, i.e. the number of species (Tab. III). Only unthinned stands of Norway spruce, silver fir and Douglas-fir had very low species richness (rich- ness ≤ 5; data not presented). For stands thinned a few years before the present study, species richness was significantly higher (P < 0.05) under Norway spruce, silver fir and Douglas- fir than under hardwoods (data not presented). In these cases, there were several ruderal forest species under the coniferous canopies.
Based on field observations, it seemed that some understory species were specific to a particular tree species (e.g. some mosses observed only under Norway spruce). However, the number of sites was insufficient to statistically test this obser- vation.
Taking into account the understory species which were absent from the sample plot but close to it, and species present
There were few significant differences between tree species in terms of Shannon’s index (Tab. III). Equitability under Douglas-fir was higher than under hardwoods and Norway spruce. Equitability under Norway spruce was higher than
Effects of tree species on vegetation and soil
827
Table III. Mean effects of tree species on vegetation (as relative values).
higher C/N ratios than hardwood, whereas silver fir and Douglas- fir were intermediate.
Category
Variable
Tree species effect
Relative value
Trees
S (oak-pine)
+12.1 *
S (fir-pine)
+13.3 *
S (hardwood-douglas)
+27.6 **
Shrubs
S (hardwood-spruce)
+29.2 **
Cover of
S (pine-douglas)
+60.3 **
vegetation
S (pine-spruce)
+39.0 (*)
layers
Herbs
S (oak-douglas)
+44.7 *
(%)
(summer period) S (hardwood-spruce)
+20.6 (*)
S (hardwood-spruce)
–34.3 **
Mosses
S (douglas-spruce)
–29.6 *
Soil pH was significantly lower under Scots pine and Nor- way spruce than under hardwoods (mean difference ± standard error: –0.18 ± 0.08 and –0.31 ± 0.09 pH unit, respectively). The saturation index of soils for exchangeable earth-alkaline cations were higher under hardwoods and Douglas-fir than under Norway spruce. Norway spruce and especially silver fir had the highest soil Na content. The variable which correlated most strongly with soil Na content was the longitudinal local- isation of stands (r = –0.57***). Results for exchangeable Al and free Al showed that these contents were higher under Norway spruce, silver fir and Scots pine than under hardwoods (P ≤ 0.1). There were no difference among tree species for the follow- ing soil variables: density, particle size distribution, Cationic Exchange Capacity, free iron content, P content. The slopes of stands were not different among tree species of the same site.
S (pine-spruce)
–52.8 (*)
Richness
D (beech/fir)
–0.13 **
3.2.2. Ellenberg indicator values
Shannon
D (beech/fir)
–0.04 **
Biodiversity
indices
D (douglas/beech)
+0.15 *
D (douglas/hardwood)
+0.19 *
Equitability D (douglas/spruce)
+0.07 *
Ground vegetation under Scots pine had higher indicator values for light and moisture than under oak (Tab. V). Norway spruce stands had the lowest indicator values for temperature. European beech stands had higher indicator values for pH, nitrogen and temperature than silver fir stands.
D (spruce/pine)
+0.02 *
Correspondence
S (spruce-fir)
+0.16 *
3.3. Relationship between vegetation and direct
analysis of
First-axis scores S (fir-beech)
+0.14 *
measurements
S (spruce-beech)
+0.34 **
understory Note: only significant comparisons (P ≤ 0.1) are listed.
in small heterogeneous areas of the sample plot, did not signif- icantly modify the results for ground vegetation analyses.
3.2. Environmental conditions
3.2.1. Direct measurements and analysis
There were no significant differences among tree species for mean radiation transmittance. Mean radiation transmittance was negatively correlated to canopy cover (r = –0.57***) and basal surface area (r = –0.36**). The latter two variables were not significantly correlated. Covers of field layer vegetation (spring and summer) were positively correlated to mean radi- ation transmittance of stands (r = +0.26* and +0.32**). Covers of herbs or mosses were negatively correlated to canopy cover (r = –0.29* and –0.24*). Species richness was not signifi- cantly correlated to mean radiation transmittance. Cover of herbs in spring was negatively correlated to litter thickness (r = –0.40***). Species richness was also negatively corre- lated to litter thickness (r = –0.44***).
The hardwoods in this study were older than Douglas-fir, Norway spruce and Scots pine, and smaller than Douglas-fir and Norway spruce (Tab. IV). Except for European beech and Douglas-fir, there was no radiation transmittance difference among tree species.
3.4. Effect of stand age
There was no significant effect of the “age” factor, or inter-
action between the stand age and tree species.
4. DISCUSSION
4.1. Validity of the tree species comparison
The “tree species” factor obtained from the correspondence analysis had less significant effects on soils (data not presented) in deep horizons (> 10 cm) compared to the top soil (≤ 10 cm). However, some soil variables were dependent on tree species down to 40-cm depth. Between 30 and 40-cm depth, soils under Norway spruce had more exchangeable Al than under hardwood and silver fir. At the same depth, soils under Nor- way spruce and Scots pine had more H+ than under hardwood. It also appeared that soil pH was lower under Norway spruce and Douglas-fir than under hardwood.
Results for the top soil volume: Norway spruce and Scots pine litter layers were thicker than the hardwood litter layer. C/N ratio differed among all the tree species of this study: Scots pine and Norway spruce had
There was no difference among tree species for variables such as land-use history, slope, soil particle size distribution or for most characteristics of deep soil horizons. This is a strong indication of that there was no significant differences between stands within sites before planting. The tree species in the present study were of similar height and age except for the
828
L. Augusto et al.
Table IV. Mean effects of tree species on environmental conditions and soil (relative values).
Category
Variable
Tree species effect
Relative value
Age (years)
D (hardwood/douglas) D (hardwood/spruce)
+0.72 *** +0.55 ***
Stand
D (hardwood/pine)
+0.40 *
characteristics
D (hardwood/douglas)
–0.27 *
Height (m)
D (hardwood/spruce)
–0.12 *
D (douglas/spruce)
+0.20 ***
S (pine-hardwood)
+1.95 *
S (pine-spruce)
+1.92 (*)
S (spruce-hardwood)
+1.85 **
Litter
Litter depth (cm)
S (spruce-fir)
+2.90 *
S (spruce-douglas)
+1.88 (*)
D (spruce/hardwood)
+0.22 ***
D (spruce/pine)
+0.12 *
D (spruce/douglas)
C/N ratio
+0.13 **
D (pine/hardwood)
+0.19 *
D (spruce/fir)
+0.07 *
D (douglas/hardwood)
+0.08 (*)
D (fir/hardwood)
+0.21 (*)
D (spruce/hardwood)
–0.07 **
D (pine/hardwood)
pH
–0.05 *
D (pine/fir)
+0.04 *
D (spruce/hardwood)
+0.84 (*)
D (spruce/pine)
–0.36 (*)
Al (cmol c kg–1)
D (pine/hardwood)
+0.34 (*)
Soil
D (fir/hardwood)
+0.71 (*)
(0–10 cm)
–0.25 *
Saturation
D (spruce/hardwood)
D (spruce/douglas)
–0.48 *
D (douglas/spruce)
+2.13 *
D (oak/pine)
+0.72 *
index (%) Ca (cmol c kg–1) Mg (cmol c kg–1)
D (douglas/spruce)
+0.19 *
K (cmol c kg–1)
D (douglas/oak)
–0.31 *
D (spruce/hardwood)
+1.15 *
+1.58 **
D (fir/hardwood)
Na (cmol c kg–1)
D (fir/pine)
+1.02 *
D (fir/douglas)
+0.90 *
D (spruce/hardwood)
+0.26 (*)
D (fir/hardwood)
+0.31 (*)
D (pine/hardwood)
+0.21 (*)
Al (oxides) (mg kg–1)
Note: only significant comparisons (P ≤ 0.1) are listed.
hardwoods which were usually older and smaller than conifer- ous species. This could introduce a bias when comparing the tree species effects. However, note that hardwoods generally have longer cutting cycles and lower biomass increments than
coniferous tree species; that is, at the same stage of maturity, hardwood stands tend to be older than coniferous stands. In most cases, stands within sites were at similar stages of matu- rity (the stage of maturity was considered as the ratio {current
Effects of tree species on vegetation and soil
829
Table V. Mean effects of tree species on Ellenberg indicator values (relative values).
Category
Variable
Tree species effect
Relative value
Light (L)
S (pine-oak)
+0.39 **
S(pine-spruce)
+0.27 **
under these species in comparison with hardwood. Elsewhere, it has been established that atmospheric depositions are higher under coniferous stands than under hardwoods [6, 13]. Nor- way spruce promoted an increase of soil aluminium content compared to hardwoods. It seemed that this was also the case for Scots pine and silver fir. In the deeper soil horizons, the tree species effect was primarily a more or less marked acidi- fication of soils.
S (spruce-douglas)
–0.43 *
S (spruce-hardwood)
–0.23 *
4.3. Light and Ellenberg indicator values
Ellenberg Temperature (T) S (spruce-fir)
–0.22 *
S (spruce-pine)
–0.17 (*)
indicator
values
S (beech-fir)
+0.31 *
Moisture (F) S (pine-oak)
+0.14 *
S (spruce-douglas)
–0.26 *
pH (R)
S (spruce-beech)
–0.38 (*)
S (fir-beech)
–0.35 *
S (douglas-beech)
+0.27 *
Nitrogen (N)
S (fir-beech)
–0.26 **
Note: only significant comparisons (P ≤ 0.1) are listed.
There was no significant difference among tree species for mean radiation transmittance. In similar conditions, radiation transmittance is tree species dependant [10] and, within a tree species, radiation transmittance depends on stand density [17, 55]. Cutini [17] showed that thinning could double the radia- tion transmittance of the global solar irradiance (0.3–3.0 nm) and increase five-fold the photosynthetically active radiation (0.4–0.7 nm). It seemed therefore that, in a forest managed for timber production, silvicultural management could have a greater influence on the quantity of light reaching the soil than tree species. Finally, we conclude that semi-quantitative and punctual measurements of global solar irradiance were probably inadequate to study the modifications of light caused by tree species. Ellenberg indicator values for light were not consistent with radiation transmittance. Indeed, if there was no signifi- cant difference in radiation transmittance among tree species, it appeared that the Scots pine understory had the highest light indicator value (L).
age/approximate age of maximum current increment}). Very few sites had stands at different stages of maturity and the results were not significantly modified when these sites were dropped from the analysis. Thus, we assumed that stands within sites were in nearly the same condition and we inter- preted differences among stands as effects of tree species.
To the contrary, results for Ellenberg indicator values were consistent with soil analyses. They showed that understories of Norway spruce and silver fir were typical of more acidic conditions compared to understories of the other tree species. The results for temperature indicator values suggested the Norway spruce microclimate was colder than the others.
4.4. Factors controlling understory cover
and composition
As shown by the correspondence analysis, site characteris- tics (like bedrock or mean soil characteristics) were the most significant factors explaining the overall soil and vegetation variability, much more important than tree species. Indeed, because sites were located in various regions, the bioclimatic and geologic characteristics explained most of the variability in soil and vegetation results. Differences among sites were much higher than among tree species.
4.2. Effect of tree species on soil
Silvicultural management, via thinning intensity, influ- enced canopy cover and subsequently cover of ground vegeta- tion. Tree species also influenced shrub, herb and moss cover (see also [38]). This was especially the case for Norway spruce, compared to hardwoods, which promoted cover of mosses and reduced cover of herbs. Hill and Jones [31], Mikola [42] and Saetre et al. [53] have noted this effect of Nor- way spruce. The dominance of the moss layer under Norway spruce suggested that the microclimate under this species was cooler and moister. Nihlgard [45] showed that the atmosphere under Norway spruce was cooler and moister than under Euro- pean beech. He also remarked that the microclimate under spruce seemed to enhance the moss Lophocolea heterophylla. The results of another study suggest that the greater cover of mosses under Norway spruce compared to hardwoods could be due also to the more acidic soil of the coniferous stand [21]. Canopy cover of Scots pine was less dense than others and promoted a greater cover of all understory layers.
The tree species effect was mostly significant in the upper 10 cm of soil, as observed by others [4, 9]. Scots pine and Nor- way spruce had thicker litter with higher C/N ratios than oak and European beech [19, 28]. These results were probably linked because the mineralisation rate of litter is influenced by its characteristics (such as hardness, shape, lignin/N ratio or leaf longevity), which in turn are tree species dependant [29]. Moreover, topsoil pH and saturation index for exchangeable earth-alkaline cations were lower under Scots pine and Nor- way spruce than under hardwood. Litter and soil under silver fir and Douglas-fir were intermediate. Soil Na content was mostly affected by the distance from the Atlantic Ocean to the site [62], as shown by the correlation between this variable and longitudinal localisation of the stands. It is probable that Na content was proportional to the ability of tree species to inter- cept atmospheric depositions. As soils under silver fir and Norway spruce had higher Na content than soils under hard- woods, it suggested that atmospheric deposition was enhanced
The site characteristics, and therefore the soil characteris- tics, were the factors which best explained the ground flora composition. More precisely, the acidity, the nitrogen availability [44] and the C/N ratio of the soil best explained the vegetation
830
L. Augusto et al.
REFERENCES
[1] Allott N., Brennan M., Mills P., Eacrett A., Stream chemistry and forest cover in ten small western Irish catchments, in: Watkins C. (Ed.), Ecological effects of forestation, Redwood Press (UK), Melksham, 1993, pp. 165–177.
[2] Amezaga I., Onaindia M., The effect of evergreen and deciduous coniferous plantations on the field layer and seed bank of native woodlands, Ecography 20 (1997) 308–318.
[3] Anne P., Sur le dosage rapide du carbone organique des sols, Ann.
Agron. 2 (1945) 161–172.
[4] Augusto L., Bonnaud P., Ranger J., Impact of tree species on forest
soil acidification, For. Ecol. Manage. 105 (1998) 67–78.
[5] Aussenac G., Boulangeat C., Interception des précipitations et éva- poration réelle dans des peuplements de feuillus (Fagus sylvatica L.) et de résineux (Pseudotsuga menziesii (Mirb) Franco), Ann. Sci. For. 37 (1980) 91–107.
[6] Balsberg-Pahlsson A.M., Bergkvist B., Acid deposition and soil acidification at a southwest facing edge of Norway spruce and European beech in south Sweden, Ecol. Bull. 44 (1995) 43–53. [7] Berger A.L., Puettmann K.J., Overstory composition and stand structure influence herbaceous plant diversity in the mixed aspen forest of northern Minnesota, Am. Midl. Nat. 143 (2000) 111–125. [8] Bergkvist B., Folkeson L., The influence of tree species on acid deposition, proton budgets and element fluxes in south Swedish forest ecosystems, Ecol. Bull. 44 (1995) 90–99.
[9] Binkley D., Valentine D., Fifty-year biogeochemical effects of green ash, white pine and Norway spruce in a replicated experi- ment, For. Ecol. Manage. 40 (1991) 13–25.
[10] Bolstad P.V., Gower S.T., Estimation of leaf area index in fourteen southern Wisconsin forest stands using a portable radiometer, Tree Physiol. 7 (1990) 115–124.
composition [36]. Some tree species were also discriminated along this gradient: ground vegetation under Norway spruce was typical of more acidic and oligotrophic conditions than ground vegetation under European beech. silver fir was inter- mediate. The tree species effect on species richness and vege- tation diversity was not clearly apparent. Other studies carried out on numerous sites have shown that the tree species effect on vegetation diversity was low [34, 66]. On the other hand, Kirby [37], Amezaga and Onaindia [2], and Fahy and Gormally [24] concluded that planting coniferous tree species, rather than native hardwoods, reduced species richness. The authors explained these differences as the result of thicker litter layers and shadier conditions more often encountered under conifer- ous stands. Certainly, it is established that some herbs are sen- sitive to thick litter layers [33, 57, 58]. Moreover, dense stands reduce ground vegetation cover, especially spring species [48, 50]. However, silvicultural management greatly modifies ground vegetation, even under the same tree species [14, 30, 37, 61]. Tree species with dense canopies (e.g. Norway spruce, silver fir and Douglas-fir) do not reduce spring vegetation if they are thinned [31]. Ovington [48] observed that, on the same site, species richness under a dense Norway spruce stand was less than half that of a more open Norway spruce stand of the same age. It is therefore possible that the variation in silvi- cultural management in the present study obscured somewhat the tree species effect on vegetation richness and diversity. Nevertheless, there were some differences in ground vegeta- tion composition dependent on tree species. The clearest dif- ference was the dominance of mosses under Norway spruce and vascular plants under hardwoods.
[11] Braun-Blanquet J., Plant sociology: the study of plant communities, Fuller G.D., Conard H.S. (Eds.), Koeltz scientific books, Konigs- tein, Germany, 1983.
[12] Bremner J.M., Determination of nitrogen in soil by the Kjeldahl
5. CONCLUSION
method, J. Agric. Sci. 55 (1960) 11–33.
[13] Brown A.H.F., Iles M.A., Water chemistry profiles under four tree species at Gisburn, NW England, Forestry 64 (1991) 169–187. [14] Brunet J., Falkengren-Grerup U., Ruhling A., Tyler G., Regional differences in floristic change in South Swedish oak forests as rela- ted to soil chemistry and land use, J. Veg. Sci. 8 (1997) 329–336. [15] Cinotti B., Evolution des surfaces boisées en France : Proposition de reconstruction depuis le début du XIXe siècle, Rev. For. Fr. 48 (1996) 547–562.
[16] Crozier C.R., Boerner R.E.J., Correlations of understory herb dis- tribution patterns with microhabitats under different tree species in a mixed mesophytic forest, Oecologia 62 (1984) 337–343.
It appears that tree species notably modified the soil chemistry, through the acidity level and the dynamic of biogeochemical cycles. These modifications were related to the variable ability of different tree species to enhance atmospheric deposition, to the characteristics of their litters, and perhaps to the microcli- mate and light transmitted through their canopy. The modifi- cation of these environmental conditions by the trees lead to a modification of the ground vegetation. However, the influence of tree species on ground vegetation was low when shade tree species such as Norway spruce, silver fir and Douglas-fir were heavily thinned.
[17] Cutini A., The influence of drought and thinning on leaf area index estimates from canopy transmittance method, Ann. Sci. For. 53 (1996) 595–603.
[18] Dahlgren R.A., Driscoll C.T., The effects of whole-tree clear-cut- ting on soil processes at the Hubbard Brook Experimental Forest, New Hamphire, USA, Plant Soil 158 (1994) 239–262.
[19] Duchaufour P., Modifications apportées au sol par le reboisement à l’aide d’espèces étrangères à la station (exemples pris en climat atlantique), Rev. For. Fr. 6 (1954) 73–84.
The choice of tree species in forest management has eco- nomical, biogeochemical and ecological consequences over the long term. In terms of soil acidity, the effect of tree species was: (European beech; oaks) < (Douglas-fir; silver fir) < (Scots pine; Norway spruce). These modifications, along with differing microclimates, lead to notable modifications in ground vegetation.
[20] Duchaufour P., Bonneau, M., Une nouvelle méthode de dosage du phosphore assimilable dans les sols forestiers, Bull. Assoc. Fr. Étude Sol, Sci. Sol 4 (1959) 193–198.
However, differences among sites were generally much greater than among the tree species of the same site. Moreover, the tree species effect on the ground vegetation also was con- trolled largely by silvicultural management.
[21] Dulière J.F., Carnol M., Dalem S., Remacle J., Malaisse F., Impact of dolomite lime on the ground vegetation and on potential net N transformations in Norway spruce (Picea abies (L.) Karst) and ses- sile oak (Quercus petraea (Matt.) Lieb.) stands in the Belgian Ardenne, Ann. For. Sci. 56 (1999) 361–370.
Acknowledgements: We thank: Mr Behr for technical assistance; Drs Bréda, Marçais and Montpied for scientific assistance; private forest owners and the Office National des Forêts for providing facil- ities; Mr White, Mr Powell, Mrs Gerson and the INRA translation unit at Jouy-en-Josas for revising the English.
[22] Dupraz C., Lelong F., Bonneau M., Effets des boisements résineux purs sur l’évolution de la fertilité du sol : premiers résultats obtenus sur bassins versants expérimentaux du Mont Lozère (Lozère, France), Ann. Sci. For. 43 (1986) 147–164.
Effects of tree species on vegetation and soil
831
sylvatica L.) and sessile oak (Quercus petraea (Matt.) Lieb.) stands, Ann. For. Sci. 58 (2001) 829–842.
[23] Ellenberg H., Weber H.E., Dall R., Wirth V., Werner W., Paulissen D., Zeigerwerte von Pflanzen in Mitteleuropa, Scripta Geobot. 18 (1992) 1–258.
[45] Nihlgard B., The microclimate in a beech and a spruce forest - a comparative study from Kongalund, Scania, Sweden, Bot. Notiser 5, 122 (1969) 333–352.
[24] Fahy O., Gormally M., A comparison of plant and carabid beetle communities in an irish oak woodland with a nearby conifer plan- tation and clearfelled site, For. Ecol. Manage. 110 (1998) 263–273. [25] Fernandez-Sanjurjo M.J., Fernandez Vega V., Garcia-Rodeja E., Atmospheric deposition and ionic concentration in soils under pine and deciduous forests in the river Sor catchment (Galicia, NW Spain), Sci. Total Environ. 204 (1997) 125–134.
[46] Nihlgard B., Pedological influence of spruce planted on former beech forest soils in Scania, south Sweden, Oikos 22 (1971) 302–314. [47] Nykvist N., Leaching and decomposition of water-soluble organic substances from different types of leaf and needle litter, Stud. For. Suec. 3 (1963) 1–31.
[26] Forgeard F., Gloaguen J.C., Touffet J., Interception des précipita- tions et apports au sol d’éléments minéraux par les eaux de pluie et les pluviolessivats dans une hêtraie atlantique et dans quelques peu- plements résineux de Bretagne, Ann. Sci. For. 37 (1980) 53–71. [27] Frochot H., Picard J.F., Dreyphus P.H., La végétation herbacée,
[48] Ovington J.D., Studies of the development of woodland conditions under different trees. III. The ground flora, Ecology 43 (1955) 1–21. [49] Perala D.A., Alban D.H., Biomass, nutrient distribution and litter- fall in Populus, Pinus and Picea stands on two different soils in Minnesota, Plant Soil 64 (1982) 177–192.
obstacle aux plantations, Rev. For. Fr. 38 (1986) 271–279.
[50] Pigott C.D., The influence of evergreen coniferous nurse-crops on the field layer in two woodland communities, J. Appl. Ecol. 27 (1990) 448–459.
[28] Gloaguen J.C., Touffet J., Évolution du rapport C/N dans les feuilles et au cours de la décomposition des litières sous climat atlantique. Le hêtre et quelques conifères, Ann. Sci. For. 39 (1982) 219–230.
[51] Roberts A.J., Russel C., Walker G.W., Kirby K.J., Regional varia- tion in the origin, extend and composition of Scottish woodland, Bot. J. Scotl. 46 (1992) 167–189.
[29] Gower S.T., Son Y., Differences in soil and leaf litterfall nitrogen dynamics for five forest plantations, Soil Sci. Soc. Am. J. 56 (1992) 1959–1966.
[30] Hannerz M., Hanell B., Effects on the flora in Norway spruce forests following clearcutting and shelterwood cutting, For. Ecol. Manage. 90 (1997) 29–49.
[52] Rouiller J., Guillet B., Bruckert S., Cations acides, échangeables et acidités de surface. Approche analytique et incidence pédogénéti- que, Bull. Assoc. Fr. Étude Sol, Sci. Sol 2 (1980) 161–175. [53] Saetre P., Sturesson-Saetre L., Brandtberg P.O., Lundkvist H., Bengtsson J., Ground vegetation composition and heterogeneity in pure Norway spruce and mixed Norway spruce-birch stands, Can. J. For. Res. 27 (1997) 2034–2042.
[31] Hill M.O., Jones E.W., Vegetation changes resulting from affores- tation of rough grazings in Caeo forest, south Wales, J. Ecol. 66 (1978) 433–456.
[54] SAS institute Inc., SAS/STAT user’s guide, Version 6, third edi-
tion, Cary, North Carolina USA: SAS Institute Inc, 1990.
[32] Hinsinger P., Elsass F., Jaillard B., Robert M., Root-induced irre- versible transformation of a trioctahedral mica in the rhizosphere of rape, J. Soil Sci. 44 (1993) 535–545.
[55] Smith N., Estimating leaf area index and light extinction coeffi- cients in stands of Douglas-fir (Pseudotsuga menziesii), Can. J. For. Res. 23 (1993) 317–321.
[33] Holderegger R., Effects of litter removal on the germination of Ane-
mone nemorosa L, Flora 191 (1996) 175–178.
[56] Switzer G.L., Nelson L.E., Smith W.H., The mineral cycling in forest stands, in: Tenessee Valley Authority (Ed.), Forest Fertiliza- tion, theory and practice, 1968, pp. 1–9.
[57] Sydes C., Grime J.P., Effect of tree leaf litter on herbaceous vege- tation in deciduous woodland. I - Field investigations, J. Ecol. 69 (1981) 237–248.
[58] Sydes C., Grime J.P., Effects of tree leaf litter on herbaceous vege- tation in deciduous woodland. II. An experimental investigation, J. Ecol. 69 (1981) 249–262.
[34] Hong Q., Klinka K., Sivak B., Diversity of the understory vascular vegetation in 40-year-old and old-growth forest stands on Vancou- ver island, British Columbia, J. Veg. Sci. 8 (1997) 778–780. [35] Hornung M., Reynolds B., Stevens P.A., Hugue S., Water quality changes from input to stream, J. Soil Sci. 41 (1990) 223–240. [36] Hutchinson T.F., Boerner E.J., Iverson L.R., Sutherland S., Sutherland E.K., Landscape patterns of understory composition and richness across a moisture and nitrogen mineralization gradient in Ohio (USA) Quercus forests, Plant Ecol. 144 (1999) 177–189.
[37] Kirby K.J., Changes in the ground flora under plantations on
[59] Tamm C.O., Om bestämning av de oorganiska komponenterna i markens gelcomplex, Medd Statens, Skogsförsökanst, 19 (1922) 385–404.
ancient woodland sites, Forestry 61 (1988) 317–338.
[60] Tutin T.G., Heywood V.H., Burges N.A., Moore D.M., Valentine D.H., Walters S.M., Webb D.A., Flora Europaea, Cambridge Uni- versity Press, Cambridge, 5 vol, 1966–1980.
[61] Tyle G., Interacting effects of soil acidity and canopy cover on the species composition of field-layer vegetation in oak/hornbeam forests, For. Ecol. Manage. 28 (1989) 101–114.
[38] Klinka K., Chen H.Y.H., Wang Q., de Montigny L., Forest canopies and their influence on understory vegetation in early-seral stands on West Vancouver island, Northwest Sci. 70 (1996) 193–200. [39] Knapp R., The influence of different tree species on the plants growing beneath them (in German), Ber. Dtsch. Bot. Ges. 71 (1958) 411–421.
[40] Lemée G., Recherches sur les écosystèmes des réserves biologiques de la forêt de Fontainebleau. III. Influence du peuplement grami- néen sur les caractères et l’activité biologique du mull acide, Rev. Écol. Biol. Sol 12 (1975) 157–167.
[62] Ulrich E., Lanier M., Schneider A., Dépôts atmosphériques et con- centrations des solutions du sol, Rapport scientifique sur les années 1993 et 1994, Office National des Forêts (Éd.), Paris, France, 1998. [63] Warren S.L., Skroch W.A., Perry K.B., Monaco T.J., Vegetation management: Its influence on survival and early growth of Fraser fir and Norway spruce, J. Amer. Soc. Hort. Sci. 112 (1987) 955–962. [64] Warren S.L., Monaco T.J., Skroch K.B., Effect of vegetation mana- gement on soil nutrients and nutrient content of herbaceous vegeta- tion, J. Amer. Soc. Hort. Sci. 112 (1987) 962–968.
[41] Leyval C., Berthelin J., Effets rhizosphèriques de plantes indicatrices de grands types de pédogènèse sur quelques groupes bactériens modifiant l’état des minéraux, Rev. Écol. Biol. Sol 20 (1983) 191–206. [42] Mikola P., The effect of tree-species on the biological properties of forest soil, National Swedish Environmental Protection Board, Report number 3017, 1985.
[65] Wedraogo F.X., Belgy G., Berthelin J., Seasonal nitrification measurements with different species of forest litter applied to gra- nite-sand-filled lysimeters in the field, Biol. Fertil. Soils 15 (1993) 28–34.
[43] Ministère de l’Agriculture de la Pêche et de l’Alimentation, La forêt et les industries du bois, Collection GraphAgri-Forêt-Bois, Édition bilingue Français-Anglais, 1996.
[44] Mission L., Du Bus de Warnaffe G., Jonard M., Effects of fertiliza- tion on the vascular ground vegetation of European beech (Fagus
[66] Whitney G.G., Foster D.R., Overstorey composition and age as determinants of the understorey flora of woods of central New England, J. Ecol. 76 (1988) 867–876.