
Standard Methods of Main Parameters 43
BOD could be achieved by the biosensor-based methods (Liu and Mattiasson, 2006).
These alternative techniques are presented in the following paragraphs.
1.3.3.2 Chemical Oxygen Demand
The COD test is now widely used as a means of measuring the organic strength
of domestic and industrial waste, often replacing BOD as the primary parameter in
wastewater. It is based upon the fact that most organic compounds can be oxidised by
the action of strong oxidising agents under acid conditions (Bourgeois et al., 2001).
The measurement of COD is carried out on the basis of the ‘closed reflux, colori-
metric method’ described in water quality norms (NF T90-101/ISO 6060:1989/EPA
method 410.3). Sample, blanks and standards in sealed tubes are heated in an oven
or block digestor in the presence of dichromate at 150 ◦C. After 2 h, the tubes
are removed from the oven or digestor, cooled and measured on a UV/VIS spec-
trophotometer at a wavelength of 600 nm. Chlorides are quantitatively oxidised by
dichromate and represent a positive interference. Mercuric sulfate is added to the
digestion tubes to complex the chlorides.
The described method essentially consists of measuring the amount of oxygen
required. It takes into account any substance or element presenting a reducing char-
acter. Some reducer salts [nitrites, sulfides and iron(II)] are also oxidised but the
equivalence dissolved organic carbon (DOC) values are known (Table 1.3.3). More-
over, the aromatic hydrocarbons and the pyridine are not completely oxidised. Some
very volatile organic compounds are not oxidised because of evaporation. In addi-
tion, the not ramified aliphatic compounds are oxidised only with the presence of
sulfuric acid – sulfuric silver.
Organic matter is converted to carbon dioxide and water regardless of the bio-
logical assimilability of the substances. For example, glucose and lignin are both
oxidised completely.
This method is applicable to water whose DCO is higher than 30 mg l−1and
whose chloride concentration (expressed as ion chloride) is lower than 2000 mg l−1.
Table 1.3.3 COD equivalence of some reducer salts (Berne and Cordonnier,
1991. Reproduced by permission of Editions TECHNIP Paris)
Compound Ion COD (mg O2mg−1)
Cyanide CN−1–2.9
Thiocyanate SCN−0.6–1.5
Sulfide S2−2
Sulfur S◦1.5
Thiosulfate S2O2−
30.57
Tetrathionate S4O2−
60.5
Sulfite SO2−
30.2

44 Standard Methodologies
The maximum value of DCO which can be given, under the defined conditions, on
a sample not diluted, is 700 mg l−1.
The major advantage of the COD test is that the results can be obtained within a
relatively short time (approximately 2 h instead of 5 days for the BOD5). In the case
where there is no change in wastewater quality and no evolution time, a correlation
between COD and BOD values can be established. DCO values are correct only when
the effluent is completely biodegradable and not have reducer salt. Nevertheless,
when used in conjunction with BOD, the COD test can provide an indication of the
biodegradability of the wastewater by calculating the BOD/COD ratio. It can also
be helpful in relation to toxic conditions.
One of the main limitations of the COD test is its inability to differentiate between
biodegradable and biologically inert organic matter on its own. Therefore, the use
of chemicals such as acid, chromium, silver and mercury produce liquid hazardous
waste which requires disposal (Bourgeois et al., 2001). It is interesting to develop
alternative methods without toxic reagents (biosensors, optical sensors, etc.).
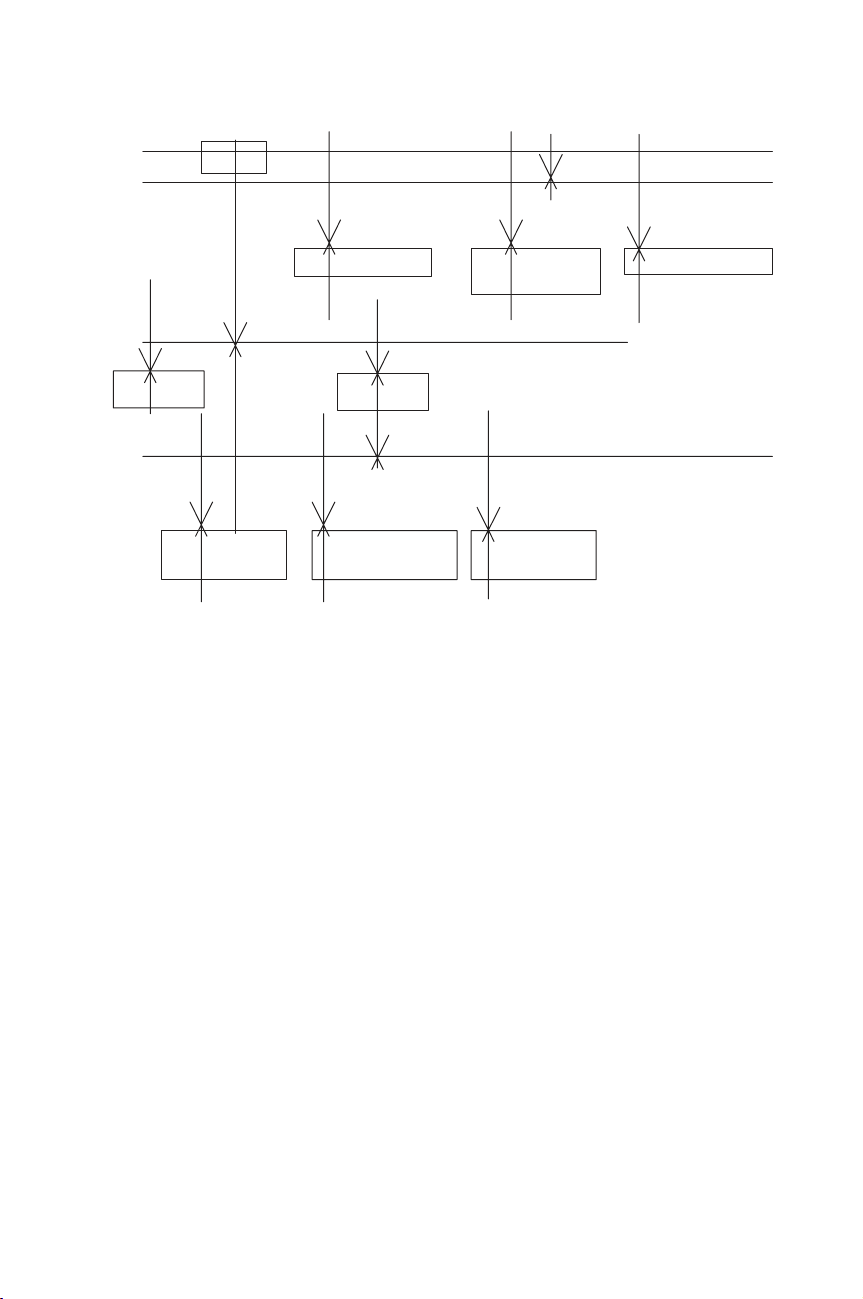
1.3.3.3 Total Organic Carbon
Different forms of carbon can be found in wastewater (Figure 1.3.1), such as mineral
or organic, volatile or not. The relevant parameter for the global determination of
the organic pollution is the TOC.
Two main techniques are usually used for the conversion of organic carbon to
carbon dioxide for TOC determination. In the first one, called wet chemical oxidation
(WCO), oxidation is performed at low temperature by UV light and the addition of
persulfate reagent, after removal of inorganic carbon by acidification and aeration.
The second uses a catalyst at high temperature (650–900 ◦C) and is known as high
temperature catalytic oxidation (HTCO).
Total carbon
Mineral carbon
(CO3
2--, HCO3
--, H2CO3)
Total organic carbon
(TOC)
Purged organic carbon
(volatile)
Not-purged
organic carbon
Dissolved organic carbon
(DOC)
Solid organic carbon
(TSS)
Figure 1.3.1 Different forms of carbon (Minist`ere de l’am´enagement du territoire et de
l’environnement, 2000)

Standard Methods of Main Parameters 45
Significant differences and conflicting results between the two techniques have
been shown (Thomas et al., 1999). As a result, both methods are still being investi-
gated and their accuracy is still subject to controversy (Bourgeois et al., 2001). The
use of TOC is difficult in a wastewater treatment plant because of the lack of cor-
relation between TOC and BOD. In fact TOC only measures the content of organic
compounds, not other substances that may contribute to BOD (APHA, 1992).
1.3.3.4 Total Suspended Solids
The TSS (in mg l−1) is measured by weighing after filtration or centrifugation and
drying at 105 ◦C (NF T90-105 standard). The centrifugation method is used when
filtration is not applicable because of a high risk of clogging of filters.
The decanted solids correspond to the TSS which decant during a time fixed
conventionally at 2 h. The decanted solids (in cm3l−1) are measured by direct
reading of the volume occupied at the bottom of a decantation cone.
The colloidal solids represent the difference between the TSS and decanted solids.
The particle size roughly lies between 10−8mm and 10−2mm.
In addition, the TSS are constituted of mineral solids and organic solid, or sus-
pended volatile solids. Organic solid can be determined by the calcination test to
180 ◦C (NF T90-029 and NF EN 872 standards), but could not be very precise due to
partial or total decomposition of certain salts (bicarbonates, chlorides, nitrates, etc.).
1.3.3.5 Specific Organic Compounds: Phenols
Phenols belong to the base, neutral and acid organics family. Two methods are usually
used: extraction coupled with gas chromatography analysis (ISO 8165-1:1992, 40
CFR Part 136, Appendix A, method 625) and extraction with colorimetry (ISO 6439:
1990, EPA method 420.1).
The first method is applicable to the determination of extractable organics in
municipal and industrial discharges.
A 1 l aliquot of sample is adjusted to pH >11 and extracted in a separatory funnel
with three 60 ml portions of methylene chloride or with 200–500 ml methylene
chloride in a continuous extraction apparatus. The pH of the sample is then adjusted
to <2 and the extraction procedure is repeated. The extracts are concentrated with
a Kuderna–Danish concentrator fitted with a three-ball Snyder column. The final
volume is adjusted to 1 ml. The organic priority pollutants are determined in the
extracts by capillary column or packed column gas chromatography – mass spec-
trometry. The interferences are contaminants from glassware or compounds that are
co-extracted with sample.
The second method determines phenolic compounds in drinking, surface and
saline waters or domestic and industrial wastes. Phenolic materials react with 4-
aminoantipyrine in the presence of potassium ferricyanide at high pH to form a

46 Standard Methodologies
stable reddish-brown coloured antipyrine dye. The amount of colour produced is
proportional to the concentration of phenolic materials. However, the colour response
of all phenolic compounds is not equivalent and the results (which are compared
against pure phenol standards) represent the minimum concentration of phenolic
compounds in the sample.
Interferences from sulfur compounds are eliminated by acidifying the sample to
pH <4 with phosphoric acid and aerating briefly by stirring and adding copper sul-
fate. Oxidising agents can oxidise phenolics, causing results to be low. The presence
of oxidising agents is rested for with potassium iodide strips. If present, they are
removed when sampling by adding ferrous ammonium sulfate in excess.
1.3.3.6 Mineral Compounds: Total Nitrogen and Total Phosphorus
Total nitrogen in water corresponds to nitrate and nitrite compounds. They are anal-
ysed by colorimetric method with an automated hydrazine reduction (NF EN ISO
11732, EPA method 352.1).
This method is applicable to drinking and surface water, and domestic and indus-
trial wastes. The applicable range of this method is 0.01–10 mg l−1nitrate–nitrite
nitrogen. Nitrate is reduced to nitrite with hydrazine sulfate and the nitrite (that orig-
inally present plus reduced nitrate) is determined by diazotising with sulfanilamide
and coupling with N-(naphthyl)-ethylenediamine dihydrochloride to form a highly
coloured azo dye which is measured colorimetrically. Sample colour that absorbs in
the photometric range used for analysis will interfere. The apparent NO−
2and NO−
3
concentrations varied ±10 % with concentrations of sulfide ion up to 10 mg l−1.
Phosphorus is also analysed by colorimetry (NF EN 1189, ISO 6878:1998, EPA
method 365.1). This method is based on reactions that are specific for the orthophos-
phate ion. Thus, depending on the prescribed pretreatment of the sample, the various
forms of phosphorus that may be determined are given in Figure 1.3.2.
Ammonium molybdate and antimony potassium tartrate react in an acid medium
with dilute solutions of phosphorus to form an antimony-phosphomolybdate com-
plex. This complex is reduced to an intensely blue-coloured complex by ascorbic
acid. The colour is proportional to the phosphorus concentration. The applicable
range is 0.01–1 mg P l−1.
Only orthophosphate forms a blue colour in this test. Polyphosphates (and some
organic phosphorus compounds) may be converted to the orthophosphate form by
manual sulfuric acid hydrolysis. Organic phosphorus compounds may be converted
to the orthophosphate form by manual persulfate digestion. The developed colour is
measured automatically.
No interference is caused by copper, iron, or silicate at low concentrations. How-
ever, high iron concentrations can cause precipitation, and subsequent loss, of phos-
phorus. The salt error for samples ranging from 5 to 20 % salt content was found
to be less than 1 %. Arsenate is determined similarly to phosphorus and should be
considered when present in concentrations higher than phosphorus.
Improvement in Quality of Wastewater Analysis 47
sample
Orthophosphate Hydrolyzable &
Orthophosphate
Diss. Hydrolyzable &
Orthophosphate
Phosphorous
Dissolved
phosphorous
Filtrate
Total Sample (no filtration)
Persulfate
Digestion &
Colorimetry
Persulfate
Digestion &
Colorimetry
Residue
Filter (through 0.45µ membrane filter)
Dissolved
orthophosphate
Direct
Direct
colorimetry
colorimetry
H2SO4
Hydrolysis &
Colorymetry
H2SO4
Hydrolysis &
Colorymetry
Figure 1.3.2 Analytical scheme for differentiation of phosphorus forms (EPA method 365.1)
1.3.4 IMPROVEMENT IN QUALITY
OF WASTEWATER ANALYSIS
Due to the demand for reliable and comparable methods, performance requirements
have been established at national and international level by implementation of accred-
itation systems, QA guidelines and standards (e.g. ISO 9000 and EN 45 000 series),
organisation of interlaboratory studies, proficiency testing and production of labo-
ratory and certified reference materials (Anklam et al., 2002; see also Chapter 1.6).
Indeed, any method proposed to become official must be validated in a collabora-
tive trial study, resulting in defined method performance characteristics, while the
framework for the design and conduction of such collaborative trial studies as well as
the statistical evaluation are also defined in appropriate protocols (Horwitz, 1995).
Any method that has been successfully validated according to these protocols can
be recognised as an official method for use in legal cases or for international trade
purpose. In addition to these performance criteria, economical and prevention strat-
egy aspects have also lately become important in method development. Demands
for fast and efficient procedures (consumption of chemicals and materials) and the
ability for automation are highly desired.
The objective of the method validation is to demonstrate that the defined system
(which may include various steps in the analytical procedure, and may be valid for a
restricted matrix) produce acceptably accurate, repeatable and reproducible results


![509 mẫu câu tiếng Anh giao tiếp thông dụng nhất: Kho mẫu câu [năm hiện tại]](https://cdn.tailieu.vn/images/document/thumbnail/2026/20260515/baobinh_011/135x160/121778822152.jpg)


%20--%3e%3cdefs%3e%3cstyle%3e%20.st0%20{%20fill:%20%23fff;%20}%20.st1%20{%20fill:%20%237800fa;%20}%20%3c/style%3e%3c/defs%3e%3cpath%20class='st1'%20d='M117.78,12.18H43.11c2.9,3.47,4.65,7.94,4.65,12.82,0,5.6-2.3,10.66-6.01,14.29h76.02l7.22-13.56-7.22-13.56Z'/%3e%3cg%3e%3cpath%20class='st0'%20d='M53.58,26.17h-.59v-1.46h.59v-4.96h2.83c1.78,0,2.67.94,2.67,2.82v5.76c0,1.87-.89,2.81-2.67,2.81h-2.83v-4.96ZM55.36,21.37v3.34h1.1v1.46h-1.1v3.34h1.01c.61,0,.91-.37.91-1.1v-5.93c0-.74-.3-1.1-.91-1.1h-1.01Z'/%3e%3cpath%20class='st0'%20d='M65.99,31.14h-1.8l-.31-2.07h-2.19l-.31,2.07h-1.64l1.82-11.39h2.62l1.82,11.39ZM65.28,18.04c-.25.46-.51.77-.75.94-.21.15-.47.22-.79.22-.26,0-.57-.07-.92-.22l-.38-.15c-.14-.05-.26-.07-.37-.07-.3,0-.53.18-.71.54l-.91-.68c.25-.46.51-.77.75-.94.21-.14.48-.21.79-.21.26,0,.57.07.92.21l.38.15c.14.05.26.07.37.07.3,0,.53-.18.71-.54l.91.68ZM61.91,27.52h1.73l-.87-5.76-.87,5.76Z'/%3e%3cpath%20class='st0'%20d='M74.53,26.89v1.52c0,1.91-.89,2.86-2.67,2.86s-2.67-.95-2.67-2.86v-5.93c0-1.91.89-2.86,2.67-2.86s2.67.95,2.67,2.86v1.11h-1.69v-1.22c0-.75-.31-1.12-.93-1.12s-.93.37-.93,1.12v6.15c0,.74.31,1.11.93,1.11s.93-.37.93-1.11v-1.63h1.69Z'/%3e%3cpath%20class='st0'%20d='M81.4,31.14h-1.8l-.31-2.07h-2.19l-.31,2.07h-1.64l1.82-11.39h2.62l1.82,11.39ZM75.9,19.2l1.52-1.91h1.71l1.51,1.91h-1.61l-.76-.95-.75.95h-1.61ZM77.32,27.52h1.73l-.87-5.76-.87,5.76ZM83.1,15.99l-1.76,1.91h-1.26l1.17-1.91h1.86Z'/%3e%3cpath%20class='st0'%20d='M84.86,19.75c1.78,0,2.67.94,2.67,2.82v1.48c0,1.87-.89,2.81-2.67,2.81h-.85v4.28h-1.79v-11.39h2.64ZM84.01,21.37v3.86h.85c.58,0,.87-.36.87-1.08v-1.71c0-.71-.29-1.07-.87-1.07h-.85Z'/%3e%3cpath%20class='st0'%20d='M93.51,19.75c1.78,0,2.67.94,2.67,2.82v1.48c0,1.87-.89,2.81-2.67,2.81h-.85v4.28h-1.79v-11.39h2.64ZM92.66,21.37v3.86h.85c.58,0,.87-.36.87-1.08v-1.71c0-.71-.29-1.07-.87-1.07h-.85Z'/%3e%3cpath%20class='st0'%20d='M98.8,31.14h-1.79v-11.39h1.79v4.88h2.03v-4.88h1.83v11.39h-1.83v-4.88h-2.03v4.88Z'/%3e%3cpath%20class='st0'%20d='M105.36,24.55h2.46v1.62h-2.46v3.34h3.09v1.63h-4.88v-11.39h4.88v1.63h-3.09v3.18ZM108.17,17.29l-1.76,1.91h-1.26l1.17-1.91h1.86Z'/%3e%3cpath%20class='st0'%20d='M112.2,19.75c1.78,0,2.67.94,2.67,2.82v1.48c0,1.87-.89,2.81-2.67,2.81h-.85v4.28h-1.79v-11.39h2.64ZM111.35,21.37v3.86h.85c.58,0,.87-.36.87-1.08v-1.71c0-.71-.29-1.07-.87-1.07h-.85Z'/%3e%3c/g%3e%3ccircle%20class='st1'%20cx='25'%20cy='25'%20r='20'/%3e%3cpath%20class='st0'%20d='M32.78,19.27c2.92,0,4.43,2.55,5.28,5.33l.71,2.17c.14.38-.33.75-.71.75h-5.61c.19-.33.24-.71.09-1.08l-.75-2.45c-.43-1.32-.99-2.64-1.79-3.77.75-.57,1.65-.94,2.78-.94h0ZM25,18.38c3.25,0,4.9,2.78,5.89,5.89l.76,2.45c.14.42-.33.8-.8.8h-11.69c-.42,0-.94-.38-.8-.8l.75-2.45c.99-3.11,2.64-5.89,5.89-5.89h0ZM25,11.35c1.74,0,3.11,1.37,3.11,3.11s-1.37,3.11-3.11,3.11-3.11-1.41-3.11-3.11,1.41-3.11,3.11-3.11h0ZM17.27,19.27c1.08,0,1.98.38,2.73.94-.8,1.13-1.37,2.45-1.74,3.77l-.8,2.45c-.14.38-.05.75.09,1.08h-5.56c-.42,0-.9-.38-.75-.75l.71-2.17c.9-2.78,2.41-5.33,5.33-5.33h0ZM17.27,12.91c1.51,0,2.78,1.27,2.78,2.83s-1.27,2.83-2.78,2.83-2.83-1.27-2.83-2.83,1.27-2.83,2.83-2.83h0ZM32.78,12.91c1.56,0,2.78,1.27,2.78,2.83s-1.23,2.83-2.78,2.83-2.83-1.27-2.83-2.83,1.27-2.83,2.83-2.83h0ZM27.07,28.56v.09c0,.57-.24,1.08-.61,1.46h0v.05c-.38.33-.9.57-1.46.57s-1.08-.24-1.46-.61h0c-.38-.38-.61-.9-.61-1.46v-.09h1.41v.09c0,.19.05.38.19.47v.05c.09.09.28.19.47.19s.38-.09.47-.19v-.05c.14-.09.24-.28.24-.47t-.05-.09h1.41ZM30.99,28.56v.09c0,1.65-.66,3.16-1.74,4.24-1.08,1.08-2.59,1.79-4.24,1.79s-3.16-.71-4.24-1.79l-.05-.05c-1.04-1.08-1.7-2.55-1.7-4.2v-.09h1.41v.09c0,1.27.47,2.4,1.27,3.25h.05c.85.85,1.98,1.37,3.25,1.37s2.4-.52,3.25-1.37c.85-.8,1.37-1.98,1.37-3.25v-.09h1.37ZM34.99,28.56v.09c0,2.78-1.13,5.28-2.92,7.07-1.79,1.79-4.29,2.92-7.07,2.92s-5.23-1.13-7.07-2.92c-1.79-1.79-2.92-4.29-2.92-7.07v-.09h1.41v.09c0,2.4.94,4.53,2.5,6.08,1.56,1.56,3.72,2.5,6.08,2.5s4.52-.94,6.08-2.5c1.56-1.56,2.5-3.68,2.5-6.08v-.09h1.41Z'/%3e%3c/svg%3e)