
100 Reference Materials
Materials and Measurements, IRMM), the certification committee is composed of
representatives from EU countries and Associated States, covering a wide field of
expertise in chemical, biological and physical measurement sectors.
Another approach that is being used for the certification of RMs is actually based
on the voluntary participation of expert laboratories in interlaboratory schemes (e.g.
proficiency testing), using various analytical methods applied by different labora-
tories (Ihnat, 1997). This approach is less prone to control and there are generally
no technical discussions of the results but rather robust statistics to detect and re-
move possible outliers (e.g. based on z-scores). This type of study is certainly useful
for evaluating the performance of laboratories/methods but is not generally recom-
mended for certification unless highly skilled laboratories are involved.
1.6.8.2 Assigned Values
With respect to not-certified materials, there is an interest to obtain good reference
values (assigned values). The same approach and rules as the ones used for certi-
fication to, in principle, needed to obtain good assigned values. A high degree of
accuracy for these values is rarely mandatory for a LRM used for routine quality
control checks (control charts) but it should be attempted for each RM that is used in
method performance studies. Assigned values may be established through measure-
ments carried out in the framework of interlaboratory studies involving experienced
laboratories (they hence correspond to ‘consensus’ values), which is very similar
indeed to the approach followed for certification. The main difference between a
good assigned value and a certified value is actually linked to the (legally binding)
guarantee given by the producer (certificate of analysis) and the procedure used to
obtain this guarantee.
1.6.9 TRACEABILITY OF REFERENCE MATERIALS
Traceability is defined as a property of a measurement or the value of a standard
whereby it can be related to stated references, usually national or international stan-
dards, through an unbroken chain of comparisons all having stated uncertainties
(ISO, 1993).
CRMs and traceability are closely connected since certified values and their uncer-
tainty should, in principle, be linked to established references. In theory, the certified
value of a CRM should be traceable to the amount of substance of the element or
compound of concern.
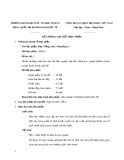
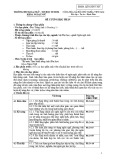
The establishment of a ‘hierarchy’ of RMs has been proposed by Pan (1997).
The author pinpointed that it is difficult, if not impossible, to trace all matrix CRMs
to primary RMs, because of matrix effects, the variety of sample composition and
substances, etc. In addition, factors influencing the analytical process (e.g. homo-
geneity of the CRM) have an effect on the certified values (Figure 1.6.6).

Traceability of Reference Materials 101
True value
Global and local
comparability
CRM, PT schemes
accreditation
Internal comparability
International Quality Control, LRM
Appropriate calibration
Measurement of samples
Figure 1.6.6 Traceability hierarchy shows how to achieve results close to the true values
The classification proposed provided the main criteria for establishing a hierarchy
in the traceability chain for CRMs:
rmetrological quality of methods used for certifying values of the CRM;
rhomogeneity and stability;
rcalculation of uncertainty;
rmetrological competence and recognition of the producer at the national and/or
international level;
rdemonstration of traceability.
Numerous chemical measurements are carried out, for which RMs cannot readily
be prepared owing to their instability (Richter and Dube, 1997). In other cases, RMs
may be available but their matrices are significantly different from that of the analysed
sample, and the reference used to demonstrate the traceability of the results is then
questionable. Some CRMs are directly traceable to SI units and open the possibility
of traceability of measurements to these units, e.g. high purity substances, stable
isotope calibrants for IDMS, playing the role of primary RMs (Richter and Dube,
1997).
The user of a CRM and of certified values should be informed about all the
aspects of traceability that have directed the preparation and certification of the RM,
the technical explanations on the rejection of outlying results, the sources of error,
the procedures of recovery evaluation (based on a spiking procedure or the analysis
of another CRM), the available documentation on the CRMs used to validate the
certification methods, etc.

102 Reference Materials
1.6.10 EVALUATION OF ANALYTICAL RESULTS USING
A MATRIX CERTIFIED REFERENCE MATERIAL
This section will examine how an analytical result may be evaluated in comparison
with the certified value of a matrix CRM. The approach described is adapted from
the procedure proposed by Walker and Lumley (1999). The general use of RMs in a
validation process of a method is described in detail by them (Walker and Lumley,
1999). The use of a matrix CRM will be based on the evaluation of an analytical
result (x) as compared with a certified value (μ) of the CRM. The error on the
analytical result () is calculated using the formula: =x−μ.
Considering the random errors of the method, the value of will likely not be
equal to zero, even if the result is not affected by any systematic error. The greater
the random errors (i.e. the poorer the precision), the greater the value of and
hence the more difficult to detect the occurrence of a systematic error. The precision
is, therefore, a critical parameter that should not be underestimated when evaluating
the trueness of a method. Walker and Lumley (1999) distinguish the laboratory
internal standard deviation, si, characterized by the measurement repeatability of
which the estimate should be calculated on the basis of at least seven repetitions of
CRM analyses, and the between-laboratory standard deviation, se, which is more
difficult to estimate. The authors propose several approaches to calculate this latter
parameter:
(1) The reproducibility, sR, may be estimated by replicate analyses (at least 7,
preferably up to 20) carried out over a given period of time (if possible over 3
months).
(2) The between-laboratory standard deviation, se, may also be estimated in the
framework of any method validation interlaboratory study in which the labora-
tory will know the repeatability values, sr, and the reproducibility values, sR,of
the method according to the document summarizing the results of the study. The
value of sewill hence be equal to √(s2
R−s2
r).
(3) When the CRM has been characterized in the framework of an interlaboratory
study, information on the between-laboratory standard deviation are generally
given in the certification report of the material. If the method to be tested is
similar to one of those used for the certification of the RM, the value of segiven
in the report may be used.
(4) Predicted values found in the literature may also enable the estimate of se. This
type of information is available in the agro-food sector but few values compar-
atively exist in the sector of water analysis.
(5) In the absence of any information, an estimate of semay be obtained from the
value of siaccording to the formula: se≈2si.

Evaluation of Analytical Results Using a Matrix Certified Reference Material 103
The precision σof an analytical result of a matrix CRM will be calculated by
combination of two components:
σ=√s2
e+s2
i
n
where nis the number of replicates of CRM analyses. In general, the value siis
smaller than the value of se(typically by a factor of 2 as indicated above). The fact
that nis at least equal to 7 means that sewill represent the main contribution of σ.
At first sight, it could appear sufficient to base the estimate of the precision σ
of a method used by an individual laboratory on the sole value of si. However, si
reflects the random dispersion of results of a series around their mean, which is
itself randomly distributed around the CRM certified value with a dispersion that is
characterized by the value se. Therefore, the combination of siand se(as indicated
above) is used to describe the overall dispersion of the results around the certified
value, which is taken as the true value (Walker et Lumley, 1999).
The parameter semeasures the sources of random errors that cannot be evaluated
by replicate analyses in a single laboratory, but however contribute to the result
dispersion around the certified value (true or assigned value). An example of random
error is the possible variation of the final volume of a sample extract before its
introduction in a measurement instrument, without taking care of the variations
of ambient temperature. Such volume variations would not be significant for the
estimate of the repeatability and would therefore not be considered in the calculation
of si. However, the same measurements carried out by different laboratories (or by
a single laboratory over a given period of time) would be suject to random errors
due to variations of the ambient temperature. The effects of such variations would
be included in the term se.
It is also useful to remember that when a laboratory analyses a matrix CRM, it
actually takes an effective part in an ‘interlaboratory study’ (if the certified values
have indeed been measured on the basis of such study). Under these circumstances,
it is clearly appropriate that the component seof the precision be considered when a
laboratory compares its results to CRM values. This is analogous to the comparison
of laboratory results in the framework of proficiency testing schemes using zscores
[see additional information in Quevauviller (2001)].
If the information on the value siis available (e.g. the repeatabilty value srof
the method as validated through an interlaboratory study), a χ2test may then be
carried out that will establish whether si(measured by the laboratory) is acceptable,
i.e. whether the laboratory performs its method with a sufficient precision. However,
even if siis significantly greater than sr, if the measured value s2
i/√nis small in
comparison to s2
e, there will be little or no benefit to repeat a series of measure-
ments of a CRM with the aim to obtain a smaller value of si(Walker and Lumley,
1999).

104 Reference Materials
The estimate of the possible occurrence of systematic errors will be based on a
statistical test aiming to evaluate whether the value is significantly different from
zero. If it is not the case, it is possible to conclude that no systematic error has been
demonstrated. A test that is currently used is based on bracketing the value in
an interval with limits of ±2σin which it is estimated that no systematic error has
occurred: −2σ<<2σ.
The affirmation that no systematic error has occurred has to be considered with
some care. It is indeed possible that errors are left undetected, e.g. in the case of
positive and negative errors, which compensate each other. As previously mentioned,
the choice of the ±2σinterval means that the confidence level of this conclusion is
about 95 %. The adoption of limits ±3σwould permit to obtain a confidence level
of 99.7 %. This is equivalent to the calculation of zscores used in proficiency testing
schemes [as a reminder, z=(x−X)/σ , the value of σbeing based, in this case, on
the standard deviation resulting from the test].
It is important that the value of σbe a reliable estimate of the measurement pre-
cision. Among the five above-described approaches, procedure (1) implies that at
least seven replicate analyses be carried out (which is generally considered suffi-
cient). However, if the method has been previously studied (enabling to be obtained
a good estimate of the standard deviation of the measurement for the considered
matrix) the number of CRM analyses may be less than seven, although the minimum
is to duplicate the analysis. A single analysis may be envisaged where the laboratory
is confident in its statistical control. The value of nused for the calculation of σ
should obviously reflect the number of replicate analyses effectively carried out on
the CRM.
Walker and Lumley (1999) give an example of application related to water analy-
sis: A water CRM containing certified concentrations of herbicides (LCG 1004)
is analysed six times. The certified value of simazine is equal to (26.7 ±2.0) µg
kg−1, and the values obtained by the laboratory are, respectively, 29.4, 24.9, 26.4,
25.7, 22.0 and 23.5, corresponding to a mean concentration of 25.3 µgkg
−1and
a standard deviation of 2.5 µgkg
−1. The adopted value for seis 5.2 µgkg
−1,
based on the measurement of the measurement reproducibility. The value of σ
is, therefore, equal to: σ=√[(5.2)2+(2.5)2/6] =5.3µgkg
−1.
The calculated value of obtained is: 25.3−26.7=−1.4µgkg
−1.
It is hence verified that this value responds to the conditions of acceptability
of the method, i.e. −10.6<1.4<10.6.
Let us note once more that the validity of the above-described test depends upon
the validity of the adopted values for siand se. If these values are erroneous, the
value of σwill be also erroneous, and the test will lead to wrong conclusions.
In some cases, it appears necessary to take into account the uncertainty of the
certified value of the CRM (if this uncertainty is significantly different from σ) and


![509 mẫu câu tiếng Anh giao tiếp thông dụng nhất: Kho mẫu câu [năm hiện tại]](https://cdn.tailieu.vn/images/document/thumbnail/2026/20260515/baobinh_011/135x160/121778822152.jpg)


%20--%3e%3cdefs%3e%3cstyle%3e%20.st0%20{%20fill:%20%23fff;%20}%20.st1%20{%20fill:%20%237800fa;%20}%20%3c/style%3e%3c/defs%3e%3cpath%20class='st1'%20d='M117.78,12.18H43.11c2.9,3.47,4.65,7.94,4.65,12.82,0,5.6-2.3,10.66-6.01,14.29h76.02l7.22-13.56-7.22-13.56Z'/%3e%3cg%3e%3cpath%20class='st0'%20d='M53.58,26.17h-.59v-1.46h.59v-4.96h2.83c1.78,0,2.67.94,2.67,2.82v5.76c0,1.87-.89,2.81-2.67,2.81h-2.83v-4.96ZM55.36,21.37v3.34h1.1v1.46h-1.1v3.34h1.01c.61,0,.91-.37.91-1.1v-5.93c0-.74-.3-1.1-.91-1.1h-1.01Z'/%3e%3cpath%20class='st0'%20d='M65.99,31.14h-1.8l-.31-2.07h-2.19l-.31,2.07h-1.64l1.82-11.39h2.62l1.82,11.39ZM65.28,18.04c-.25.46-.51.77-.75.94-.21.15-.47.22-.79.22-.26,0-.57-.07-.92-.22l-.38-.15c-.14-.05-.26-.07-.37-.07-.3,0-.53.18-.71.54l-.91-.68c.25-.46.51-.77.75-.94.21-.14.48-.21.79-.21.26,0,.57.07.92.21l.38.15c.14.05.26.07.37.07.3,0,.53-.18.71-.54l.91.68ZM61.91,27.52h1.73l-.87-5.76-.87,5.76Z'/%3e%3cpath%20class='st0'%20d='M74.53,26.89v1.52c0,1.91-.89,2.86-2.67,2.86s-2.67-.95-2.67-2.86v-5.93c0-1.91.89-2.86,2.67-2.86s2.67.95,2.67,2.86v1.11h-1.69v-1.22c0-.75-.31-1.12-.93-1.12s-.93.37-.93,1.12v6.15c0,.74.31,1.11.93,1.11s.93-.37.93-1.11v-1.63h1.69Z'/%3e%3cpath%20class='st0'%20d='M81.4,31.14h-1.8l-.31-2.07h-2.19l-.31,2.07h-1.64l1.82-11.39h2.62l1.82,11.39ZM75.9,19.2l1.52-1.91h1.71l1.51,1.91h-1.61l-.76-.95-.75.95h-1.61ZM77.32,27.52h1.73l-.87-5.76-.87,5.76ZM83.1,15.99l-1.76,1.91h-1.26l1.17-1.91h1.86Z'/%3e%3cpath%20class='st0'%20d='M84.86,19.75c1.78,0,2.67.94,2.67,2.82v1.48c0,1.87-.89,2.81-2.67,2.81h-.85v4.28h-1.79v-11.39h2.64ZM84.01,21.37v3.86h.85c.58,0,.87-.36.87-1.08v-1.71c0-.71-.29-1.07-.87-1.07h-.85Z'/%3e%3cpath%20class='st0'%20d='M93.51,19.75c1.78,0,2.67.94,2.67,2.82v1.48c0,1.87-.89,2.81-2.67,2.81h-.85v4.28h-1.79v-11.39h2.64ZM92.66,21.37v3.86h.85c.58,0,.87-.36.87-1.08v-1.71c0-.71-.29-1.07-.87-1.07h-.85Z'/%3e%3cpath%20class='st0'%20d='M98.8,31.14h-1.79v-11.39h1.79v4.88h2.03v-4.88h1.83v11.39h-1.83v-4.88h-2.03v4.88Z'/%3e%3cpath%20class='st0'%20d='M105.36,24.55h2.46v1.62h-2.46v3.34h3.09v1.63h-4.88v-11.39h4.88v1.63h-3.09v3.18ZM108.17,17.29l-1.76,1.91h-1.26l1.17-1.91h1.86Z'/%3e%3cpath%20class='st0'%20d='M112.2,19.75c1.78,0,2.67.94,2.67,2.82v1.48c0,1.87-.89,2.81-2.67,2.81h-.85v4.28h-1.79v-11.39h2.64ZM111.35,21.37v3.86h.85c.58,0,.87-.36.87-1.08v-1.71c0-.71-.29-1.07-.87-1.07h-.85Z'/%3e%3c/g%3e%3ccircle%20class='st1'%20cx='25'%20cy='25'%20r='20'/%3e%3cpath%20class='st0'%20d='M32.78,19.27c2.92,0,4.43,2.55,5.28,5.33l.71,2.17c.14.38-.33.75-.71.75h-5.61c.19-.33.24-.71.09-1.08l-.75-2.45c-.43-1.32-.99-2.64-1.79-3.77.75-.57,1.65-.94,2.78-.94h0ZM25,18.38c3.25,0,4.9,2.78,5.89,5.89l.76,2.45c.14.42-.33.8-.8.8h-11.69c-.42,0-.94-.38-.8-.8l.75-2.45c.99-3.11,2.64-5.89,5.89-5.89h0ZM25,11.35c1.74,0,3.11,1.37,3.11,3.11s-1.37,3.11-3.11,3.11-3.11-1.41-3.11-3.11,1.41-3.11,3.11-3.11h0ZM17.27,19.27c1.08,0,1.98.38,2.73.94-.8,1.13-1.37,2.45-1.74,3.77l-.8,2.45c-.14.38-.05.75.09,1.08h-5.56c-.42,0-.9-.38-.75-.75l.71-2.17c.9-2.78,2.41-5.33,5.33-5.33h0ZM17.27,12.91c1.51,0,2.78,1.27,2.78,2.83s-1.27,2.83-2.78,2.83-2.83-1.27-2.83-2.83,1.27-2.83,2.83-2.83h0ZM32.78,12.91c1.56,0,2.78,1.27,2.78,2.83s-1.23,2.83-2.78,2.83-2.83-1.27-2.83-2.83,1.27-2.83,2.83-2.83h0ZM27.07,28.56v.09c0,.57-.24,1.08-.61,1.46h0v.05c-.38.33-.9.57-1.46.57s-1.08-.24-1.46-.61h0c-.38-.38-.61-.9-.61-1.46v-.09h1.41v.09c0,.19.05.38.19.47v.05c.09.09.28.19.47.19s.38-.09.47-.19v-.05c.14-.09.24-.28.24-.47t-.05-.09h1.41ZM30.99,28.56v.09c0,1.65-.66,3.16-1.74,4.24-1.08,1.08-2.59,1.79-4.24,1.79s-3.16-.71-4.24-1.79l-.05-.05c-1.04-1.08-1.7-2.55-1.7-4.2v-.09h1.41v.09c0,1.27.47,2.4,1.27,3.25h.05c.85.85,1.98,1.37,3.25,1.37s2.4-.52,3.25-1.37c.85-.8,1.37-1.98,1.37-3.25v-.09h1.37ZM34.99,28.56v.09c0,2.78-1.13,5.28-2.92,7.07-1.79,1.79-4.29,2.92-7.07,2.92s-5.23-1.13-7.07-2.92c-1.79-1.79-2.92-4.29-2.92-7.07v-.09h1.41v.09c0,2.4.94,4.53,2.5,6.08,1.56,1.56,3.72,2.5,6.08,2.5s4.52-.94,6.08-2.5c1.56-1.56,2.5-3.68,2.5-6.08v-.09h1.41Z'/%3e%3c/svg%3e)