
198 Treatability Evaluation
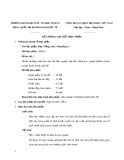
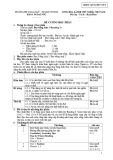
Table 3.2.5 N/COD ratios and calculations of the single fractions of TKN
Values of N/COD ratios (g N/g COD)
Symbol of
Calculation N/COD ratio Typical value Range
SND =iNSS·SSiNSS 0.02 —
XND =iNXS·XSiNXS 0.04 0.02–0.06
SNI =iNSI·SIiNSI 0.01 0.01–0.02
XNI =iNXI·XIiNXI 0.03 0.01–0.06
NBH =iXB·XBH iXB 0.086 —
3.2.5 METALLIC COMPOUNDS
The concentration of metals in raw wastewater can differ significantly depending
on the domestic, commercial or industrial activities collected by the sewerage. The
main interest is in metals characterized by potential toxic impact on health or the
environment, such as Cd, Cr , Cu, Hg, Ni, Pb and Zn. The load of these components at
the inlet of a WWTP can be several times greater in industrial sites than in residential
areas far from industrial activities. Urban run-off during storm events is also a
source of metals and other pollutants, and contributes to the total influent load into a
WWTP.
3.2.5.1 Treatability of Metallic Compounds
Metals in raw wastewater are removed in WWTPs through two different mechanisms:
rPrimary sedimentation: metals are separated as insoluble precipitates or adsorbed
on settled particulate matter and then extracted with primary sludge. In contrast
the removal of metals in soluble form is negligible.
rSecondary treatment: during the biological process metals are integrated into acti-
vated sludge or biofilm (adsorbed on flocs or in extracellular polymers). They are
removed at the same efficiency as the sludge solids in the secondary settler and
extracted together with the excess sludge.
Some values for metal removal in primary and secondary treatments are summa-
rized in Table 3.2.6 (European Union, 2001).
Similar patterns of removal percentages are observed in primary and secondary
treatments. Lower removal is observed in both cases for Ni due to its high solubility
that limits the presence of Ni in the particulate matter and sludge. In contrast Pb, one

Metallic Compounds 199
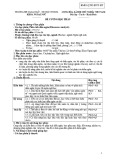
Table 3.2.6 Percentage of metals removed in WWTPs, calculated with respect to the
concentration in the influent raw wastewater
Removal in primary Removal in primary +
Metal treatment (%) secondary treatment (%)
Ni 24 40
Cd 40 65–75
Cr 40 75–80
Zn 50 70–80
Cu 50 75–80
Hg 55 70–80
Pb 55 70–80
of the least soluble metals, shows higher removal in both the primary and secondary
stages. For the majority of metals a significant percentage of the influent load, up to
70–80 %, is transferred into primary and secondary sludge. As a consequence the
concentration of metals in dry sludge (measured as TSS) reaches levels of several
thousand mg/kg TSS, about 1000 times higher than the concentration of metals in
raw wastewater.
In synthesis, the majority of metals entering the WWTPs with the raw waste-
water is transferred to the sludge extracted from primary and secondary treatments.
Depending on the metal solubility, a smaller amount, ranging from 20 to 40 %
(60 % only for Ni), is however discharged in water bodies with the final effluent.
With regards to the fate of sludge separated by settlers, the stabilization processes
through aerobic or mesophilic anaerobic digestion cause the biological reduction of
the volatile solids (30–50 %) and the specific metal content increases, metals being
conserved during stabilization. Due to the presence of metals the final disposal of
sludge may be problematic especially in the case of accumulation in soils interfering
with the long-term sustainable use of sludge on land.
For the prediction of the removal of metals from raw wastewater and the parti-
tioning into final effluent and sludge, mechanistic approaches have been proposed
(Monteith et al., 1993). On the basis of influent wastewater characterization (flow
rate, metal concentrations) and the layout of the WWTP (unit volumes, operational
conditions) the metal concentration in primary sludge, secondary sludge and final
effluent can be predicted. The calculation is performed on the basis of mass balances
by considering the main chemical and physical mechanisms (precipitation of soluble
metals into a settleable form, sorption onto settleable solids, surface volatilization).
In the model the mass of primary and biological sludge produced by primary sed-
imentation and secondary treatment is calculated and partitioning coefficients are
introduced in the model for the estimation of the metal concentrations in the soluble
and solid phases. A similar approach can be applied also for estimating the fate of
organic contaminants instead of metals in WWTP. Modelling can be performed both
under steady-state or dynamic conditions.

200 Treatability Evaluation
3.2.6 FINAL CONSIDERATIONS
WWTPs are effective in the reduction of most pollutants present in wastewater (such
as organic matter, nutrients, potentially toxic elements or some micropollutants), be-
fore the discharge of the treated effluents in surface waters. In WWTPs several
biological and physico-chemical processes can be implemented, but the main path-
ways for pollutants removal are: (1) the biological oxidation by activated sludge or
biofilm systems; or (2) the accumulation of contaminants in excess sludge.
In this chapter the main categories of pollutants present in influent wastewater
and their fate in WWTPs has been discussed. The assessment of the treatability of a
specific wastewater in WWTPs is strictly dependent on the fate of contaminants in
the treatment stages. The amount of pollutants removed in conventional WWTPs or
passing into the effluent has been indicated depending on the category of pollutants,
separated into organic compounds, organic micropollutants, nutrients and metallic
compounds. These main categories were identified in order to make an aggregation
of the large number of individual pollutants; a much longer and detailed report
would be required for the explanation of the fate of each single element. Therefore
the present description is not exhaustive for understanding the fate of each single
compound; the objective of this chapter is to explain the main pathways in WWTPs
for macro-categories of pollutants.
The wastewater characterization can be investigated more or less in depth de-
pending on the particular needs in management of WWTPs, the requirement for
discharge, and the practicalities of operators that make the measurements. The in-
creasing detail in characterization and control of effluent wastewater from WWTPs
coupled with the more stringent limits for discharge in receiving water bodies, ne-
cessitates a more complex and sophisticated monitoring. This causes considerable
additional effort and expense to obtain a high degree of knowledge about the type
and the concentrations of pollutants and micropollutants in influent and effluent
wastewaters.
With regards to COD fractionation the routine measurement of all the parameters
indicated in Section 3.2.2.1, according to the respirometric approach (described in
Section 3.2.2.2), is extremely time-consuming because of the time required for the
respirometric tests and the time need for data elaboration. Therefore, COD fraction-
ation could be done only occasionally in a WWTP and the percentages obtained
can be assumed as typical for a specific wastewater. Of course a periodic valida-
tion of fractionation is required. Alternatively, the simplified procedure described
in Section 3.2.2.3 can be applied, which is more approximate but is advantageously
fast to use. A more detailed characterization, performed by using the respirometric
approach, could be required in order to observe daily, weekly or seasonal variation or
fluctuation occurring in the COD fractions. In the case of industrial sources, shock
loadings are by their nature difficult to predict.
In the case of N fractionation, the calculation described in Section 3.2.4.1 can be
easily done thanks to its dependence on COD fractionation.

References 201
In general a good characterization of COD and N in the influent wastewater
is very important to understand the fate of these components in WWTPs and to
predict the quality of the effluent wastewater before discharge in receiving water
bodies.
With regards to metals or nutrients, they are routinely measured in wastewater
and sludge and an extensive knowledge about these components is usually available
in WWTP management. The measurement is done often routinely in influent and
effluent wastewater due to the relative ease of the analysis and the moderate expense
involved.
In contrast, organic micropollutants, such as PAHs, PCBs, PCDD/PCDFs or phar-
maceuticals, are rarely monitored because of the high cost of analysis and the need
for specialized laboratories and, sometimes, the lack of unified and standardized
methodologies. Furthermore, the limitation in the evaluation of the fate of organic
micropollutants and potentially toxic elements is mainly related to the lack of studies
on mass balance in WWTPs and with regards to partitioning in water and sludge.
Further research is needed to improve knowledge in this field.
REFERENCES
APHA, AWWA and WPCF (1998) Standard Methods for the Examination of Water and Wastew-
ater. American Public Health Association, American Water Works Association and Water
Environment Federation, Washington DC, USA.
Ekama, G.A., Dold, P.L. and Marais, G.v.R. (1986) Water Sci. Technol.,18(6), 91–114.
European Union (2001) Pollutants in Urban Wastewater and Sewage Sludge. Office for Official
Publications of the European Communities, Luxembourg.
Field, J.A., Field, T.M., Poiger, T., Siegrist, H. and Giger, W. (1995) Water Res.,29(5), 1301–1307.
Gujer, W., Henze, M., Mino, T. and van Loosdrecht, M.C.M. (1999) Water Sci. Technol.,39(1),
183–193.
Halling-Sørensen, B., Nors Nielsen, S., Lanzky, P.F., Ingerslev, F., Holten L¨utzhøft, H.C. and
Jørgensen, S.E. (1998) Chemosphere,36(2), 357–393.
Henze, M. (1992) Water Sci. Technol., 25(6), 1–15.
Henze, M., Grady J., C.P.L., Gujer, W., Marais, G.v.R. and Matsuo, T. (1987) Activated Sludge
Model No. 1. IAWQ Scientific and Technical Report No. 1, London, UK.
Holt, M.S., Fox, K.K., Burford, M., Daniel, M. and Buckland, H. (1998) Sci. Total Environ.,
210/211, 255–269.
Kappeler, J. and Gujer, W. (1992) Water Sci. Technol.,25(6), 125–139.
K¨orner, W., Bolz, U., S¨ußmuth, W., Hiller, G., Schuller, W., Volker, H. and Hagenmaier, H. (2000)
Chemosphere,40, 1131–1142.
Mamais, D., Jenkins, D. and Pitt, P. (1993) Water Res.,27, 195–197.
Manoli, E. and Samara, C. (1999) J. Environ. Qual.,28(1), 176–186.
McNally, D.L., Mihelcic, J.R. and Lueking, D.R. (1998) Environ. Sci. Technol.,32, 2633–2639.
Metcalf and Eddy. (2003) Wastewater Engineering. Treatment and Reuse,. 4th Edn. McGraw-Hill,
New York.
Monteith, H.D., Bell, J.P., Thompson, D.J., Kemp, J., Yendt, C.M., Melcer, H., (1993) Water
Environ. Res.,65(2), 129–137.

202 Treatability Evaluation
Orhon, D., Artan, N. and Cimsit, Y. (1989) Water Sci. Technol.,21(4–5), 339–350.
Orhon, D., Ate¸s, E., S¨ozen, S. and Ubay C¸ okg¨or, E. (1997) Environ. Pollut.,95(2), 191–204.
Pax´eus, N. (1996) Water Res.,30(5), 1115–1122.
Prats, D., Ruiz, F., V´azquez, B. and Rodriguez-Pastor, M. (1997) Water Res.,31(8), 1925–1930.
Roeleveld, P.J. and van Loosdrecht, M.C.M. (2002) Water Sci. Technol.,45(6), 77–87.
Samara, C., Lintelmann, J. and Kettrup, A. (1995) Toxicol. Environ. Chem.,48(1–2), 89–102.
Sinkkonen, S. and Paasivirta, J. (2000) Chemosphere,40, 943–949.
Sollfrank, U., Kappeler, J. and Gujer, W. (1992) Water Sci. Technol.,25(6), 33–41.
Spanjers, H, Tak´acs, I. and Brouwer, H. (1999) Water Sci. Technol.,39(4), 137–145.
Spanjers, H. and Vanrolleghem, P. (1995) Water Sci. Technol., 31(2), 105–114.
STOWA. (1996) Methoden voor influentkarakterisering (in Dutch). STOWA Report 96–08,
STOWA, Utrecht, The Netherlands.
Vanrolleghem, P.A., Spanjers, H., Petersen, B., Ginestet, P. and Takacs, I. (1999) Water Sci. Technol.,
39(1), 195 – 215.
Weijers, S.R. (1999) Water Sci. Technol.,39(4), 177–184.
Xu, S. and Hultman, B. (1996) Water Sci. Technol.,33(12), 89–98.
Ziglio, G., Andreottola, G., Foladori, P. and Ragazzi, M. (2001) Water Sci. Technol.,43(11),
119–126.


![509 mẫu câu tiếng Anh giao tiếp thông dụng nhất: Kho mẫu câu [năm hiện tại]](https://cdn.tailieu.vn/images/document/thumbnail/2026/20260515/baobinh_011/135x160/121778822152.jpg)


%20--%3e%3cdefs%3e%3cstyle%3e%20.st0%20{%20fill:%20%23fff;%20}%20.st1%20{%20fill:%20%237800fa;%20}%20%3c/style%3e%3c/defs%3e%3cpath%20class='st1'%20d='M117.78,12.18H43.11c2.9,3.47,4.65,7.94,4.65,12.82,0,5.6-2.3,10.66-6.01,14.29h76.02l7.22-13.56-7.22-13.56Z'/%3e%3cg%3e%3cpath%20class='st0'%20d='M53.58,26.17h-.59v-1.46h.59v-4.96h2.83c1.78,0,2.67.94,2.67,2.82v5.76c0,1.87-.89,2.81-2.67,2.81h-2.83v-4.96ZM55.36,21.37v3.34h1.1v1.46h-1.1v3.34h1.01c.61,0,.91-.37.91-1.1v-5.93c0-.74-.3-1.1-.91-1.1h-1.01Z'/%3e%3cpath%20class='st0'%20d='M65.99,31.14h-1.8l-.31-2.07h-2.19l-.31,2.07h-1.64l1.82-11.39h2.62l1.82,11.39ZM65.28,18.04c-.25.46-.51.77-.75.94-.21.15-.47.22-.79.22-.26,0-.57-.07-.92-.22l-.38-.15c-.14-.05-.26-.07-.37-.07-.3,0-.53.18-.71.54l-.91-.68c.25-.46.51-.77.75-.94.21-.14.48-.21.79-.21.26,0,.57.07.92.21l.38.15c.14.05.26.07.37.07.3,0,.53-.18.71-.54l.91.68ZM61.91,27.52h1.73l-.87-5.76-.87,5.76Z'/%3e%3cpath%20class='st0'%20d='M74.53,26.89v1.52c0,1.91-.89,2.86-2.67,2.86s-2.67-.95-2.67-2.86v-5.93c0-1.91.89-2.86,2.67-2.86s2.67.95,2.67,2.86v1.11h-1.69v-1.22c0-.75-.31-1.12-.93-1.12s-.93.37-.93,1.12v6.15c0,.74.31,1.11.93,1.11s.93-.37.93-1.11v-1.63h1.69Z'/%3e%3cpath%20class='st0'%20d='M81.4,31.14h-1.8l-.31-2.07h-2.19l-.31,2.07h-1.64l1.82-11.39h2.62l1.82,11.39ZM75.9,19.2l1.52-1.91h1.71l1.51,1.91h-1.61l-.76-.95-.75.95h-1.61ZM77.32,27.52h1.73l-.87-5.76-.87,5.76ZM83.1,15.99l-1.76,1.91h-1.26l1.17-1.91h1.86Z'/%3e%3cpath%20class='st0'%20d='M84.86,19.75c1.78,0,2.67.94,2.67,2.82v1.48c0,1.87-.89,2.81-2.67,2.81h-.85v4.28h-1.79v-11.39h2.64ZM84.01,21.37v3.86h.85c.58,0,.87-.36.87-1.08v-1.71c0-.71-.29-1.07-.87-1.07h-.85Z'/%3e%3cpath%20class='st0'%20d='M93.51,19.75c1.78,0,2.67.94,2.67,2.82v1.48c0,1.87-.89,2.81-2.67,2.81h-.85v4.28h-1.79v-11.39h2.64ZM92.66,21.37v3.86h.85c.58,0,.87-.36.87-1.08v-1.71c0-.71-.29-1.07-.87-1.07h-.85Z'/%3e%3cpath%20class='st0'%20d='M98.8,31.14h-1.79v-11.39h1.79v4.88h2.03v-4.88h1.83v11.39h-1.83v-4.88h-2.03v4.88Z'/%3e%3cpath%20class='st0'%20d='M105.36,24.55h2.46v1.62h-2.46v3.34h3.09v1.63h-4.88v-11.39h4.88v1.63h-3.09v3.18ZM108.17,17.29l-1.76,1.91h-1.26l1.17-1.91h1.86Z'/%3e%3cpath%20class='st0'%20d='M112.2,19.75c1.78,0,2.67.94,2.67,2.82v1.48c0,1.87-.89,2.81-2.67,2.81h-.85v4.28h-1.79v-11.39h2.64ZM111.35,21.37v3.86h.85c.58,0,.87-.36.87-1.08v-1.71c0-.71-.29-1.07-.87-1.07h-.85Z'/%3e%3c/g%3e%3ccircle%20class='st1'%20cx='25'%20cy='25'%20r='20'/%3e%3cpath%20class='st0'%20d='M32.78,19.27c2.92,0,4.43,2.55,5.28,5.33l.71,2.17c.14.38-.33.75-.71.75h-5.61c.19-.33.24-.71.09-1.08l-.75-2.45c-.43-1.32-.99-2.64-1.79-3.77.75-.57,1.65-.94,2.78-.94h0ZM25,18.38c3.25,0,4.9,2.78,5.89,5.89l.76,2.45c.14.42-.33.8-.8.8h-11.69c-.42,0-.94-.38-.8-.8l.75-2.45c.99-3.11,2.64-5.89,5.89-5.89h0ZM25,11.35c1.74,0,3.11,1.37,3.11,3.11s-1.37,3.11-3.11,3.11-3.11-1.41-3.11-3.11,1.41-3.11,3.11-3.11h0ZM17.27,19.27c1.08,0,1.98.38,2.73.94-.8,1.13-1.37,2.45-1.74,3.77l-.8,2.45c-.14.38-.05.75.09,1.08h-5.56c-.42,0-.9-.38-.75-.75l.71-2.17c.9-2.78,2.41-5.33,5.33-5.33h0ZM17.27,12.91c1.51,0,2.78,1.27,2.78,2.83s-1.27,2.83-2.78,2.83-2.83-1.27-2.83-2.83,1.27-2.83,2.83-2.83h0ZM32.78,12.91c1.56,0,2.78,1.27,2.78,2.83s-1.23,2.83-2.78,2.83-2.83-1.27-2.83-2.83,1.27-2.83,2.83-2.83h0ZM27.07,28.56v.09c0,.57-.24,1.08-.61,1.46h0v.05c-.38.33-.9.57-1.46.57s-1.08-.24-1.46-.61h0c-.38-.38-.61-.9-.61-1.46v-.09h1.41v.09c0,.19.05.38.19.47v.05c.09.09.28.19.47.19s.38-.09.47-.19v-.05c.14-.09.24-.28.24-.47t-.05-.09h1.41ZM30.99,28.56v.09c0,1.65-.66,3.16-1.74,4.24-1.08,1.08-2.59,1.79-4.24,1.79s-3.16-.71-4.24-1.79l-.05-.05c-1.04-1.08-1.7-2.55-1.7-4.2v-.09h1.41v.09c0,1.27.47,2.4,1.27,3.25h.05c.85.85,1.98,1.37,3.25,1.37s2.4-.52,3.25-1.37c.85-.8,1.37-1.98,1.37-3.25v-.09h1.37ZM34.99,28.56v.09c0,2.78-1.13,5.28-2.92,7.07-1.79,1.79-4.29,2.92-7.07,2.92s-5.23-1.13-7.07-2.92c-1.79-1.79-2.92-4.29-2.92-7.07v-.09h1.41v.09c0,2.4.94,4.53,2.5,6.08,1.56,1.56,3.72,2.5,6.08,2.5s4.52-.94,6.08-2.5c1.56-1.56,2.5-3.68,2.5-6.08v-.09h1.41Z'/%3e%3c/svg%3e)