VNU Journal of Science: Mathematics – Physics, Vol. 41, No. 1 (2025) 26-33
26
Original Article
Structure and Density Heterogeneities of the l-3Al2O3.2SiO2
System: Insight from Computer Simulation and Density-Based
Spatial Clustering of Applications with Noise
Mai Thi Lan, Pham Tri Dung*, Nguyen Van Hong
Hanoi University of Science and Technology, 1 Dai Co Viet, Hai Ba Trung, Hanoi, Vietnam
Received 24th September 2024
Revised 31st October 2024; Accepted 15th February 2025
Abstract: The structural and density heterogeneity of the liquid 3Al2O3.2SiO2 (l-3Al2O3.2SiO2)
system was studied using Molecular Dynamics (MD) and Monte Carlo (MC) simulations. The
results showed that the structural phase transition occurred at an oxygen packing factor of
approximately 0.58. At low pressure, TO4 structural units predominated while at high pressure, TO6
structural units became dominant. In addition, the Density-Based Spatial Clustering of Applications
with Noise (DBSCAN) algorithm was applied to find regions with larger density than the average
density in the model. These findings provide an in-depth understanding of the structure of the l-
3Al2O3.2SiO2 system under compressive pressure.
Keywords: Structural heterogeneity, OPF, high-density regions, DBSCAN.
1. Introduction*
In recent years, Al2O3 and SiO2 oxide systems have received significant research attention.
Al2O3.SiO2 system with the Al2O3 content at 60 mol % (3Al2O3.2SiO2) is considered a potential material
for modern ceramic production. With preeminent properties such as mechanical strength, high thermal
shock resistance, low thermal expansion, and good conductivity, 3Al2O3.2SiO2 systems are widely used
in electronic and optical applications [1]. Research results on the Al2O3.SiO2 system indicate that, in the
aluminosilicate glass system, both SiO2 and Al2O3 serve as network formers [2]. The Si⁴⁺ ion
preferentially combines with O²⁻ to form a glass lattice framework shaped like a tetrahedron (SiO4).
Al2O3 acts as a network intermediate and is an important chemical component of glass. This enhances
________
* Corresponding author.
E-mail address: tridungmta143@gmail.com
https//doi.org/10.25073/2588-1124/vnumap.4967

P. T. Dung et al. / VNU Journal of Science: Mathematics – Physics, Vol. 41, No. 1 (2025) 26-33
27
the mechanical strength and thermal stability of the materials [3-5]. Al2O3 has two structural forms:
octahedral AlO6 and tetrahedral AlO4 units, which perform different functions. Notably, AlO4 units
typically make up a larger proportion. When the concentration of Al2O3 in the Al2O3.SiO2 system
increases, the proportion of octahedral AlO6 also rises. The overall bonding within the glass network
weakens, leading to an increase in the thermal expansion coefficient and a decrease in chemical stability.
When Al2O3 content exceeds 6%, its role in providing free oxygen becomes prominent, which can
damage the Si–O network to a certain extent [6, 7]. There have been many studies on the Al2O3.SiO2
systems, with most focusing on the relationship between structure, temperature, and composition [8-
11]. Simulation studies [12-15] have focused on studying the spatial distribution of the basic structural
units TOn as well as determining the ratios of bridging oxygen (BO) to non-bridging oxygen (NBO) in
Al2O3.SiO2. They provide valuable insights into the structure of the Al2O3.SiO2 system.
In this work, we studied the l-3Al2O3.2SiO2 system at 3.500 K under pressure conditions ranging
from 0 to 80 GPa. We survey the bond length of atom pairs, coordination number (CN), density, and
oxygen packing factor (OPF) to extract valuable structural information. In particular, the Density-Based
Spatial Clustering of Applications with Noise (DBSCAN) algorithm is applied to find high-density
regions to clarify the structural heterogeneity of the model. The results contributed important insights
into the structural heterogeneity of the l-3Al2O3.2SiO2.
2. Computational Procedure
The models for a l-3Al2O3.2SiO2 system were built using MD simulation method with the Born–
Mayer–Huggins potential and periodic boundary conditions. These issues are described in detail in our
previous work [16]. Now, we present more information about the MC and DBSCAN methods used in
this work. The MC algorithm is applied to calculate the OPF and the volume of dense clusters in the
model. The algorithm's steps are as follows: 106 random points are placed in the MD simulation box.
Based on the radius of the atoms in the model, each point is checked to determine whether it belongs to
the region occupied by any atom. NP is the number of random points in the high-density region where
the atoms occupy, the volume of the simulation box is V0. The volume of the high-density clusters (VC)
is calculated as follows:
𝑉
𝐶=𝑁𝑃𝑉
0
106 (1)
The atomic density of clusters in the high-density regions (HDR) is calculated by formula (2):
𝑑𝑒𝑛𝑠𝑖𝑡𝑦 = 𝑚𝑆𝑖𝑛𝑆𝑖+𝑚𝑂𝑛𝑂+𝑚𝐴𝑙𝑛𝐴𝑙
𝑉𝐶.𝑁𝐴
(2)
where mSi, nSi, mAl, nAl, mO, and nO are the mass and number of Si, Al, and O atoms in the high-density
clusters, respectively. NA is Avogadro's constant.
To determine OPF, we calculate the number of points within the radius of the atoms. If N0 is the
total number of points located in the space of oxygen atoms, then OPF can be calculated, it is as follows
OPF = N0/1,000,000.
For the DBSCAN algorithm, it is necessary to determine the parameters appropriately for each
specific data set, depending on the characteristics and nature of the data set's distribution. Two
parameters needed to be selected in DBSCAN are epsilon (eps) and Minpts [17, 18]. Where Minpts is a
threshold of the minimum number of data points grouped to define a high-density neighborhood, eps is
the distance value used to define the neighborhood of any atom. Two parameters eps and Minpts help
define three types of points: core point, border point, and noise point (noise). The steps of the algorithm
are as follows:
P. T. Dung et al. / VNU Journal of Science: Mathematics – Physics, Vol. 41, No. 1 (2025) 26-33
28
- The algorithm selects any data point and then proceeds to determine the core and boundary points
through the eps neighborhood by spreading the chain of points belonging to the same cluster.
- The cluster is completely defined when it cannot be expanded further. Then recursively repeat the
entire process with an initial point among the remaining data points to determine a new cluster.
- Points that are not within the eps distance of any core point are considered as noise points, these
points are not assigned to any cluster.
3. Results and Discussion
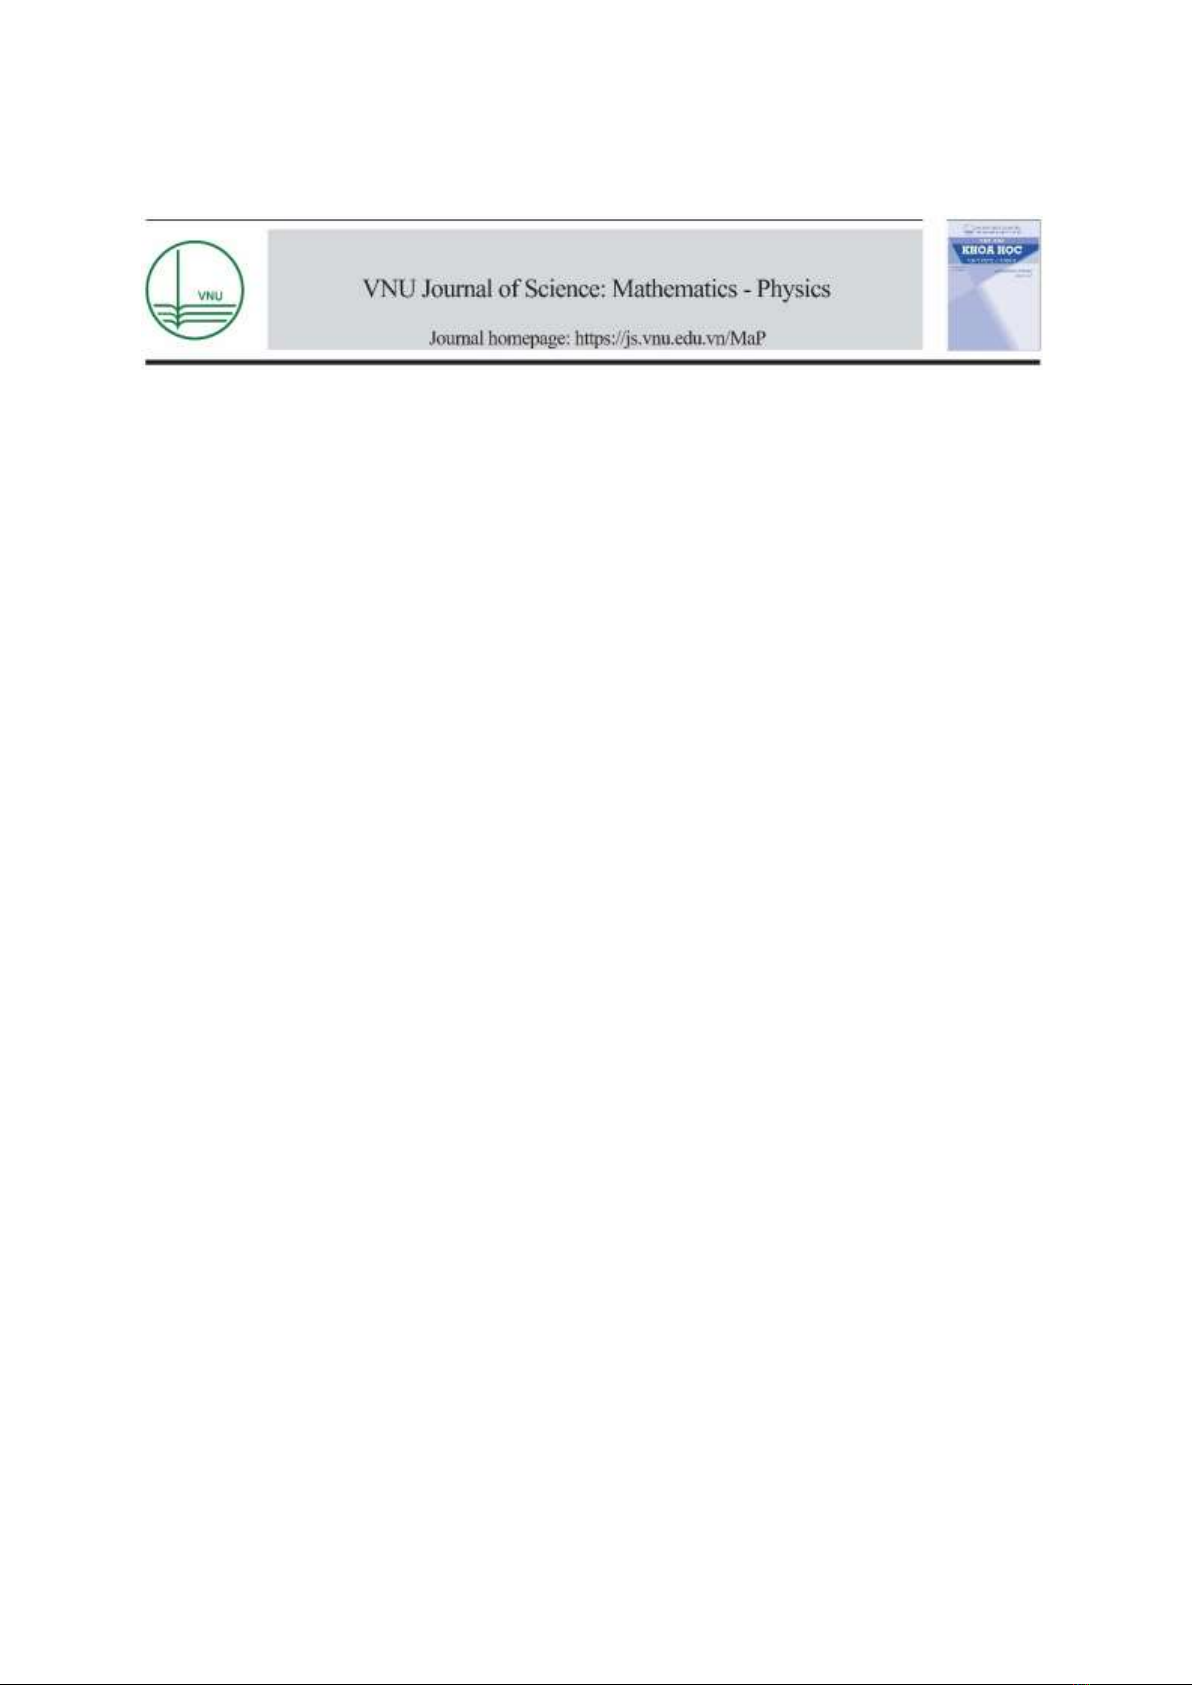
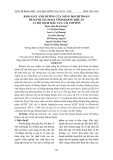
The first maximum peak of the radial distribution function (rmax) is shown in Fig. 1. At ambient
pressure, the bond lengths of Si – Si, Si – O, O – O, Si – Al, O – Al, and Al – Al are 3.12 Å, 1.58 Å,
2.72 Å, 3.1 Å, 1.66 Å, 3.16 Å, respectively. When increasing the compression pressure, the rmax of the
Si – O and Al – O pairs increase, this shows the growth of the Si–O and Al–O coordination number
when applying pressure increase. In contrast, the rmax of the O–O pair decreases, more notably the bond
lengths of Si–Si, Al–Al, and Si–Al atomic pairs tend to increase when the pressure increases from 0 to
6 GPa after that begin to decrease. At 80 GPa, the bond lengths of the Si–Si, Al–Al, and Si–Al pairs are
3.08 Å, 2.9 Å, and 2.96 Å, respectively. These results are consistent with the data of the simulation and
experimental studies as shown in [12, 19, 20], see in Table 1.
Figure 1. The rmax of the radial distribution functions in l-3Al2O3.2SiO2.
Table 1. The first peak position of radial distribution functions in l-3Al2O3.2SiO2
Fist peak position (Å)
Si-O
Al-O
This work
1.64 ± 0.02
1.72 ± 0.02
[12]
1.64
1.70
[19]
1.64
1.69
[20]
1.61
1.74
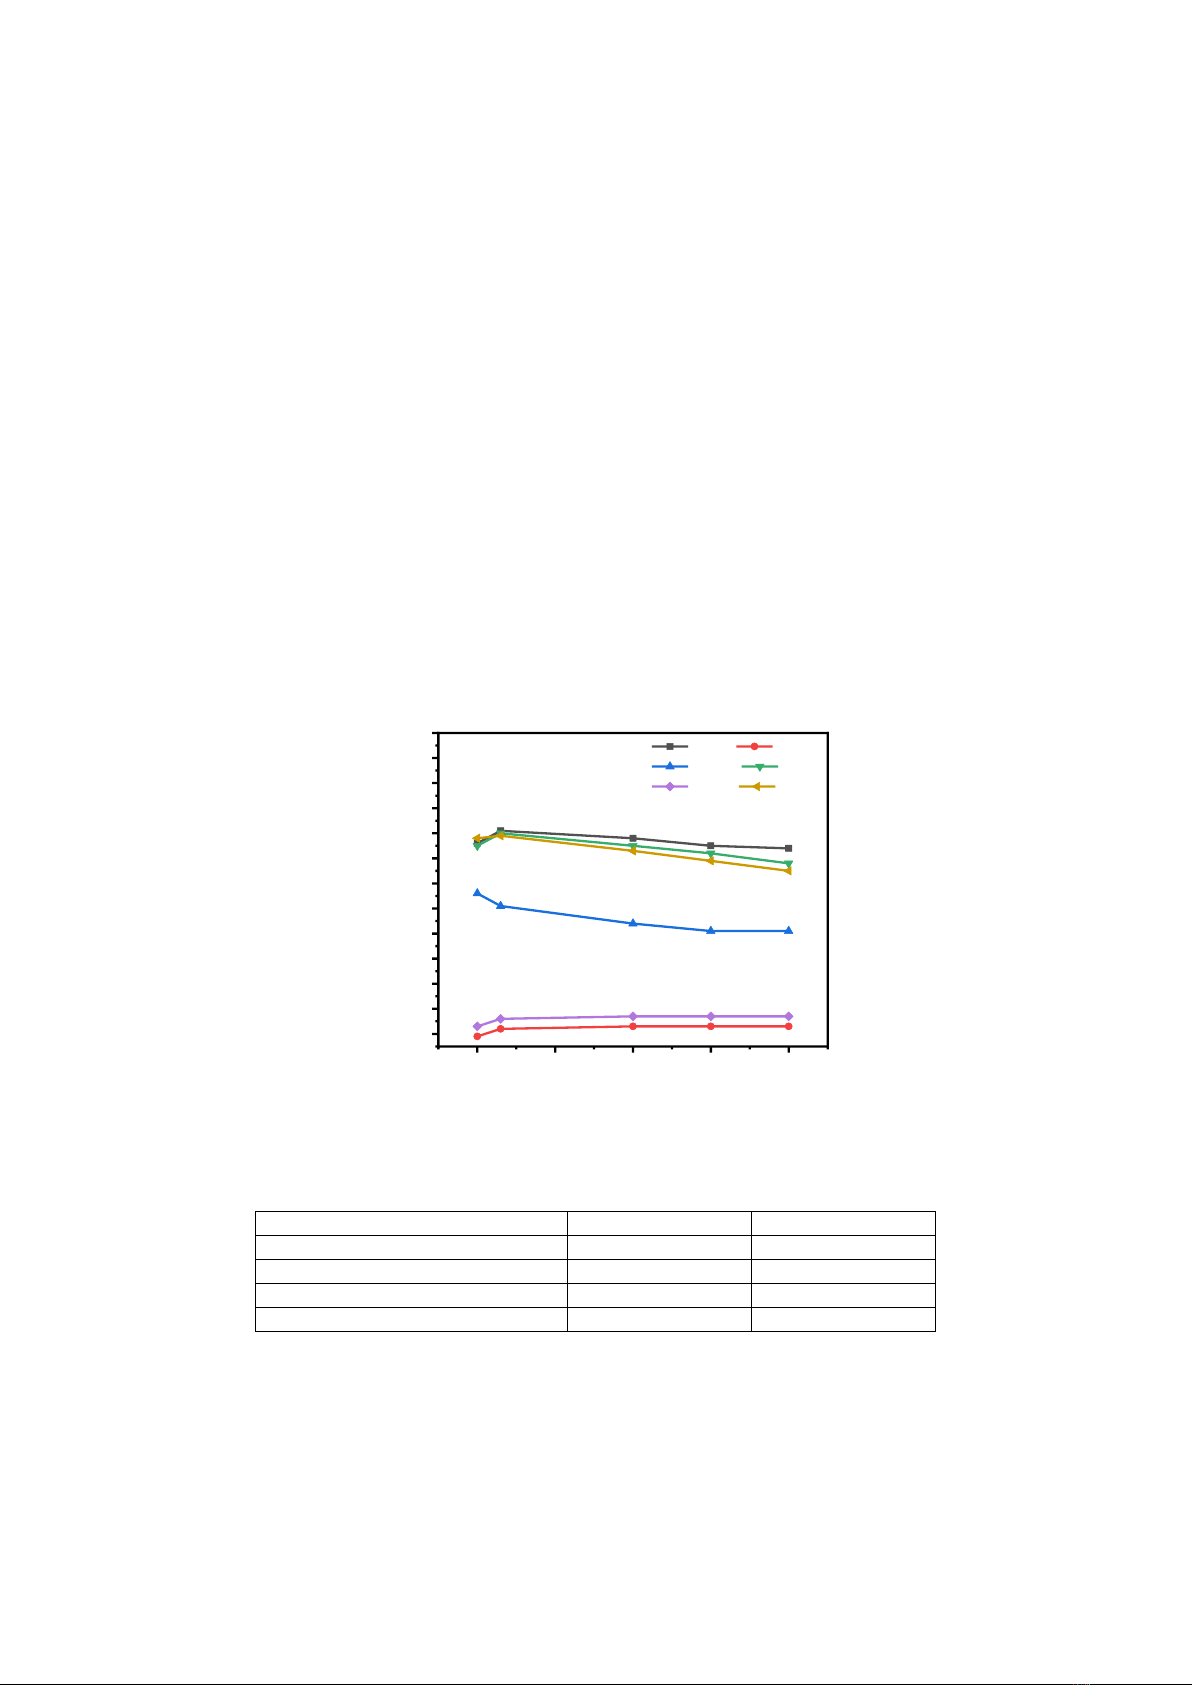
The results of the Si - O coordination number distribution are depicted in Fig. 2. It can be seen that
at ambient pressure, almost one Si atom bonds with 4 oxygen atoms to form a SiO4 polyhedron.
Meanwhile the percentage of structural unit SiO5 at this pressure is very low about 5%, and no SiO6 unit
020 40 60 80
1.6
1.8
2.0
2.2
2.4
2.6
2.8
3.0
3.2
3.4
3.6
3.8
4.0
rmax(Å)
Pressure (GPa)
Si-Si Si-O
O-O Si-Al
O-Al Al-Al
P. T. Dung et al. / VNU Journal of Science: Mathematics – Physics, Vol. 41, No. 1 (2025) 26-33
29
exists. As the pressure increases, the fraction of SiO5 and SiO6 increases significantly, especially from
a pressure of 6 GPa, 38.56% for SiO5 and 51.83% for SiO6, while the proportion of SiO4 structural units
decreases sharply.
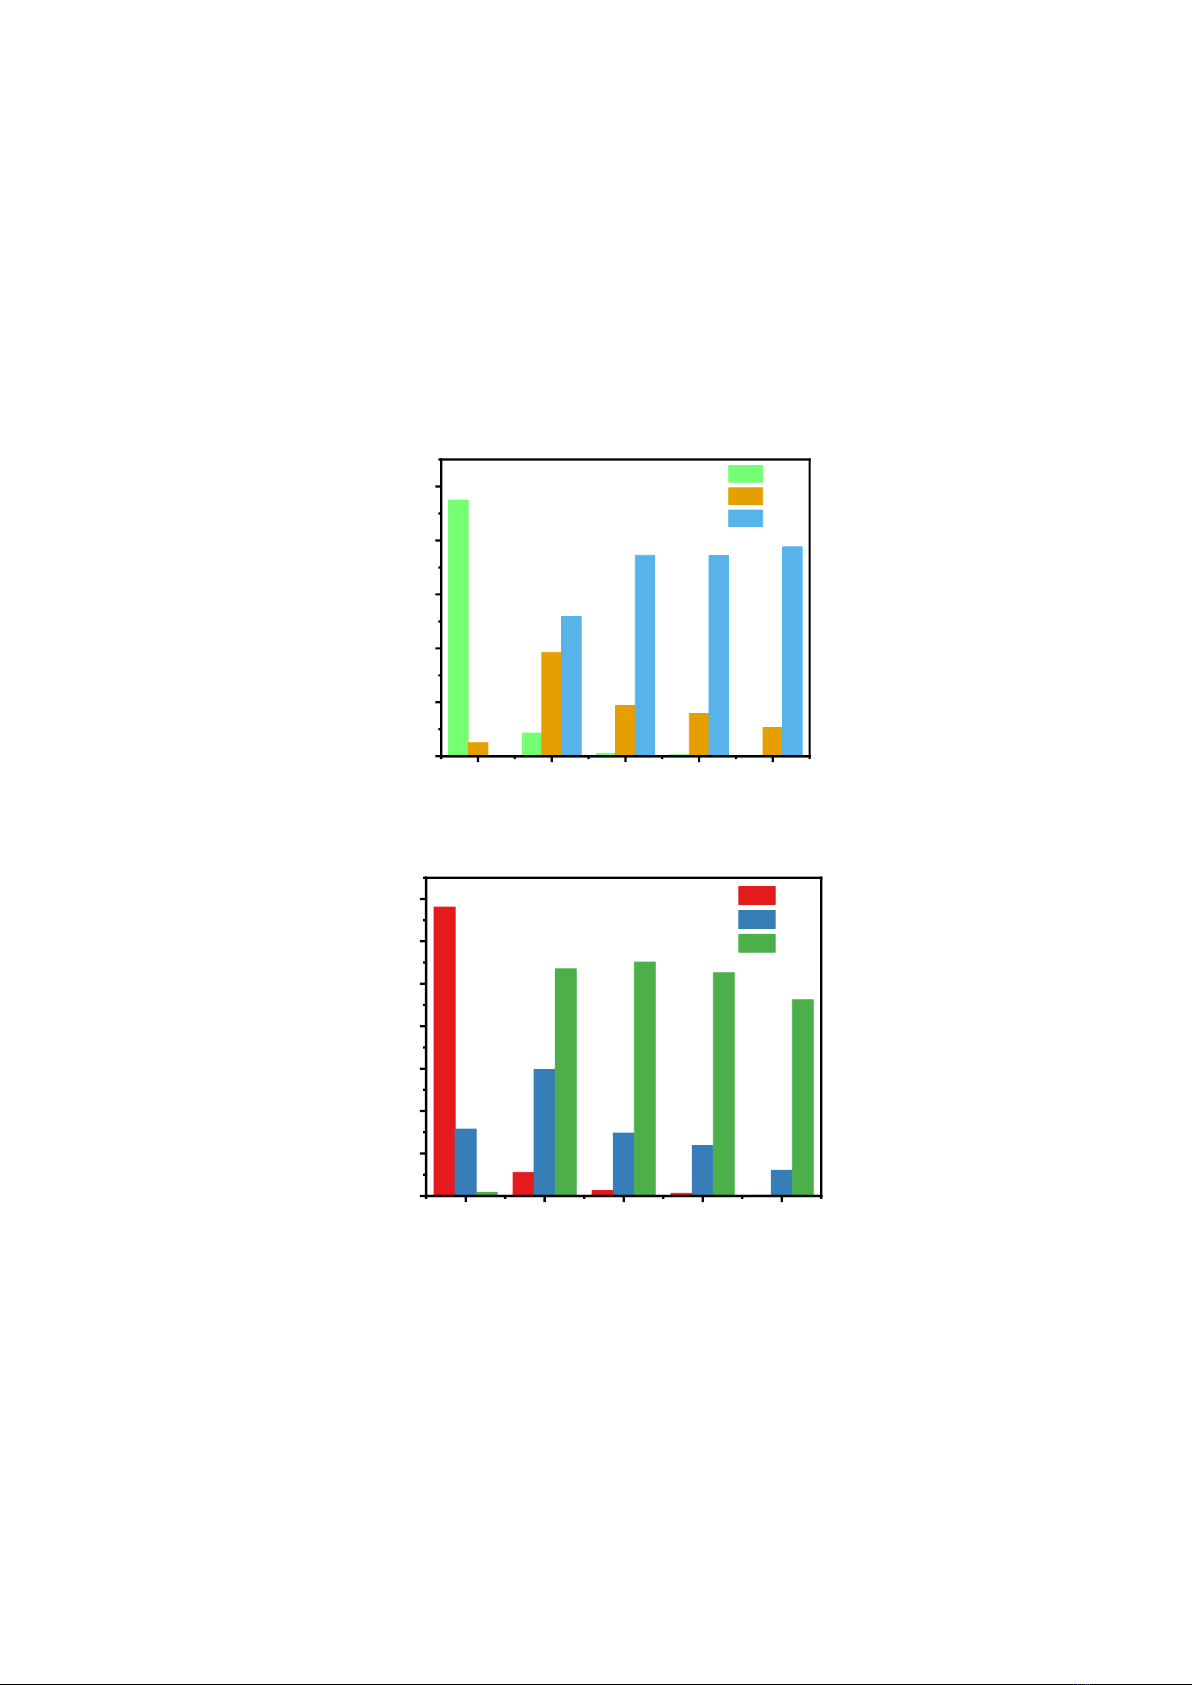
The Al–O coordination number is illustrated in Fig. 3. At ambient pressure, most of the system is
AlO4 structural units, about 68.07 %. From pressure 6 GPa, the proportion of AlO4 decreases sharply
and AlO6 increases. At a pressure of 80 GPa, the AlO4 structural units no longer appear, the ratio of
AlO6 units accounts for the largest ratio at 77.66 %. This result shows the structural transition from a
tetrahedral to an octahedral network.
Figure 2. Coordination number distribution of Si-O pairs in l-3Al2O3.2SiO2.
Figure 3. Coordination number distribution of Al-O pairs in l-3Al2O3.2SiO2.
The change in the density of atoms in the l-3Al2O3.2SiO2 system from 0 GPa to 80 GPa pressure is
shown in Table 2. When the pressure increases, the l-3Al2O3.2SiO2 model has a structural phase
transition from the low-density phase of 2.29 g/cm3 at 0 GPa to a high-density phase of 4.45 g/cm3 at 80
GPa. Particularly, the density in the model changes rapidly from 2.29 g/cm3 to 3.61 g/cm3 at 6 GPa.
0 6 40 60 80
0
20
40
60
80
100
Fraction (%)
Presure (GPa)
SiO4
SiO5
SiO6
0 6 40 60 80
0
10
20
30
40
50
60
70
Fraction (%)
Presure (GPa)
AlO4
AlO5
AlO6
P. T. Dung et al. / VNU Journal of Science: Mathematics – Physics, Vol. 41, No. 1 (2025) 26-33
30
Table 2. The change of density as a function of pressure
P (GPa)
0
6
40
60
80
Density (g/cm3)
2.29
3.61
4.05
4.25
4.45
The structural phase transition leads to a change in the OPF in the model. The OPF results are
calculated and shown in Table 3. It can be seen that OPF increases with compression pressure from 0.42
at 0 GPa to 0.58 at 80 GPa, a clear change in OPF at the point pressure 6 GPa. This indicates that 6 GPa
is the pressure at which the l-3Al2O3.2SiO2 system undergoes a phase transition from a low-density phase
to a high-density phase. The structural phase transition point corresponds to OPF = 0.58.
Table 3. The change of OPF as a function of pressure
P (Gpa)
0
6
40
60
80
OPF
0.42
0.58
0.57
0.55
0.58
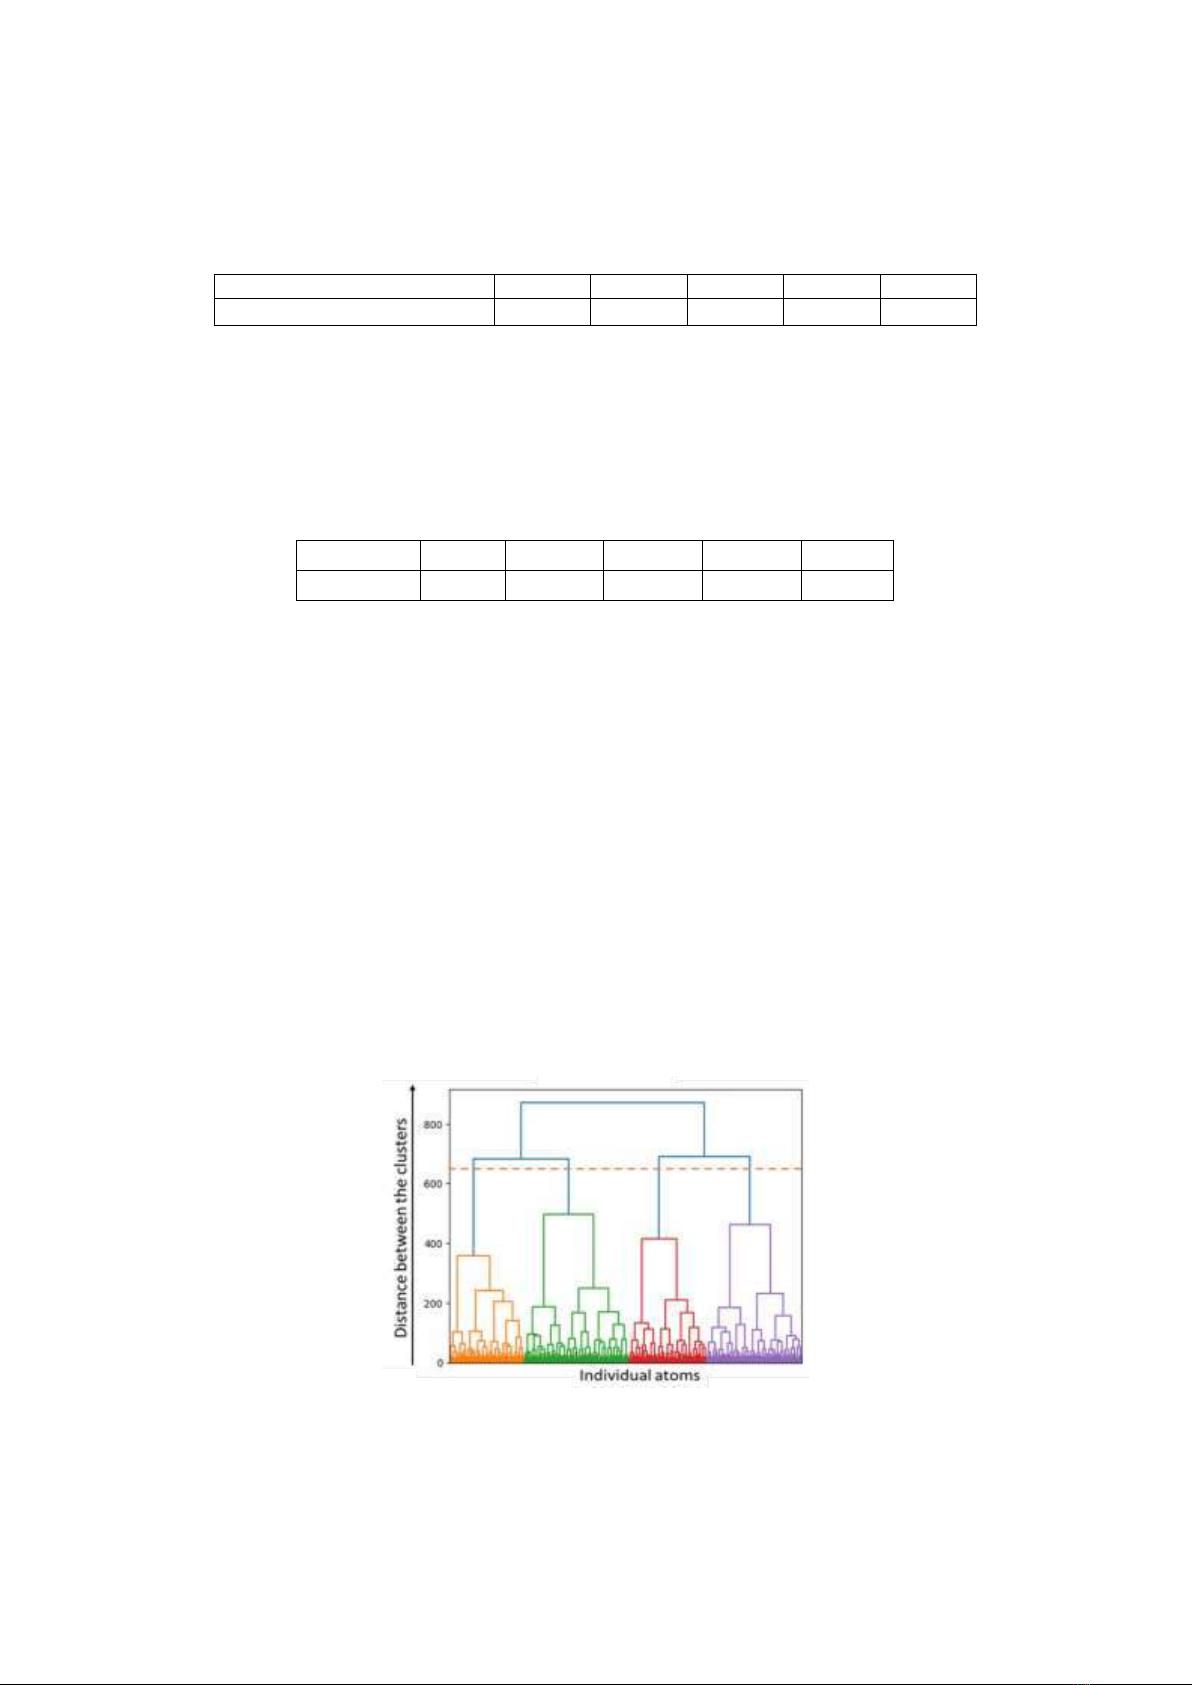
To clarify the heterogeneity of the structure and density of the system, we utilize data mining to
identify high-density regions at the phase transition point of 6 GPa. The atomic coordinate data is input
into the Agglomerative Hierarchical Clustering (AHC) algorithm to analyze the formation of clusters
within the model. In the AHC algorithm, each data point begins as an individual cluster. These clusters
are then progressively merged to form larger clusters, continuing until all points in the dataset are
combined into a single large cluster that encompasses the entire data set [21-24]. The clustering results
are visualized using a dendrogram. In this diagram, the horizontal axis represents the index order of the
observations in the original dataset, while the vertical axis indicates the dissimilarity between the
clusters. A higher value on the vertical axis signifies greater dissimilarity between the represented
clusters. By drawing a horizontal line that corresponds to the degree of cluster differentiation, we can
count the number of intersections between this line and the vertical lines in the diagram to determine
how many distinct clusters are formed [23]. From the dendrogram, it is evident that the l-3Al2O3.2SiO2
system can be divided into clusters based on this differentiation criterion.
The Silhouette index is used to determine the optimal number of clusters. In Fig. 6, the Silhouette
index shows the highest score for 2 clusters, indicating that the system can be divided into two clusters.
In this study, we utilized the DBSCAN algorithm to divide the system into two regions: the low-density
region (LDR) and the high-density region (HDR).
Figure 5. Dendrogram obtained from a hierarchical clustering method.


![Ô nhiễm không khí từ nông nghiệp: Thách thức toàn cầu và định hướng hành động [Mới nhất]](https://cdn.tailieu.vn/images/document/thumbnail/2025/20250917/kimphuong1001/135x160/52891758099584.jpg)