
RESEA R C H Open Access
Generalized cerebral atrophy seen on MRI in a
naturally exposed animal model for creutzfeldt-
jakob disease
Alexia L McKnight
1*†
, Lawrence A Minkoff
2†
, Diane L Sutton
3
, Bruce V Thomsen
4
, Perry L Habecker
5
,
Raymond W Sweeney
6
, Gary Smith
7
, Constantin A Dasanu
8
, Thomas E Ichim
9
, Doru T Alexandrescu
10
,
Joel M Stutman
11†
Abstract
Background: Magnetic resonance imaging has been used in the diagnosis of human prion diseases such as sCJD
and vCJD, but patients are scanned only when clinical signs appear, often at the late stage of disease. This study
attempts to answer the questions “Could MRI detect prion diseases before clinical symptoms appear?, and if so,
with what confidence?”
Methods: Scrapie, the prion disease of sheep, was chosen for the study because sheep can fit into a human sized
MRI scanner (and there were no large animal MRI scanners at the time of this study), and because the USDA had,
at the time of the study, a sizeable sample of scrapie exposed sheep, which we were able to use for this purpose.
111 genetically susceptible sheep that were naturally exposed to scrapie were used in this study.
Results: Our MRI findings revealed no clear, consistent hyperintense or hypointense signal changes in the brain on
either clinically affected or asymptomatic positive animals on any sequence. However, in all 37 PrP
Sc
positive sheep
(28 asymptomatic and 9 symptomatic), there was a greater ventricle to cerebrum area ratio on MRI compared to
74 PrP
Sc
negative sheep from the scrapie exposed flock and 6 control sheep from certified scrapie free flocks as
defined by immunohistochemistry (IHC).
Conclusions: Our findings indicate that MRI imaging can detect diffuse cerebral atrophy in asymptomatic and
symptomatic sheep infected with scrapie. Nine of these 37 positive sheep, including 2 one-year old animals, were
PrP
Sc
positive only in lymph tissues but PrP
Sc
negative in the brain. This suggests either 1) that the cerebral
atrophy/neuronal loss is not directly related to the accumulation of PrP
Sc
within the brain or 2) that the amount of
PrP
Sc
in the brain is below the detectable limits of the utilized immunohistochemistry assay. The significance of
these findings remains to be confirmed in human subjects with CJD.
Background
Scrapie was first reported in 1730 in sheep and goats
and is the longest known transmissible spongiform
encephalopathy (TSE) [1]. In the past two decades, TSEs
have received much attention since ingestion of bovine
spongiform encephalopathy (BSE) infected beef was cau-
sally linked to the variant form of CJD (vCJD) [2]. These
TSE diseases are progressively debilitating and invariably
fatal neurodegenerative diseases that have very long
incubation periods and unique neuropathological
changes. The most widely accepted cause of the TSE
diseases is an abnormal prion protein, identified as
PrP
Sc
in the case of scrapie, which is a stereoisomer of
the normal prion protein (PrP
C
).
Ante-mortem diagnosis of the TSE diseases, in gen-
eral, has proven to be quite challenging. MRI has been
useful in CJD patients –with both the sporadic and var-
iant forms. It is helpful in the exclusion of other neuro-
degenerative diseases as well as, in some cases, the
positive diagnosis of sCJD or vCJD [3-6]. For example,
* Correspondence: alexia@mcknightinsight.com
†Contributed equally
1
Assistant Professor of Radiology, University of Pennsylvania School of
Veterinary Medicine, New Bolton Center, Kennett Square, PA 19348, USA
Full list of author information is available at the end of the article
McKnight et al.Journal of Translational Medicine 2010, 8:125
http://www.translational-medicine.com/content/8/1/125
© 2010 McKnight et al; licensee BioMed Central Ltd. This is an Open Access article distributed under the terms of the Creative
Commons Attribution License (http://creativecommons.org/licenses/by/2.0), which permits unrestricted use, distribution, and
reproduction in any medium, provided the original work is properly cited.

in a study of 162 sCJD cases, bilateral basal ganglia
hyperintensity was found to be 67% sensitive and 94%
specific. MRI findings included hyperintense alterations
and/or brain atrophy, alone or in combination with each
other. A normal MRI without any hyperintense changes
or atrophy was seen in 27.2% (44/162) patients [3]. A
bilaterally symmetric hyperintense pulvinar, or the
“hockey stick sign”,isreportedtobepresentin80%of
vCJD patients in some studies [4,5,7]. CJD patients,
however, present with clinical symptoms at a relatively
late stage of the disease.
MRI abnormalities are reported in pre-symptomatic
mice experimentally infected (intraperitoneally) with
scrapie. The study was performed at 9.4T, and a hyper-
intense septum and hippocampus were seen at 120 days
post infection, approximately 60 days prior to the onset
of clinical signs. Additional cortical and thalamic
abnormalities were seen at 180 days post infection,
when clinical signs became apparent [8].
Other MRI studies by Chung et al. in rodent scrapie
models correlate MRI signal changes to neuoropathol-
ogy [9,10]. One hamster model, performed at 4.7T, with
scrapie induced intra-cerebral injections revealed a cor-
relation with increased T2 signal and gliosis, and
decreased T2 signal with vacuolization. In some areas
with marked gliosis and vacuolization, no MRI signal
changes were seen suggesting a T2 cancelling effect [10].
In contrast to Chung’sfindingsinhamsters,Haik
et al. found no association of MRI signal change in two
CJD patients with gliosis and no clear association with
spongiform change. There was, however, strong correla-
tion of MRI signal change with accumulation of PrP
Sc
in
the both the sCJD and the vCJD patient [11].
Unlike experimentally induced scrapie rodent models
that have a different course of disease than natural
infection and CJD patients that present with an
advanced stage of disease, a naturally exposed scrapie
flock is typically composed of sheep in various stages of
disease. For this reason, these animals are considered a
good model to study MRI findings in scrapie as a model
for the TSE diseases. Our objective was to study the
consistent MRI findings in a large flock of scrapie posi-
tive animals as confirmed by immunohistochemistry.
The purpose was twofold: 1) to better understand TSE
diseases by evaluating the MRI finding in naturally
infected sheep, and 2) to assess the accuracy of MRI in
the detection of TSE in both symptomatic and asympto-
matic sheep.
Methods
Flock information
One hundred eleven scrapie-exposed sheep with the
scrapie susceptible QQ
171
genotype were used in this
study. The sheep originated from a single commercial
scrapie flock in the Midwest United States that was to
be depopulated for regulatory reasons. The flock was
comprised of 62 black faced breeds (24 Hampshire, 39
Suffolk,1unknownblackfaced),37Westernwhite
faced sheep which entered the flock as adults prior to
this study, and 12 brockel faced sheep born of the white
faced ewes and black faced rams. The sheep ranged in
age from 1-9 years old with the oldest sheep primarily
the Western white faced breed.
Six additional sheep were purchased from two sepa-
rate certified scrapie free flocks; five were black faced
and one was white faced. They ranged in age from 2-8
years and served as known negative controls.
MRI Examinations - Part I
Brain MR examinations were initially done on the 6
negative control animals and the 24 scrapie positive
sheep which were identified by an immunohistochemis-
trytestofsurgicallycollected3
rd
eyelid lymph tissue
from the 76 black and brockel faced sheep [12,13]. Each
animal was scanned live under general anaesthesia and
then recovered with the exception of the three most
clinically affected animals, which were euthanized after
the MRI exam, and one sheep that died during induc-
tion. We used a mobile 1T GE Signa LX MRI system
(General Electric, Milwaukee, WI) with the general pur-
pose flex coil wrapped around the dorsal and lateral
aspects of the head. The following pulse sequences were
obtained: T1- and T2-weighted fast spin echo, proton
density (PD), inversion recovery (IR), fluid attenuated
inversion recovery (FLAIR), and diffusion weighted ima-
ging (DWI). The slice parameters were 3 mm thickness,
0 gap, 14 cm FOV for PD, T1, T2, IR, and FLAIR; for
DWI 4 mm thickness, 0 gap, 22 cm FOV. Where possi-
ble 23 slices in the each of the axial, sagittal, and coro-
nal planes were obtained.
MRI Examinations - Part II
Based on the findings from Part I, all 113 remaining
sheep were examined or re-examined by the same MRI
protocol (with the exception of the T1 and FLAIR
sequences) immediately following euthanasia.
Quantitative Analysis
Lateral ventricle to cerebrum area ratios (V/C ratio)
were calculated in all sheep. The V/C ratio is calculated
by the following formula:
Lateral ventricle to cerebrum Ratio Lateral ventricle area=//
*
(cerebrum area
lateral ventricle area) 100 or,
more conc
−
iisely: V C A /(A -A ) 100 and is reported as a percent./*=
VCV
It is the area of the lateral ventricle normalized to the
area of the sheep’s cerebrum area as imaged in that
sagittal slice, and the value is reported as a per cent. It
McKnight et al.Journal of Translational Medicine 2010, 8:125
http://www.translational-medicine.com/content/8/1/125
Page 2 of 8

is an effort to measure the size of this sheep’s lateral
ventricle area as related to its own cerebrum area (with-
out the ventricle area included in the cerebrum area).
On the FSE T2 weighted sequences, a sagittal slice 3-5
mm off midline that had the largest lateral ventricular
area was used for the measurements. As shown in Fig-
ure 1, regions of interest were drawn around the border
of the lateral ventricle and, in the same slice, around the
cerebrum.
Two scientists measured the areas using two different
methods on different computers with no communica-
tion between them regarding their results. The scientists
did their work in separate locations at different times
with no communication regarding the V/C results. Both
used mouse pointers to trace the outlines of the lateral
ventricle and the cerebrum in the same slice as defined
above.
Scientist A used Adobe’s Photoshop software and their
“Magnetic Lasso”technology with the following para-
meters: feather = zero pixels; anti-aliased = on; width =
3 pixels; edge contrast = 100%, and frequency = 100.
Scientist B wrote his own software code in Microsoft
Visual Basic 6.0 with DicomObjects.ocx as the DICOM
interface and created a routine which counts pixels
inside bounded planar regions. Dicomobjects.ocx is a
library of compiled software enabling DICOM files to be
studied using many different higher level programming
languages for control. http://www.medicalconnections.
co.uk.
Both techniques used exactly the same definition of
the boundary between the cerebrum from the cerebel-
lum, the only place in the slices of interest in which the
boundary was less clear than all other tissue boundaries:
this required a line drawing rule over that narrow
region, which rule was used by both. Resulting percen-
tages were similar, only varying by a small multiplicative
constant; and, finally, both obtained similar graphs.
For the total data set of 117 sheep, the inter-observer
reliability (correlation coefficient) between the scientist
A and scientist B was 0.85 by the Pearson Product
Moment Method and 0.87 by the Spearman Rank Order
Method.
Laboratory analysis
Scrapie testing by immunohistochemistry procedures
followed the standard protocols used in the United
States Department of Agriculture (USDA) scrapie eradi-
cation program and are similar to those described pre-
viously [13]. The pre-mortem third eyelid tissues were
evaluated at the University of Wyoming (EW) and post-
mortem sections of medulla at the obex, medial retro-
pharyngeal lymph node and tonsil were examined at the
National Veterinary Services Laboratory in Ames, IA
(BT). Briefly, tissue sections were deparaffinized, rehy-
drated, treated with 95% formic acid (lymph tissue only)
and then autoclaved in an antigen retrieval solution
obtained from DakoCytomation, Carpinteria, CA, USA
[14]. The sections were stained with an automated
immunohistochemistry system (by Ventana Medical Sys-
tems, Tucson, AZ USA) which used a mixture of two
monoclonal antibodies, F89/160.1.5 and F99/97.6.1, to
detect prion protein [13]. Known positive and negative
tissue samples were run as controls for each group of
slides. The slides were interpreted independently of the
MRI results. Later, additional areas of the brain (4 areas
of the cerebrum and l section each of the thalamus, ros-
tral colliculus, pons and cerebellum) were examined by
IHC on eight of the nine animals which were found to
be positive only on lymph tissue and negative on brain
samples at the level of the obex.
All sheep were genotyped at codons 171, 136, and
154. There were only 4 genotypes present in the 117
sheep: 97 AARRQQ; 4 AARHQQ; 4 AARRQR; and 12
AVRRQQ.
Clinical examinations
All 111 scrapie exposed sheep were evaluated clinically
for neurological signs consistent with scrapie. The 24
eyelid positive animals weremorethoroughlyexamined
by recording the following parameters: body condition
score, percent wool loss, presence of ataxia, and
trembling.
Statistical analysis
The extent to which the MRI results discriminate
between “scrapie”and “not scrapie”was evaluated using
a receiver operating characteristic (ROC) curve
Figure 1 The quantitative analysis in this study was performed
by outlining the perimeter of the lateral ventricle and the
cerebrum on a sagittal slice 3-5 mm from midline where the
largest area of lateral ventricle was present. The areas were
determined and the ventricle to cerebrum ratio (V/C ratio) was then
calculated.
McKnight et al.Journal of Translational Medicine 2010, 8:125
http://www.translational-medicine.com/content/8/1/125
Page 3 of 8

consisting of a graph of sensitivity versus one minus
specificity as the cutoff is varied. The parameters and
characteristics of the ROC curve was estimated from the
data using STATA (Statacorp, 2001). The area under
the ROC curve is used as a summary measure of the
extent of the discrimination [15].
Approvals
All aspects of this study were approved by the Univer-
sity of Pennsylvania’s Institutional Animal Care and Use
Committee, Environmental Health and Radiation Safety,
and the Pennsylvania Department of Agriculture.
Results
The clinical signs of scrapie, trembling and ataxia with
various combinations of wool loss and/or thin body con-
dition score, were only identified in 9 sheep. The other
102 sheep in the infected flock showed no detectable
signs consistent with scrapie. IHC testing found 37 out
of111sheeppositiveforscrapiewith9of37sheep
positive only on lymph tissues. Eight of these 9 lymph-
only positive sheep remained PrP
Sc
negative following
additional IHC testing on multiple areas of the brain.
Additional brain samples were unavailable for testing on
the single remaining animal.
The third eyelid test identified 24/76 (31%) sheep as
PrP
Sc
positive. Performing the eyelid test allowed an
antemortem diagnosis to identify several scrapie infected
sheep. In Part I of the study when brain MRI exams of
these eyelid positive animals were compared to the 6
control animals, no clear, consistent MRI signal changes
were noted in the brain of either the 9 clinically affected
or the 15 asymptomatic sheep on any pulse sequence.
As seen in Figure 2, the most severely affected clinical
animals had hyperintense adipose tissue, predominantly
within the medullary cavity of the skull and around the
retropharyngeal lymph nodes, corresponding with serous
atrophy secondary to emaciation. There was also mild
subjective enlargement of the lateral ventricles with sul-
cal prominence in the most clinically affected sheep
indicative of diffuse cerebral atrophy (Figure 2). This
finding prompted quantitative evaluation in all sheep.
The results of the quantitative analysis following Part
II of the study are shown in Figures 3 and 4. The 37
PrP
Sc
positive sheep had larger V/C ratios compared to
the PrP
Sc
negative sheep (Figure 3). Interestingly, 9 of
these 37 sheep, including 2 one-year olds, were PrP
Sc
positive in the retropharyngeal lymph nodes and/or ton-
sils but negative in the brain (Figure 4). As seen in Fig-
ure 4, no correlation with the V/C ratios with age was
seen. Almost all animals with a V/C ratio over 15%
showed clinical symptoms of scrapie.
The 37 PrP
Sc
positive sheep fall into the following
genotypes: 36 of 97 AARRQQ; 0 of 4 AARHQQ; 0 of 4
AARRQR; and 1 of 12 AVRRQQ. Every score above
10.4% corresponded to a PrP
Sc
positive and every score
below 9.5% corresponded to a negative: there was only a
10.25% overlap in scores, and most importantly only
8.75% false negatives when all scores are considered and
the above cutoffs are not used.
In addition, it is noteworthy that the AVRRQQ sub-
jects are, despite their relatively small N, the most
ambiguous, in that 5 of the 11 negatives with this geno-
type fall into the upper quartile of all negative scores;
this ‘leaning’towards the high end of the negative distri-
bution, might serve to suggest that over time this geno-
type might turn out to be the most likely to shift from
negative to positive, and in future work should receive
special attention regarding possible false negatives.
The ROC curve is shown in Figure 5. The area under
the curve was 0.99 (95% confidence interval, 0.98-1.00).
As described in Hosmer and Lemeshow (page 162), this
is in the “outstanding discrimination”range [15].
Discussion
The 111 scrapie exposed QQ sheep used in this study
are from a single commercial flock in the Midwest Uni-
ted States that had a high prevalence of infection (33%
of the QQ animals were PrP
Sc
positive on post-mortem
IHC). Because there was a wide range in ages, multiple
breeds, and clinical stages of the disease progression,
this flock was considered a good model for evaluating
MRI findings in scrapie positive sheep. The MRI find-
ings correlated with IHC results in each of the breeds
examined. The scrapie associated MRI changes detected
subclinically infected animals and also detected 10 ani-
mals which were not identified by the current antemor-
tem third eyelid test.
MRI signal abnormalities were not seen consistently
on T2, FLAIR, or PD weighted images in this flock as
reported in CJD patients and rodent scrapie models.
Although similar inconsistencies are also seen in people,
hyperintense changes in this study were a rare finding.
Reasonsforthehyperintensechangeinsomeanimals
and not others remain unclear. Meissner et al. found a
correlationbetweenthepresenceandabsenceofMRI
findings and the CJD genotype in human patients [6].
The genotypes of this flock are very homogeneous and
could explain the relative uniform lack of MRI signal
abnormality.
The animals with the most severe clinical signs had
the highest ventricular to cerebrum ratios; almost all
animals with a V/C ratio over 15% showed clinical
symptoms of scrapie. For this reason, we believe that
enlarged ventricular to cerebral ratios may be positively
correlated with disease progression. Similar correlations
between brain atrophy as seen on MRI and progression
of clinical disease have also been reported in other
McKnight et al.Journal of Translational Medicine 2010, 8:125
http://www.translational-medicine.com/content/8/1/125
Page 4 of 8
neurodegenerative diseases such as Alzheimer’sdisease
[16] and multiple sclerosis [17,18].
Ventricular enlargement with sulcal prominence is
typical of brain atrophy on MRI examinations
[16,19,20]. This observation in the most clinically
affected animals suggested similar evidence of cerebral
atrophy/neuronal loss that has been reported in CJD
patients[3] and a rodent scrapie model[10] with
advanced disease. Particularly noteworthy was the find-
ing, following quantitative analysis of all 117 sheep (111
scrapie exposed and 6 normal controls) that cerebral
atrophy was a consistent finding in the 37 PrP
Sc
animals,
even among the asymptomatic sheep and, of particular
interest, in the 2 positive one-year old sheep. The quan-
tification of certain brain parameters on MR images,
such as the V/C ratio as used in this study, may be con-
sidered as an ante-mortem tool for live animals at risk
for scrapie, including young animals.
The pathophysiologic process that would explain dif-
fuse cerebral atrophy in young asymptomatic sheep is
unclear. The progression of scrapie in the naturally
infected animal begins with an oral infection. Particu-
larly susceptible in the perinatal period, lambs first show
evidence of PrP
Sc
in the Peyer’s patches, medial retro-
pharyngeal lymph nodes, mesenteric lymph nodes, and
tonsils about 2-5 months after birth [21-23] In approxi-
mately 12-18 months, but as early as 9-10 months,
PrP
Sc
enters the central nervous system and can be first
found in the obex of the medulla and the T8-T10 thor-
acic spinal cord segments [22,24] At the terminal stage
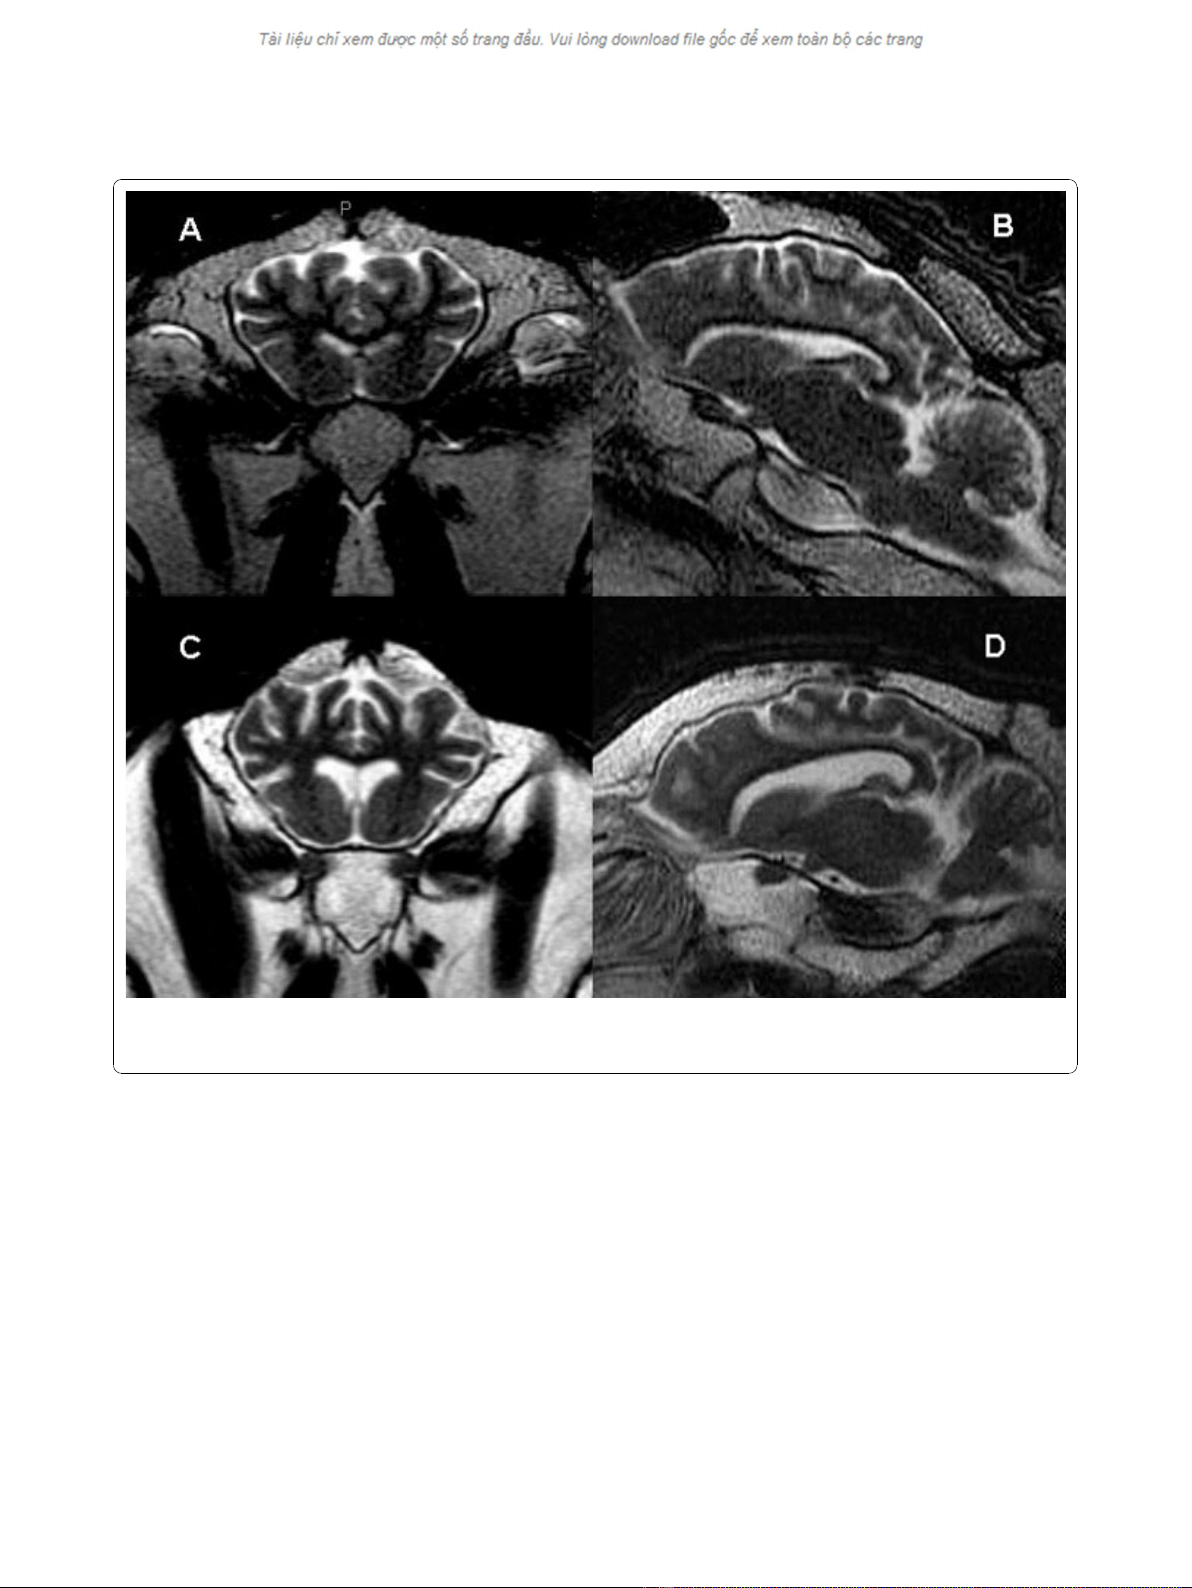
Figure 2 Axial and sagittal MR images of a normal control sheep (A and B) compared to the most clinically affected animal in the
study (C and D). The sulcal prominence and enlarged lateral ventricles indicative of diffuse cerebral atrophy are seen in the scrapie affected
sheep.
McKnight et al.Journal of Translational Medicine 2010, 8:125
http://www.translational-medicine.com/content/8/1/125
Page 5 of 8


%20--%3e%3cdefs%3e%3cstyle%3e%20.st0%20{%20fill:%20%23fff;%20}%20.st1%20{%20fill:%20%237800fa;%20}%20%3c/style%3e%3c/defs%3e%3cpath%20class='st1'%20d='M117.78,12.18H43.11c2.9,3.47,4.65,7.94,4.65,12.82,0,5.6-2.3,10.66-6.01,14.29h76.02l7.22-13.56-7.22-13.56Z'/%3e%3cg%3e%3cpath%20class='st0'%20d='M53.58,26.17h-.59v-1.46h.59v-4.96h2.83c1.78,0,2.67.94,2.67,2.82v5.76c0,1.87-.89,2.81-2.67,2.81h-2.83v-4.96ZM55.36,21.37v3.34h1.1v1.46h-1.1v3.34h1.01c.61,0,.91-.37.91-1.1v-5.93c0-.74-.3-1.1-.91-1.1h-1.01Z'/%3e%3cpath%20class='st0'%20d='M65.99,31.14h-1.8l-.31-2.07h-2.19l-.31,2.07h-1.64l1.82-11.39h2.62l1.82,11.39ZM65.28,18.04c-.25.46-.51.77-.75.94-.21.15-.47.22-.79.22-.26,0-.57-.07-.92-.22l-.38-.15c-.14-.05-.26-.07-.37-.07-.3,0-.53.18-.71.54l-.91-.68c.25-.46.51-.77.75-.94.21-.14.48-.21.79-.21.26,0,.57.07.92.21l.38.15c.14.05.26.07.37.07.3,0,.53-.18.71-.54l.91.68ZM61.91,27.52h1.73l-.87-5.76-.87,5.76Z'/%3e%3cpath%20class='st0'%20d='M74.53,26.89v1.52c0,1.91-.89,2.86-2.67,2.86s-2.67-.95-2.67-2.86v-5.93c0-1.91.89-2.86,2.67-2.86s2.67.95,2.67,2.86v1.11h-1.69v-1.22c0-.75-.31-1.12-.93-1.12s-.93.37-.93,1.12v6.15c0,.74.31,1.11.93,1.11s.93-.37.93-1.11v-1.63h1.69Z'/%3e%3cpath%20class='st0'%20d='M81.4,31.14h-1.8l-.31-2.07h-2.19l-.31,2.07h-1.64l1.82-11.39h2.62l1.82,11.39ZM75.9,19.2l1.52-1.91h1.71l1.51,1.91h-1.61l-.76-.95-.75.95h-1.61ZM77.32,27.52h1.73l-.87-5.76-.87,5.76ZM83.1,15.99l-1.76,1.91h-1.26l1.17-1.91h1.86Z'/%3e%3cpath%20class='st0'%20d='M84.86,19.75c1.78,0,2.67.94,2.67,2.82v1.48c0,1.87-.89,2.81-2.67,2.81h-.85v4.28h-1.79v-11.39h2.64ZM84.01,21.37v3.86h.85c.58,0,.87-.36.87-1.08v-1.71c0-.71-.29-1.07-.87-1.07h-.85Z'/%3e%3cpath%20class='st0'%20d='M93.51,19.75c1.78,0,2.67.94,2.67,2.82v1.48c0,1.87-.89,2.81-2.67,2.81h-.85v4.28h-1.79v-11.39h2.64ZM92.66,21.37v3.86h.85c.58,0,.87-.36.87-1.08v-1.71c0-.71-.29-1.07-.87-1.07h-.85Z'/%3e%3cpath%20class='st0'%20d='M98.8,31.14h-1.79v-11.39h1.79v4.88h2.03v-4.88h1.83v11.39h-1.83v-4.88h-2.03v4.88Z'/%3e%3cpath%20class='st0'%20d='M105.36,24.55h2.46v1.62h-2.46v3.34h3.09v1.63h-4.88v-11.39h4.88v1.63h-3.09v3.18ZM108.17,17.29l-1.76,1.91h-1.26l1.17-1.91h1.86Z'/%3e%3cpath%20class='st0'%20d='M112.2,19.75c1.78,0,2.67.94,2.67,2.82v1.48c0,1.87-.89,2.81-2.67,2.81h-.85v4.28h-1.79v-11.39h2.64ZM111.35,21.37v3.86h.85c.58,0,.87-.36.87-1.08v-1.71c0-.71-.29-1.07-.87-1.07h-.85Z'/%3e%3c/g%3e%3ccircle%20class='st1'%20cx='25'%20cy='25'%20r='20'/%3e%3cpath%20class='st0'%20d='M32.78,19.27c2.92,0,4.43,2.55,5.28,5.33l.71,2.17c.14.38-.33.75-.71.75h-5.61c.19-.33.24-.71.09-1.08l-.75-2.45c-.43-1.32-.99-2.64-1.79-3.77.75-.57,1.65-.94,2.78-.94h0ZM25,18.38c3.25,0,4.9,2.78,5.89,5.89l.76,2.45c.14.42-.33.8-.8.8h-11.69c-.42,0-.94-.38-.8-.8l.75-2.45c.99-3.11,2.64-5.89,5.89-5.89h0ZM25,11.35c1.74,0,3.11,1.37,3.11,3.11s-1.37,3.11-3.11,3.11-3.11-1.41-3.11-3.11,1.41-3.11,3.11-3.11h0ZM17.27,19.27c1.08,0,1.98.38,2.73.94-.8,1.13-1.37,2.45-1.74,3.77l-.8,2.45c-.14.38-.05.75.09,1.08h-5.56c-.42,0-.9-.38-.75-.75l.71-2.17c.9-2.78,2.41-5.33,5.33-5.33h0ZM17.27,12.91c1.51,0,2.78,1.27,2.78,2.83s-1.27,2.83-2.78,2.83-2.83-1.27-2.83-2.83,1.27-2.83,2.83-2.83h0ZM32.78,12.91c1.56,0,2.78,1.27,2.78,2.83s-1.23,2.83-2.78,2.83-2.83-1.27-2.83-2.83,1.27-2.83,2.83-2.83h0ZM27.07,28.56v.09c0,.57-.24,1.08-.61,1.46h0v.05c-.38.33-.9.57-1.46.57s-1.08-.24-1.46-.61h0c-.38-.38-.61-.9-.61-1.46v-.09h1.41v.09c0,.19.05.38.19.47v.05c.09.09.28.19.47.19s.38-.09.47-.19v-.05c.14-.09.24-.28.24-.47t-.05-.09h1.41ZM30.99,28.56v.09c0,1.65-.66,3.16-1.74,4.24-1.08,1.08-2.59,1.79-4.24,1.79s-3.16-.71-4.24-1.79l-.05-.05c-1.04-1.08-1.7-2.55-1.7-4.2v-.09h1.41v.09c0,1.27.47,2.4,1.27,3.25h.05c.85.85,1.98,1.37,3.25,1.37s2.4-.52,3.25-1.37c.85-.8,1.37-1.98,1.37-3.25v-.09h1.37ZM34.99,28.56v.09c0,2.78-1.13,5.28-2.92,7.07-1.79,1.79-4.29,2.92-7.07,2.92s-5.23-1.13-7.07-2.92c-1.79-1.79-2.92-4.29-2.92-7.07v-.09h1.41v.09c0,2.4.94,4.53,2.5,6.08,1.56,1.56,3.72,2.5,6.08,2.5s4.52-.94,6.08-2.5c1.56-1.56,2.5-3.68,2.5-6.08v-.09h1.41Z'/%3e%3c/svg%3e)