
BioMed Central
Page 1 of 13
(page number not for citation purposes)
Journal of Translational Medicine
Open Access
Research
Mass spectrometry-based serum proteome pattern analysis in
molecular diagnostics of early stage breast cancer
Monika Pietrowska†1, Lukasz Marczak†2, Joanna Polanska†3,
Katarzyna Behrendt1, Elzbieta Nowicka1, Anna Walaszczyk1,
Aleksandra Chmura1, Regina Deja1, Maciej Stobiecki2, Andrzej Polanski3,4,
Rafal Tarnawski1 and Piotr Widlak*1
Address: 1Maria Skłodowska-Curie Memorial Cancer Center and Institute of Oncology, Gliwice, Poland, 2Polish Academy of Science, Institute of
Bioorganic Chemistry, Poznan, Poland, 3Silesian University of Technology, Gliwice, Poland and 4Polish-Japanese Institute of Information
Technology, Bytom, Poland
Email: Monika Pietrowska - m_pietrowska@io.gliwice.pl; Lukasz Marczak - lukasmar@ibch.poznan.pl;
Joanna Polanska - joanna.polanska@polsl.pl; Katarzyna Behrendt - kbehrendt@io.gliwice.pl; Elzbieta Nowicka - enowicka@io.gliwice.pl;
Anna Walaszczyk - awalaszczyk@io.gliwice.pl; Aleksandra Chmura - bialka@io.gliwice.pl; Regina Deja - markery@io.gliwice.pl;
Maciej Stobiecki - mackis@ibch.poznan.pl; Andrzej Polanski - andrzej.polanski@polsl.pl; Rafal Tarnawski - rafaltarnawski@gmail.com;
Piotr Widlak* - widlak@io.gliwice.pl
* Corresponding author †Equal contributors
Abstract
Background: Mass spectrometric analysis of the blood proteome is an emerging method of
clinical proteomics. The approach exploiting multi-protein/peptide sets (fingerprints) detected by
mass spectrometry that reflect overall features of a specimen's proteome, termed proteome
pattern analysis, have been already shown in several studies to have applicability in cancer
diagnostics. We aimed to identify serum proteome patterns specific for early stage breast cancer
patients using MALDI-ToF mass spectrometry.
Methods: Blood samples were collected before the start of therapy in a group of 92 patients
diagnosed at stages I and II of the disease, and in a group of age-matched healthy controls (104
women). Serum specimens were purified and the low-molecular-weight proteome fraction was
examined using MALDI-ToF mass spectrometry after removal of albumin and other high-
molecular-weight serum proteins. Protein ions registered in a mass range between 2,000 and
10,000 Da were analyzed using a new bioinformatic tool created in our group, which included
modeling spectra as a sum of Gaussian bell-shaped curves.
Results: We have identified features of serum proteome patterns that were significantly different
between blood samples of healthy individuals and early stage breast cancer patients. The classifier
built of three spectral components that differentiated controls and cancer patients had 83%
sensitivity and 85% specificity. Spectral components (i.e., protein ions) that were the most frequent
in such classifiers had approximate m/z values of 2303, 2866 and 3579 Da (a biomarker built from
these three components showed 88% sensitivity and 78% specificity). Of note, we did not find a
significant correlation between features of serum proteome patterns and established prognostic or
predictive factors like tumor size, nodal involvement, histopathological grade, estrogen and
progesterone receptor expression. In addition, we observed a significantly (p = 0.0003) increased
Published: 13 July 2009
Journal of Translational Medicine 2009, 7:60 doi:10.1186/1479-5876-7-60
Received: 21 April 2009
Accepted: 13 July 2009
This article is available from: http://www.translational-medicine.com/content/7/1/60
© 2009 Pietrowska et al; licensee BioMed Central Ltd.
This is an Open Access article distributed under the terms of the Creative Commons Attribution License (http://creativecommons.org/licenses/by/2.0),
which permits unrestricted use, distribution, and reproduction in any medium, provided the original work is properly cited.

Journal of Translational Medicine 2009, 7:60 http://www.translational-medicine.com/content/7/1/60
Page 2 of 13
(page number not for citation purposes)
level of osteopontin in blood of the group of cancer patients studied (however, the plasma level of
osteopontin classified cancer samples with 88% sensitivity but only 28% specificity).
Conclusion: MALDI-ToF spectrometry of serum has an obvious potential to differentiate samples
between early breast cancer patients and healthy controls. Importantly, a classifier built on MS-
based serum proteome patterns outperforms available protein biomarkers analyzed in blood by
immunoassays.
Background
In recent years cancer diagnostics has been taking enor-
mous advantage of genomics and proteomics, novel fields
of modern biology. Proteomics is the study of the pro-
teome, the complete protein components of the cell, tis-
sue or organism, which in contrast to the genome is
dynamic and fluctuates depending on a combination of
numerous internal and external factors (e.g., physiologi-
cal status, dietary behavior, stress, disease and medical
treatment). Identifying and understanding changes in the
proteome related to disease development and therapy
progression is the subject of clinical/disease proteomics
[1,2]. It is currently well appreciated that because of the
complexity of molecular processes involved in cancer no
particular molecular feature alone, neither gene nor pro-
tein, could be a reliable biomarker in cancer diagnosis.
Instead, multi-component molecular classifiers, exempli-
fied by multi-gene cancer signatures implemented in the
functional genomics field, are built and successfully
applied. Multi-gene signatures identified for breast cancer
have proved their diagnostic power even though detailed
knowledge about the function of particular genes that
build such signatures may not be available at present
[3,4].
The low molecular weight (<10 kDa) component of the
blood proteome is a promising source of previously
undiscovered biomarkers. Since this protein fraction is
below the limit of effective resolution of conventional gel
electrophoresis, mass spectrometric analysis appears to be
a method of choice [5], and consequently is an emerging
method of clinical proteomics and cancer diagnostics [rev.
in: [6-9]]. The milestone paper in this field was published
in 2002 by the group of Petricoin and Liotta, who showed
that components of the serum proteome identified by
mass spectrometry differentiate patients with ovarian can-
cer from healthy individuals [10]. Since that time, in spite
of a certain controversy regarding this pioneering work
[11], numerous papers have been published that aimed to
verify the applicability of mass spectrometric analyses of
the serum (or plasma) proteome for cancer diagnostics.
Although no single peptide could be expected to be a reli-
able bio-marker in such analyses, multi-peptide sets of
markers selected in numerical tests have been shown
already in a few studies to have potential prognostic and
predictive values for cancer diagnostics [rev. in: [12-16]].
The approach that takes into consideration features of the
whole proteome, e.g. protein fingerprints given by mass
spectra or 2D gel electrophoresis but does not rely on par-
ticular identified protein(s), could be called proteome
pattern analysis or proteome profiling. In this approach,
whose strategy is similar to the search for multi-gene sig-
natures in functional genomics, multi-component sets of
peptides/proteins (which are exemplified by ions regis-
tered at defined m/z values in the mass spectrum) define
specific proteomic patterns (or profiles), allowing one to
classify samples even though their particular components
lack differentiating power when analyzed separately.
Importantly, such pattern/profile reflects features of the
specimen's proteome and allows its classification even
without detailed knowledge about particular elements
[17-19]. Mass spectrometry methods particularly suitable
for proteome pattern analysis are Matrix-Assisted Laser
Desorption-Ionization spectrometry (MALDI) and its
derivative Surface-Enhanced Laser Desorption/Ionization
spectrometry (SELDI) coupled to a Time-of-Flight (ToF)
analyzer, which combine high throughput, fair sensitivity
and accuracy of annotation of m/z values of ions in
recorded mass spectra of complex protein mixtures such
as biological specimens [20,21]. The relevance of mass
spectrometry-based serum (or plasma) proteome pattern
analysis has been already tested for several type of human
malignancies though none of identified peptide signa-
tures was approved for diagnostics in clinical practice, as
yet [15,22-26].
Breast cancer is the most common malignancy in women,
comprising about 18% of all female cancers, and 1 mil-
lion new cases occur worldwide each year. In Western
countries the disease is the single commonest cause of
death among women aged 40–50, accounting for about a
fifth of all deaths in this age group [27]. The most impor-
tant tools in screening and early detection of breast cancer
are imaging techniques: mammography, ultrasonography
and magnetic resonance imaging. Unfortunately however,
up to 20% of new breast cancer incidents cannot be
detected by these methods [28], indicating a constant
need for novel molecular markers suitable for screening
and early detection of this cancer. Several studies have
already addressed the possibility of applying SELDI or
MALDI mass spectrometric analyses of blood proteome in
diagnostics of breast cancer, and elicited serum (or

Journal of Translational Medicine 2009, 7:60 http://www.translational-medicine.com/content/7/1/60
Page 3 of 13
(page number not for citation purposes)
plasma) proteome patterns specific for patients with
breast cancer at either early or late clinical stages [29-38].
Among the peptides identified in such differentiating pat-
terns were fragments of C3a [33] and of FPA, fibrinogen,
C3f, C4a, ITIH4, apoA-IV, bradykinin, factor XIIIa and
transthyrein [35]. In addition, mass spectrometry analyses
of the blood proteome allowed the identification of pat-
terns specific for breast cancer patients with different out-
come and response to therapy [39-43]. Different
methodological approaches, both experimental and com-
putational, have been implemented in such studies, and
the proposed proteome patterns specific for breast cancer
consisted of different peptide sets. However, several pep-
tides that differentiated cancer and control samples
appeared reproducibly when comparative analysis across
different studies was performed [44], demonstrating the
high potential of mass spectrometry-based analyses of the
blood proteome pattern in diagnostics of breast cancer
once problems with standardization of experimental and
computational design are solved.
Here we examined the potential applicability of the serum
proteome pattern identified by MALDI-ToF mass spec-
trometry, either alone or in combination with protein
biomarkers analyzed by immunoassays, in early detection
of breast cancer. The spectral components that were anno-
tated on the basis of recorded mass spectra were success-
fully used to build classifiers that allowed reliable
identification of early stage breast cancer patients. Impor-
tantly, the classifier based on serum proteome pattern
outperformed available biomarkers analyzed in blood by
immunoassays.
Methods
Characteristics of patient and control groups
The clinical part of the study was carried out at the Maria
Sklodowska-Curie Memorial Cancer Center and Institute
of Oncology, Gliwice Branch, between May 2006 and Jan-
uary 2008. Ninety-two patients diagnosed with clinical
stage I or II breast cancer were included in the study, of
average age 58.5 years (range 31–74 years). Patients were
classified according to the TNM scale; the majority were
scored as T1 and T2 (47% and 45%, respectively) as well
as N0 and N1 (75% and 24%, respectively), and none had
diagnosed metastases (all M0). Biopsy material was used
to assess for histopathological tumor grade (27% G1,
45% G2, 28% G3), as well as for expression of estrogen
receptor (63% ER+) and progesterone receptor (60% PR+)
by immunohistochemistry. Serum samples were collected
before the start of therapy. One hundred and four female
volunteers were included as a control group; they were
required to be free of any known acute or chronic illness
and were not treated with any anticancer therapy in the
past. The average age in this group was 54 years (range 32–
77 years). The study was approved by the appropriate Eth-
ics Committee and all participants provided informed
consent indicating their voluntary participation.
Preparation of serum samples
Samples were collected and processed following a stand-
ardized protocol. Blood was collected in a 5 ml Vacutainer
Tube (Becton Dickinson), incubated for 30 min. at room
temperature to allow clotting, and then centrifuged at
1000 g for 10 min. to remove the clot. The serum was aliq-
uoted and stored at -70°C. Directly before analysis, sam-
ples were diluted 1:5 with 20% acetonitrile (ACN) in
water, then applied onto an Amicon Ultra-4 membrane
(50 kDa cut-off) in a spin column and centrifuged at 3000
g for 30 min. This removed the majority (up to 80%) of
albumin and other abundant high-molecular weight pro-
teins from the serum samples (not shown).
Mass spectrometry
Samples were analyzed using an Autoflex MALDI-ToF
mass spectrometer (Bruker Daltonics, Bremen, Germany);
the analyzer worked in the linear mode and positive ions
were recorded in the mass range between 2,000–10,000
Da. Mass calibration was performed after every four sam-
ples using standards in the range of 5000 to 17,500 Da
(Protein Calibration Standard I, Bruker Daltonics). Prior
to analysis each sample was loaded onto a ZipTip C18 tip-
microcolumn by passing it through repeatedly 10 times,
column was washed with water and then eluted with 1 μl
of matrix solution (30 mg/ml sinapinic acid in 50% ACN/
H2O and 0.1% TFA with addition of 1 mM n-octyl glucop-
yranoside) directly onto the 600 μm AnchorChip (Bruker
Daltonics) plate. ZipTip extraction/loading was repeated
twice for each sample and for each spot on the plate two
spectra were acquired after 120 laser shots (i.e. four spec-
tra were recorded for each sample). Spectra were exported
from the Bruker FlexAnalysis 2.2 software in standard 8-
bit binary ASCII format; they consisted of approximately
45,400 measurement points describing mass to charge
ratios (m/z) for consecutive [M+H]+ ions and the corre-
sponding signal abundances, covering the range of ana-
lyzed m/z values.
Analysis of protein tumor markers in plasma
Plasma samples were obtained after centrifugation of
blood on a Ficoll gradient (Lymphoprep™, ICN), and then
levels of selected markers were quantified using standard
methods of immuno-diagnostics. Enzyme-Linked Immu-
nosorbent Assay (ELISA) was used for assessment of leptin
(DRG Diagnostics) and osteopontin (R&D Systems),
Chemiluminescent Microparticle Immunoassay (CMIA)
for assessment of CEA (Abbott), Trace Resolved Amplified
Cryptate Emission (TRACE) for assessment of CYFRA 21.1
(Brahms), and Microparticle Enzyme Immunoassay
(MEIA) for assessment of CA15.3 (Abbott). In addition,
the level of osteopontin was analyzed in serum samples as
described above.

Journal of Translational Medicine 2009, 7:60 http://www.translational-medicine.com/content/7/1/60
Page 4 of 13
(page number not for citation purposes)
Data Processing and Statistical Analysis
The preprocessing of data that included averaging of tech-
nical repeats, interpolation of missing or non-aligned
points, binning of neighboring points to reduce data com-
plexity, removal of the spectral area below baseline and
the total ion current (TIC) normalization was performed
according to procedures considering to be standard in the
field [45,46]. In the second step the spectral components,
which reflected [M+H]+ ions recorded at defined m/z val-
ues, were identified using decomposition of mass spectra
into their Gaussian components. The spectra were mod-
eled as a sum of Gaussian bell-shaped curves, then models
were fitted to the experimental data by a variant of the
expectation maximization (EM) algorithm [47]. In a few
cases when the standard deviation of a Gaussian exceeded
a value of 50 the corresponding spectral component was
excluded from further more detailed analyses. Based on
the decomposition of the average mass spectrum into the
Gaussian components, the classifier features were com-
puted by the scalar product with the Gaussian curves
treated as kernel functions. The classification used version
of the Support Vector Machine (SVM) algorithm
described by Schölkopf and coworkers [48]. The size of
the training sample was changed from 20% to 90% of the
whole dataset, and for each size the two-step training/val-
idation procedure was repeated 1000 times to estimate
the average error rate and its 95% confidence interval,
which characterized the accuracy of classification. In order
to further characterize the quality of classification, receiver
operating curves (ROC) were computed by changing the
value of the classification threshold in the SVM classifiers,
and averaging the obtained specificity/sensitivity propor-
tions over 1000 random validation experiments. We
tested the performance of classification with classifiers
built of different numbers of spectral components by esti-
mating the level of total errors, as well the number of false
positive and false negative classifications. Construction
and validation of a classifier is a statistical process, i.e.
many different classifiers built of a given number of spec-
tral components were tested (1000 random splits of the
dataset), and those which pass the quality threshold could
be built of different spectral components. Thus, to identify
the components that are the best determinants of a spe-
cific proteome pattern we looked for the most frequent
components in classifiers that correctly classified samples.
The performance of classifiers built of optimized compo-
nents was assessed by standard logistic regression (1000
iterations with a 50/50 split of the training/validation
set).
Results and discussion
Classifiers built on spectral components that determine
proteome patterns
The low-molecular-weight fraction of the blood serum
proteome consists of numerous peptides, proteins and
their fragments. Some of these interact with each other,
and a substantial fraction of this blood proteome com-
partment is carried by albumin as cargo peptides [49,50].
For this reason we implemented dilution of serum sam-
ples with a denaturing organic solvent (acetonitrile) that
destroyed the majority of protein interactions and
allowed analysis of individual peptides dissociated from
(not interacting with) other proteins (e.g., albumin).
Characteristic features of MALDI ionization are that most
ions created during laser irradiation are singly charged
(multiply charged ions, especially those with low m/z val-
ues, have very low abundances and can be are neglected),
and that these ions are not fragmented under the ioniza-
tion conditions applied. In other words, peaks registered
in a MALDI mass spectrum correspond to mono-proto-
nated peptide/protein molecular ions [M+H]+ described
by m/z values that reflect actual molecular weights
increased by the mass of the proton. However, when
MALDI mass spectra are recorded over a wide range of m/
z values (like the 2–10 kDa range in this study) the
expected mass accuracy is relatively low and reaches 0.01–
0.1% of the analyte's molecular mass, which corresponds
to a few Daltons in the range of m/z values analyzed. In
consequence, the relative broadening of spectral peaks
recorded for the [M+H]+ ions could reflect the low resolu-
tion of the analyzer operating in the linear mode or might
result in overlapping of ions originating from protein/
peptides of very similar molecular masses. In addition,
because of technological imperfections there might be
some shift in the positions of peptide ions between meas-
urements, which adds more complexity to analyses of
large datasets. For this reason, some approaches used for
analysis of large datasets relay on alignment of identified
spectral peaks [45], which requires numerical "stretching"
of spectra before further analyses.
Here we decided to implement an original mathematical
procedure based on modeling average spectra and then
fitting actual experimental spectra into such a model.
Averaging was performed over either the whole dataset or
data for cancer patients only, depending on whether the
model was used to discriminate cancer and normal sam-
ples or different clinical outcomes of patients. We tested
models with different numbers of components, and
found that for the mass spectra analyzed in the present
work 300 components ensured both sufficient fidelity of
the model and its efficient computation (not shown). As
a result of computation an "average" spectrum was
decomposed into spectral components characterized by
the exact molecular weight (m/z values of recorded
[M+H]+ ions) and the interval where fit corresponding
peaks in at least 95% of actual spectra expected in the
dataset (+/-95% CI). The resulting spectral components
reflect peaks recorded in multiple samples during mass
spectrometric analysis, which contained either single pep-
tide/protein ions or a combination of a few ions of very
similar m/z values. This approach allowed us to avoid arti-
Journal of Translational Medicine 2009, 7:60 http://www.translational-medicine.com/content/7/1/60
Page 5 of 13
(page number not for citation purposes)
facts resulting from the peak alignment and facilitated
quantitative analysis of data by simple assessment of sig-
nal volumes that fitted to a given component within its
95% CI. Having identified and quantified spectral compo-
nents, one could find certain whose abundances were sig-
nificantly different between groups of samples (e.g.
between cancer patient and healthy samples) which could
be defined as "differentiating". However, to obtain more
reliable classification of samples we used spectral compo-
nents to build multi-component classifiers that deter-
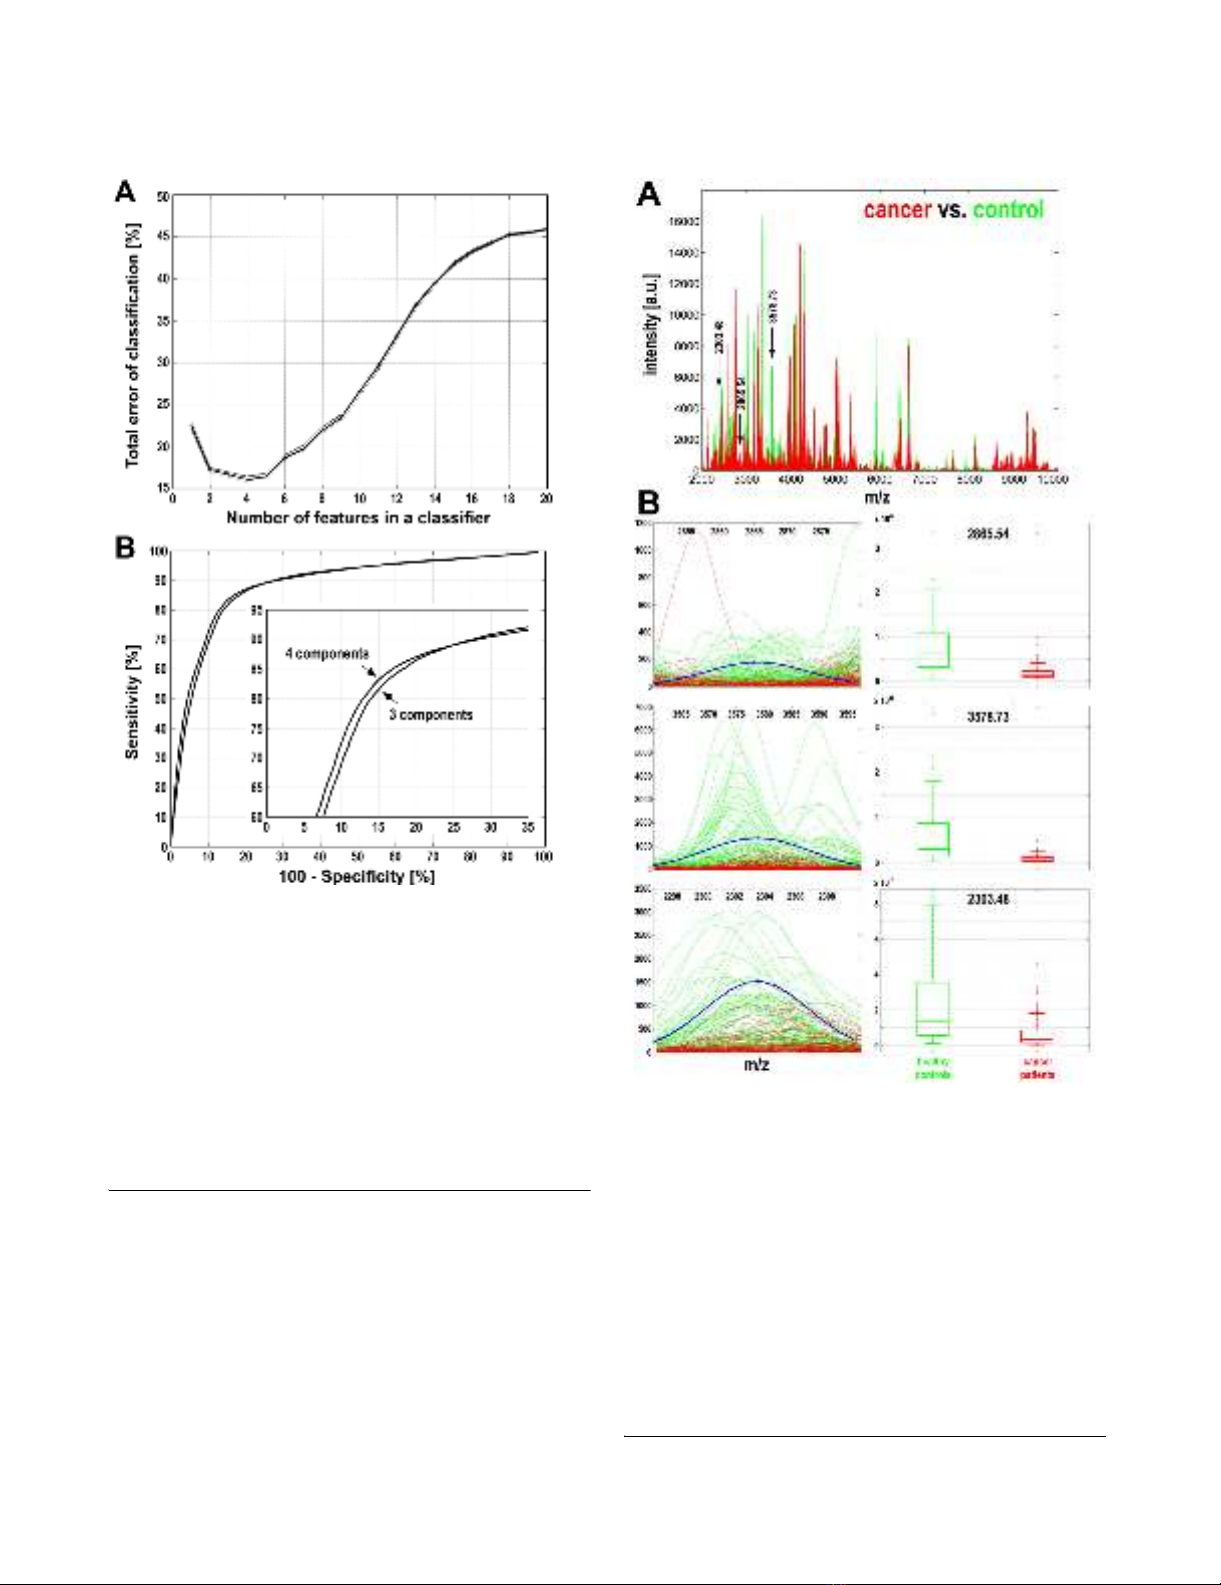
Characterization of spectral components essential for cancer classificationFigure 2
Characterization of spectral components essential
for cancer classification. A – The three most frequent dif-
ferentiating components are marked with arrows along the
mass spectra of serum samples of cancer patients (red lines)
and healthy controls (green lines). B – Actual spectral plots
of three selected components for cancer patients (red lines)
and healthy controls (green lines), as well as modeled Gaus-
sian kernels (blue curves); X-axes represent the m/z values,
Y-axes represent intensities. Box-plots on the right repre-
sent quantification of the abundance of spectral components
in samples from cancer patients (red) and healthy controls
(green) (shown are minimum, lower quartile, median, upper
quartile and maximum values; outliers are marked by aster-
isks).
Estimation of the performance of classification of breast can-cer samplesFigure 1
Estimation of the performance of classification of
breast cancer samples. A – The total error rate was plot-
ted against the number of features (i.e. spectral components)
in the classifier. Shown are average error rates and 95% con-
fidence intervals calculated based on 1000 random validation
experiments with 50:50 training/validation split of data. B –
Estimation of the sensitivity and specificity of the classifica-
tion for classifiers built of three or four spectral components.
The ROC curve was computed by changing the value of the
probability threshold in the SVM classifier from 0.0 to 1.0,
and averaging the specificity obtained versus sensitivity rate
over 1000 random repeats of training and validation.


![PET/CT trong ung thư phổi: Báo cáo [Năm]](https://cdn.tailieu.vn/images/document/thumbnail/2024/20240705/sanhobien01/135x160/8121720150427.jpg)


%20--%3e%3cdefs%3e%3cstyle%3e%20.st0%20{%20fill:%20%23fff;%20}%20.st1%20{%20fill:%20%237800fa;%20}%20%3c/style%3e%3c/defs%3e%3cpath%20class='st1'%20d='M117.78,12.18H43.11c2.9,3.47,4.65,7.94,4.65,12.82,0,5.6-2.3,10.66-6.01,14.29h76.02l7.22-13.56-7.22-13.56Z'/%3e%3cg%3e%3cpath%20class='st0'%20d='M53.58,26.17h-.59v-1.46h.59v-4.96h2.83c1.78,0,2.67.94,2.67,2.82v5.76c0,1.87-.89,2.81-2.67,2.81h-2.83v-4.96ZM55.36,21.37v3.34h1.1v1.46h-1.1v3.34h1.01c.61,0,.91-.37.91-1.1v-5.93c0-.74-.3-1.1-.91-1.1h-1.01Z'/%3e%3cpath%20class='st0'%20d='M65.99,31.14h-1.8l-.31-2.07h-2.19l-.31,2.07h-1.64l1.82-11.39h2.62l1.82,11.39ZM65.28,18.04c-.25.46-.51.77-.75.94-.21.15-.47.22-.79.22-.26,0-.57-.07-.92-.22l-.38-.15c-.14-.05-.26-.07-.37-.07-.3,0-.53.18-.71.54l-.91-.68c.25-.46.51-.77.75-.94.21-.14.48-.21.79-.21.26,0,.57.07.92.21l.38.15c.14.05.26.07.37.07.3,0,.53-.18.71-.54l.91.68ZM61.91,27.52h1.73l-.87-5.76-.87,5.76Z'/%3e%3cpath%20class='st0'%20d='M74.53,26.89v1.52c0,1.91-.89,2.86-2.67,2.86s-2.67-.95-2.67-2.86v-5.93c0-1.91.89-2.86,2.67-2.86s2.67.95,2.67,2.86v1.11h-1.69v-1.22c0-.75-.31-1.12-.93-1.12s-.93.37-.93,1.12v6.15c0,.74.31,1.11.93,1.11s.93-.37.93-1.11v-1.63h1.69Z'/%3e%3cpath%20class='st0'%20d='M81.4,31.14h-1.8l-.31-2.07h-2.19l-.31,2.07h-1.64l1.82-11.39h2.62l1.82,11.39ZM75.9,19.2l1.52-1.91h1.71l1.51,1.91h-1.61l-.76-.95-.75.95h-1.61ZM77.32,27.52h1.73l-.87-5.76-.87,5.76ZM83.1,15.99l-1.76,1.91h-1.26l1.17-1.91h1.86Z'/%3e%3cpath%20class='st0'%20d='M84.86,19.75c1.78,0,2.67.94,2.67,2.82v1.48c0,1.87-.89,2.81-2.67,2.81h-.85v4.28h-1.79v-11.39h2.64ZM84.01,21.37v3.86h.85c.58,0,.87-.36.87-1.08v-1.71c0-.71-.29-1.07-.87-1.07h-.85Z'/%3e%3cpath%20class='st0'%20d='M93.51,19.75c1.78,0,2.67.94,2.67,2.82v1.48c0,1.87-.89,2.81-2.67,2.81h-.85v4.28h-1.79v-11.39h2.64ZM92.66,21.37v3.86h.85c.58,0,.87-.36.87-1.08v-1.71c0-.71-.29-1.07-.87-1.07h-.85Z'/%3e%3cpath%20class='st0'%20d='M98.8,31.14h-1.79v-11.39h1.79v4.88h2.03v-4.88h1.83v11.39h-1.83v-4.88h-2.03v4.88Z'/%3e%3cpath%20class='st0'%20d='M105.36,24.55h2.46v1.62h-2.46v3.34h3.09v1.63h-4.88v-11.39h4.88v1.63h-3.09v3.18ZM108.17,17.29l-1.76,1.91h-1.26l1.17-1.91h1.86Z'/%3e%3cpath%20class='st0'%20d='M112.2,19.75c1.78,0,2.67.94,2.67,2.82v1.48c0,1.87-.89,2.81-2.67,2.81h-.85v4.28h-1.79v-11.39h2.64ZM111.35,21.37v3.86h.85c.58,0,.87-.36.87-1.08v-1.71c0-.71-.29-1.07-.87-1.07h-.85Z'/%3e%3c/g%3e%3ccircle%20class='st1'%20cx='25'%20cy='25'%20r='20'/%3e%3cpath%20class='st0'%20d='M32.78,19.27c2.92,0,4.43,2.55,5.28,5.33l.71,2.17c.14.38-.33.75-.71.75h-5.61c.19-.33.24-.71.09-1.08l-.75-2.45c-.43-1.32-.99-2.64-1.79-3.77.75-.57,1.65-.94,2.78-.94h0ZM25,18.38c3.25,0,4.9,2.78,5.89,5.89l.76,2.45c.14.42-.33.8-.8.8h-11.69c-.42,0-.94-.38-.8-.8l.75-2.45c.99-3.11,2.64-5.89,5.89-5.89h0ZM25,11.35c1.74,0,3.11,1.37,3.11,3.11s-1.37,3.11-3.11,3.11-3.11-1.41-3.11-3.11,1.41-3.11,3.11-3.11h0ZM17.27,19.27c1.08,0,1.98.38,2.73.94-.8,1.13-1.37,2.45-1.74,3.77l-.8,2.45c-.14.38-.05.75.09,1.08h-5.56c-.42,0-.9-.38-.75-.75l.71-2.17c.9-2.78,2.41-5.33,5.33-5.33h0ZM17.27,12.91c1.51,0,2.78,1.27,2.78,2.83s-1.27,2.83-2.78,2.83-2.83-1.27-2.83-2.83,1.27-2.83,2.83-2.83h0ZM32.78,12.91c1.56,0,2.78,1.27,2.78,2.83s-1.23,2.83-2.78,2.83-2.83-1.27-2.83-2.83,1.27-2.83,2.83-2.83h0ZM27.07,28.56v.09c0,.57-.24,1.08-.61,1.46h0v.05c-.38.33-.9.57-1.46.57s-1.08-.24-1.46-.61h0c-.38-.38-.61-.9-.61-1.46v-.09h1.41v.09c0,.19.05.38.19.47v.05c.09.09.28.19.47.19s.38-.09.47-.19v-.05c.14-.09.24-.28.24-.47t-.05-.09h1.41ZM30.99,28.56v.09c0,1.65-.66,3.16-1.74,4.24-1.08,1.08-2.59,1.79-4.24,1.79s-3.16-.71-4.24-1.79l-.05-.05c-1.04-1.08-1.7-2.55-1.7-4.2v-.09h1.41v.09c0,1.27.47,2.4,1.27,3.25h.05c.85.85,1.98,1.37,3.25,1.37s2.4-.52,3.25-1.37c.85-.8,1.37-1.98,1.37-3.25v-.09h1.37ZM34.99,28.56v.09c0,2.78-1.13,5.28-2.92,7.07-1.79,1.79-4.29,2.92-7.07,2.92s-5.23-1.13-7.07-2.92c-1.79-1.79-2.92-4.29-2.92-7.07v-.09h1.41v.09c0,2.4.94,4.53,2.5,6.08,1.56,1.56,3.72,2.5,6.08,2.5s4.52-.94,6.08-2.5c1.56-1.56,2.5-3.68,2.5-6.08v-.09h1.41Z'/%3e%3c/svg%3e)