
Hindawi Publishing Corporation
EURASIP Journal on Bioinformatics and Systems Biology
Volume 2011, Article ID 797250, 11 pages
doi:10.1155/2011/797250
Research Article
Modeling Signal Transduction Leading to Synaptic Plasticity:
Evaluation and Comparison of Five Models
Tiina Manninen, Katri Hituri, Eeva Toivari, and Marja-Leena Linne
Department of Signal Processing, Tampere University of Technology, P.O. Box 553, 33101 Tampere, Finland
Correspondence should be addressed to Tiina Manninen, tiina.manninen@tut.fi
Received 1 November 2010; Revised 21 January 2011; Accepted 27 January 2011
Academic Editor: Carsten Wiuf
Copyright © 2011 Tiina Manninen et al. This is an open access article distributed under the Creative Commons Attribution
License, which permits unrestricted use, distribution, and reproduction in any medium, provided the original work is properly
cited.
An essential phenomenon of the functional brain is synaptic plasticity which is associated with changes in the strength of synapses
between neurons. These changes are affected by both extracellular and intracellular mechanisms. For example, intracellular
phosphorylation-dephosphorylation cycles have been shown to possess a special role in synaptic plasticity. We, here, provide
the first computational comparison of models for synaptic plasticity by evaluating five models describing postsynaptic signal
transduction networks. Our simulation results show that some of the models change their behavior completely due to varying total
concentrations of protein kinase and phosphatase. Furthermore, the responses of the models vary when models are compared to
each other. Based on our study, we conclude that there is a need for a general setup to objectively compare the models and an
urgent demand for the minimum criteria that a computational model for synaptic plasticity needs to meet.
1. Introduction
Neurons respond to variations in extracellular and intracel-
lular environment by modifying their synaptic and intrinsic
membrane properties. When a presynaptic neuron passes
an electrical or chemical signal to a postsynaptic neuron,
changes in the synapse occur. Long-term potentiation (LTP),
also known as strengthening, and long-term depression
(LTD), also known as weakening, of synapses are two forms
of synaptic plasticity. Both LTP and LTD participate in
storing information and inducing processes that are thought
to ultimately lead to learning (see, e.g., [1]). The main
focus in the research on synaptic plasticity in vertebrates has
been on LTP and LTD in cornu ammonis 1 (CA1) region
of the hippocampus [1] because hippocampus is especially
important in the formation and retrieval of declarative mem-
ories. Several mechanisms have been shown to be the reason
for changes in synaptic strength; for example, changes in
neurotransmitter release, conductivityof receptors, numbers
of receptors, numbers of active synapses, and structure of
synapses [2].
At present, there are more than a hundred molecules
f ou nd i mp or t an t i n LTP / LT D, s o me o f w hi ch a re k e y
components for LTP/LTD formation and others being able
to modulate the ability to generate LTP/LTD [1]. Strong evi-
dence supports the finding that calcium (Ca2+)/calmodulin
(CaM)-dependent protein kinase II (CaMKII) meets the cri-
teria for being the essential molecule to LTP [3]. Protein
kinases add phosphates to proteins, and, on the other hand,
protein phosphatases remove phosphates from proteins to
activate or deactivate them. It is hence straightforward to
consider that also the protein phosphatases, such as protein
phosphatases 1, 2A, and 2B (PP1, PP2A, and PP2B, a.k.a. cal-
cineurin (CaN)), have important roles in synaptic plasticity
[4].
More than a hundred computational models, simple and
more complex ones, have been developed to describe the
mechanisms behind synaptic plasticity at the biochemical
level (see, e.g., [5,6]). Simplest models only have one
reversible reaction (see, e.g., [7]) and most complicated
ones several hundred reactions (see, e.g., [2]). The com-
munities of researchers in computational systems biology
and neuroscience are in a need for a general setup on how
to evaluate and classify the models for synaptic plasticity
(see also [5]). Because the statistical data from the mod-
els does not necessarily represent exactly the same phe-
nomenon, mathematical methods, such as Bayesian methods
[8–10], are not applicable to comparison of these synaptic
2 EURASIP Journal on Bioinformatics and Systems Biology
PP2B
CaN
PDE4
PDE1B
PKA
CaMKII
PP2A
AMPAR
I1
Ca2+
PP1
CaM CaM
CaM
CaM
Gα
cAMP
cAMP cAMP
cAMP
Cdk5
D32
AC
DA
D1R
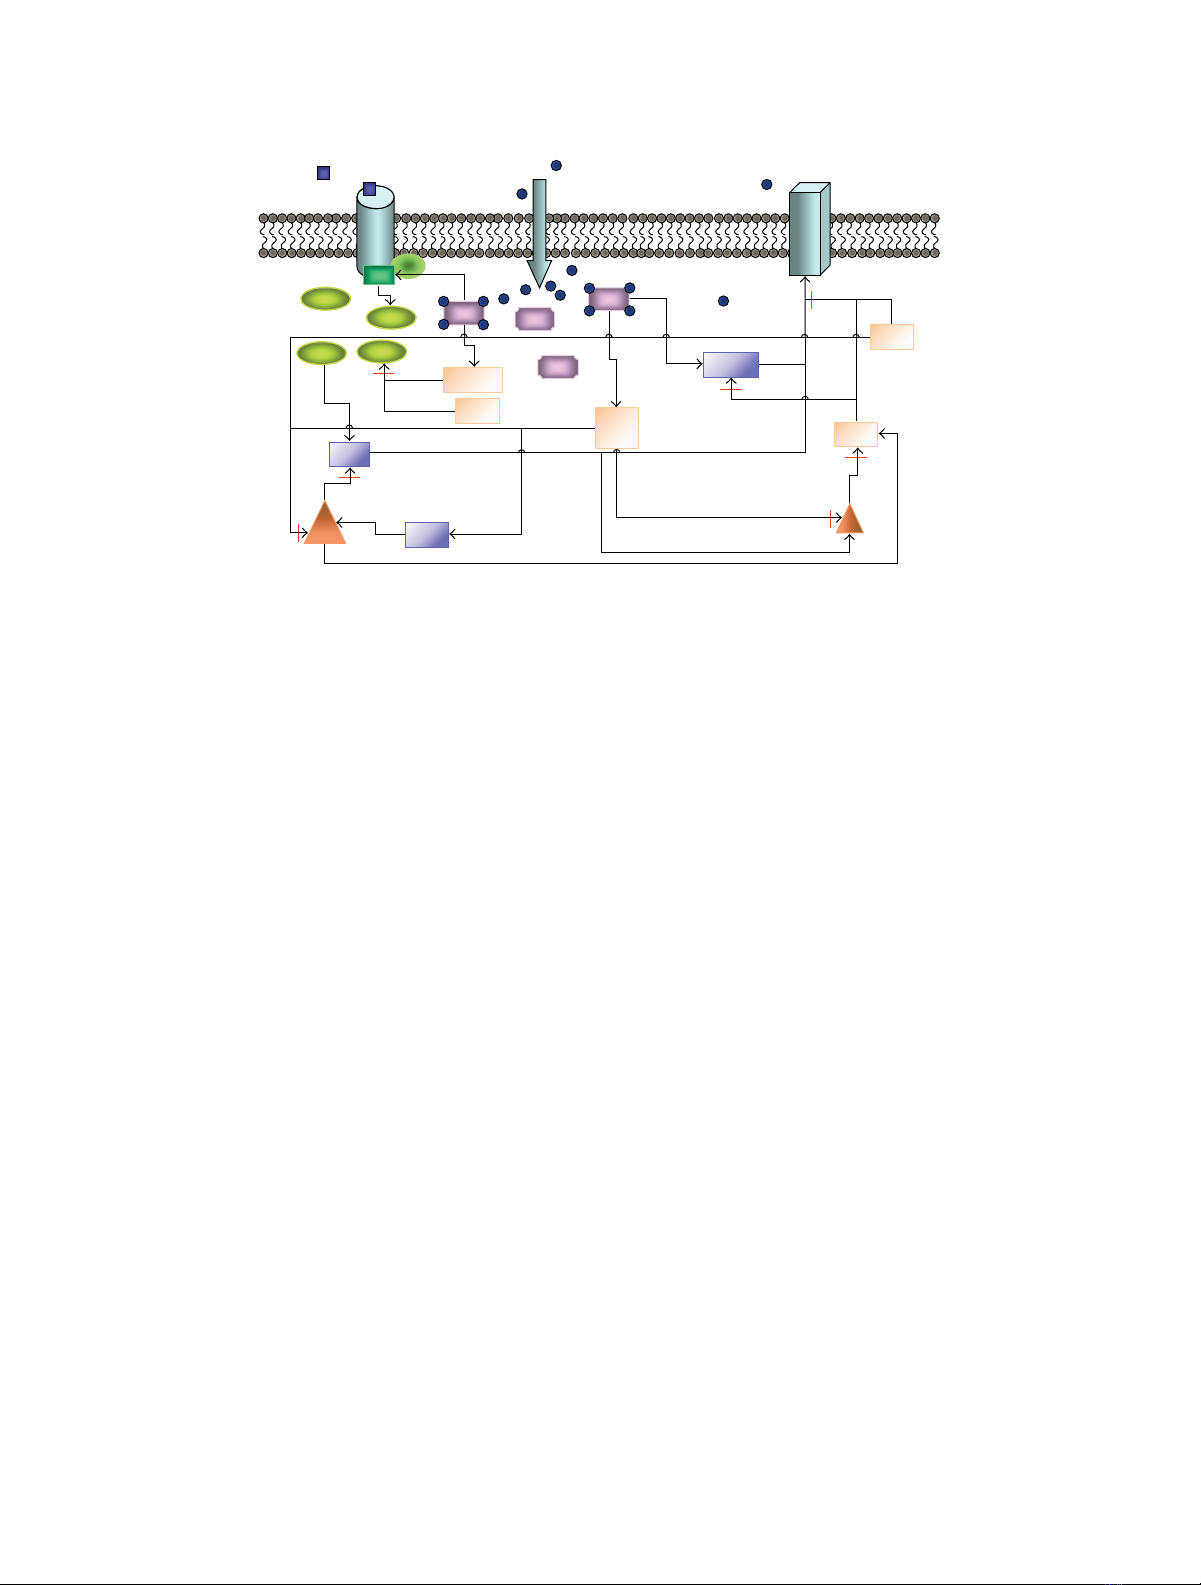
Figure 1: Schematic representation of the postsynaptic mechanisms involved in signal transduction related to induction of LTP/LTD. Intracellular
calcium ions (Ca2+) bind to calmodulin (CaM), which further affects the activation of protein phosphatase 2B (PP2B) a.k.a. calcineurin
(CaN), CaM-dependent kinase II (CaMKII), adenylyl cyclase (AC, the catalyst of the reaction producing cyclic adenosine monophosphate
(cAMP)), and phosphodiesterase type 1B (PDE1B). Dopamine (DA) increases cAMP concentration via AC activation. Together with PDE1B,
also PDE type 4 (PDE4) degrades cAMP. cAMP-dependent protein kinase (PKA) phosphorylates α-amino-3-hydroxy-5-methylisoxazole-4-
propionic acid receptor (AMPAR) and protein phosphatase 1 (PP1) inhibitor 1 (I1). In addition, protein phosphatase 2A (PP2A) and
cyclin-dependent kinase 5 (Cdk5) affect PP1 regulatory subunit a.k.a. DA- and cAMP-regulated neuronal phosphoprotein of 32 kDa (D32).
plasticity models. Thus, some subjective selection of features
describing the overall behavior of the modeled system and
traditional simulation-based comparison are required. To
enable the use of previous computational models for synaptic
plasticity, minimum criteria for the models need to be set
(see BioModels projects, e.g., [11,12]).
The aim of this study is to provide the first comparison
of synaptic plasticity models by computational means and
to be the first step towards finding a general setup for com-
parison. The organization of this study is as follows. First,
we shortly describe the biology behind synaptic plasticity
by presenting five computational models selected for this
evaluation. Second, the used simulation setups, including
the second messenger Ca2+ and neurotransmitter dopamine
(DA) inputs, as well as the total concentrations of protein
kinase CaMKII and protein phosphatase PP1, are presented.
Third, we show the comparative simulation results and
evaluate the synaptic plasticity models. The comparison is
made between the two models selected for the same neuron
type, that is, between the two models for a hippocampal CA1
neuron and between the two models for a striatal medium
spiny neuron. We also examine if a generic model is suitable
for describing the behavior of either of the two neuron types
and thus being a good computational representative of them.
Lastly, we discuss our most important findings and provide
some conclusions.
2. Models and Methods
2.1. Biological Background. S e ve r al t y p e s o f LT P an d LTD
can occur in the brain depending on the neuron type and
given input to the neuron. LTP can be divided into two
main types: an early phase LTP (E-LTP), which lasts for
1 h-2 h, and a late phase LTP (L-LTP), which persists for
several hours [1,3]. Similar division can also be made for
LTD. All types of plasticity involve three processes: induction,
expression, and maintenance. The LTP/LTD phenomenon
can be induced by introducing glutamatergic and dopamin-
ergic inputs. Glutamatergic input causes the elevation of
intracellular Ca2+ concentration in postsynaptic density,
meaning a small volume linking postsynaptic membrane
receptors, their signaling pathways, and the cytoskeleton,
and in cytosol. Dopaminergic input activates the enzyme
adenylyl cyclase (AC) on the cell membrane and thus
increases the intracellular cyclic adenosine monophosphate
(cAMP) concentration. This input can only be found in some
neuron types, for example, in striatal medium spiny neurons.
Ca2+ and cAMP serve as secondary messengers passing
the glutamatergic and dopaminergic signals forward and
activating downstream proteins. In this study, the elevations
in Ca2+ and DA concentrations are used as model inputs (see
details in Section 2.3).
Briefly, the signal transduction network leading to
LTP/LTD phenomenon includes the following events (see
Figure 1). Elevated Ca2+ concentration enables the binding
of Ca2+ to CaM which further activates CaM-dependent
kinase CaMKII. Then Ca2+/CaM-CaMKII complex is able
to proceed to autophosphorylation. Ca2+/CaM also binds
to protein phosphatase CaN. The effect of active CaN
on protein phosphatase PP1 activity is bidirectional; CaN
inhibits PP1 inhibitor 1 (I1) and activates cyclic-dependent
kinase 5 (Cdk5). Both of these actions lead to activation

EURASIP Journal on Bioinformatics and Systems Biology 3
Table 1: Characteristics of models. Tabulated characteristics are the simulation environment and integration method, phases of long-term
potentiation and long-term depression, model inputs, model outputs chosen for this study, and size of the model based on the number
of different chemical species or other model variables. Used abbreviations are α-amino-3-hydroxy-5-methylisoxazole-4-propionic acid
receptor (AMPAR), calcium ion (Ca2+), Ca2+/calmodulin-dependent protein kinase II (CaMKII), cyclic adenosine monophosphate (cAMP),
dopamine (DA), DA- and cAMP-regulated neuronal phosphoprotein of 32 kDa (DARPP32), early phase LTP (E-LTP), induction (Ind.), Ca2+
influx via NMDARs (JNMDAR), late phase LTP (L-LTP), long-term depression (LTD), long-term potentiation (LTP), N-methyl-D-aspartate
receptor (NMDAR), and cAMP-dependent protein kinase (PKA).
Model Simulation environment Phases Inputs Outputs Size
d’Alcantara et al. [16] MATLAB, ode23 (explicit Runge-Kutta) Ind. LTP/LTD Ca2+ AMPAR 14
Kim et al. [17] XPPAUT, adaptive stiffintegration method Ind. L-LTP Ca2+, DA CaMKII/PKA 49
Lindskog et al. [18] XPPAUT, adaptive stiffintegration method Ind. E-LTP Ca2+, DA DARPP32 89
Nakano et al. [19] GENESIS/Kinetikit, exponential Euler Ind. LTP/LTD Ca2+, DA AMPAR 111
Hayer and Bhalla [2] MATLAB, ode23s (based on Rosenbrock) LTP/LTD Ca2+,cAMP,JNMDAR AMPAR 258
of PP1. However, active CaN is also able to deactivate PP1
regulatory subunit a.k.a. DA- and cAMP-regulated neuronal
phosphoprotein of 32 kDa (DARPP32, D32 in Figure 1),
which leads to deactivation of PP1. Active PP1 has a major
role in dephosphorylating CaMKII and α-amino-3-hydroxy-
5-methylisoxazole-4-propionic acid receptor (AMPAR). On
the other hand, due to the DA input, cAMP activates cAMP-
dependent protein kinase (PKA) which phosphorylates
AMPAR (see synaptic plasticity mechanisms, e.g., in [1,4]).
In the ultimate end of the signaling cascade described in
this study, protein kinases CaMKII and PKA, together with
protein phosphatases PP1 and PP2A, act on AMPAR.
The phosphorylation and dephosphorylation of AMPAR
subunits are crucial for the trafficking of AMPARs. Regulated
AMPAR trafficking between intracellular, synaptic, and
nonsynaptic membranes at the postsynaptic hippocampal
neuron is found to provide a protein-level basis for control-
ling the amount of AMPARs on the plasma membrane and
hence postsynaptic responsiveness [13,14]. It is suggested
that in the basal conditions, AMPARs are concentrated on
the postsynaptic membrane but also exist abundantly in
endosomal compartments, meaning the membranes inside
the cell [15]. Some of the AMPAR subunits undergo
constant recycling with membrane receptors in an activity-
independent manner. However, the amount of AMPARs in
the postsynaptic membrane shows only modest variation.
Following the N-methyl-D-aspartate receptor (NMDAR)
stimulation and CaMKII activation, exocytosis of AMPAR
subunitsfromendosomalcompartmentstocellmembrane
is triggered, leading finally to the insertion of AMPARs into
synapses [13]. On the contrary, in synaptic depression endo-
cytotic mechanisms are activated and subunits of AMPARs
are stored in endosomal compartments or degraded [13].
2.2. Selection of Models. We set our criteria for model
selection to be the following: (1) the model for synaptic
plasticity has to include adequate postsynaptic reactions and
kinetics, (2) the model can be found in a database, (3) the
model describes synaptic plasticity either in a hippocampal
CA1 neuron or in a striatal medium spiny neuron, (4) the
model uses Ca2+ as input, and (5) CaMKII and PP1 are
included in the model.
We select the following models describing synaptic
plasticity in a hippocampal CA1 neuron:
(i) model by d’Alcantara et al. [16],
(ii) model by Kim et al. [17].
In addition, we select the following models describing
synaptic plasticity in a striatal medium spiny neuron:
(i) model by Lindskog et al. [18],
(ii) model by Nakano et al. [19].
Furthermore, we select one generic neuron model which
is compared to models above:
(i) model by Hayer and Bhalla [2].
The characteristics and components of the selected
models are tabulated in Tables 1and 2(see also [5]). In
total, several protein kinases (CaMKII, Cdk5, and PKA) and
protein phosphatases (CaN, PP1, and PP2A) are included
in the models. The models have similar elements and are in
some cases directly based on each other. Kim et al. [17]take
the model by Lindskog et al. [18] as their base. This might be
confusing since the models are made for neurons in different
brain areas, but, on the other hand, they share similar
pathways. Furthermore, the model by Kim et al. [17]takes
into account the G protein-linked PKA activation. Within
the models describing synaptic plasticity in a striatal medium
spiny neuron, Nakano et al. [19] take some of the reactions
from the earlier model by Lindskog et al. [18]andthenuse
similar AMPAR trafficking model as the generic model by
Hayer and Bhalla [2]. These selected models are also partly
based on other published models, but we list here just how
these selected models are based on each other. It should
be noted that the models selected for this study as such
can be considered as advanced models in the computational
neuroscience community.
2.3. Simulation Setup. For all the models, the total simula-
tion time is 2000 s and a four-train Ca2+ input is given at
t=500 s in which the basal concentration of Ca2+ is 0.1 µM
and the pulse peak is 10 µM(seeFigure 2(a)). A four-train

4 EURASIP Journal on Bioinformatics and Systems Biology
Table 2: Model components. Tabulated characteristics are the compartments, receptors, Ca2+ mechanisms, and signaling pathways modeled.
Used abbreviations are adenylyl cyclase (AC), α-amino-3-hydroxy-5-methylisoxazole-4-propionic acid receptor (AMPAR), calmodulin
(CaM), calcium/CaM-dependent protein kinase II (CaMKII), calcineurin (CaN), cyclin-dependent kinase 5 (Cdk5), dopamine receptor
(D1R), dopamine- and cyclic adenosine monophosphate-regulated neuronal phosphoprotein of 32 kDa (DARPP32), inhibitor 1 (I1),
phosphodiesterase type 1 (PDE1), PDE type 1B (PDE1B), PDE type 2 (PDE2), PDE type 4 (PDE4), cyclic adenosine monophosphate-
dependent protein kinase (PKA), protein phosphatase 1 (PP1), and protein phosphatase 2A (PP2A).
Model Compartments Receptors Ca2+ mechanisms Signaling pathways
d’Alcantara et al. [16] 1 postsynaptic AMPAR CaM buffer CaM, CaMKII, CaN, I1,
PP1
Kim et al. [17]1spineD
1RCaMbuffer
CaM, CaMKII, CaN, G
protein,I1,PDE1B,PDE4,
PKA, PP1
Lindskog et al. [18]1spine D
1RCaMbuffer
AC, CaM, CaMKII, CaN,
DARPP32, PDE1, PDE4,
PKA, PP1, PP2A
Nakano et al. [19]1spineAMPAR,D
1RCaMbuffer
AC, CaM, CaMKII, CaN,
Cdk5, DARPP32, I1, PDE1,
PDE2, PKA, PP1, PP2A
Hayer and Bhalla [2]
1 dendritic,
1 postsynaptic,
1spine-head
AMPAR
CaM buffer, 1-D
diffusion of some
of the molecules
AC, CaM, CaMKII, CaN,
PKA, PP1
Table 3: Total concentrations of CaMKII and PP1 ([CaMKII]tot,
[PP1]tot) and ratios of them used in different simulations.
Sim ID [CaMKII]tot (µM) [PP1]tot (µM) Ratio
Sim1 0.5 2 0.25
Sim2 1 4 0.25
Sim3 2 4 0.5
Sim4 4 1 4
Sim5 20 5 4
Sim6 20 2 10
DA input (see Figure 2(b)), in addition to Ca2+ input, is
given in the models that also model DA-related pathways, in
other words to the models by Kim et al. [17], Lindskog et
al. [18], and Nakano et al. [19]. Hayer and Bhalla [2]alsouse
other inputs in addition to Ca2+ (see Tab le 1 ), and these other
inputs are used similarly as presented in the original model.
Six simulations (Sim1–Sim6) with different total concen-
trations of CaMKII and PP1 are run for all the models with
the same inputs (see Ta ble 3). These total concentrations are
selected based on the different values used in the original
models. Otherwise, we use the parameter values and mostly
the initial concentrations given in the original models. In
Tab l e 4 , we list the actual values that have to be changed to
reach the simulation conditions given in Tab l e 3 .
It is assumed that the original models have been tested
against changes in the values of parameters and initial
concentrations, and thus no detailed sensitivity analysis is
performed in this study. It is beyond the scope of this study.
We want to emphasize that the purpose of this study
is not to perform any detailed analysis of the used inte-
gration methods nor to implement the models using other
integration methods. Instead, we use the model as it is
presented in the model database and simulate it using the
given simulation tool.
3. Results
3.1. Simulation Results. We evaluate and compare different
computational models describing LTP and LTD phenomena
based on the model outcomes. The comparison is made
between the two models selected for the same neuron type;
that is, two models are compared for a hippocampal CA1
neuron [16,17] and two models for a striatal medium spiny
neuron [18,19]. In addition, we examine if a generic model
[2] is a suitable approximation for hippocampal and striatal
neurons in terms of reproducing the main LTP phenomenon.
The model selection is justified upon the importance of
AMPAR phosphorylation and dephosphorylation during
synaptic plasticity. All the model outputs can be related to
the phosphorylation and dephosphorylation of AMPARs.
However, as the outputs of the models differ from each
other, we also follow up the concentrations of active CaMKII
and PP1, pivotal phosphorylating and dephosphorylating
enzymes, respectively, in all the models. To compare the
selected deterministic models [2,16–19], we run simulations
with several setups. Details of the simulation setups are given
in Section 2.3.
3.1.1. Models Describing Synaptic Plasticity in a Hippocampal
CA1 Neuron. The concentrations of active CaMKII (see
Figures 3(a) and 3(d)) in simulations of the hippocampal
CA1 neuron models by d’Alcantara et al. [16]andKim
et al. [17] depend completely on the total concentration
of CaMKII; the higher the total concentration of CaMKII,
the higher the concentration of active CaMKII. In the
case of the same total concentration of CaMKII (20 µM
in Sim5 and Sim6), the lower total concentration of PP1
EURASIP Journal on Bioinformatics and Systems Biology 5
0 495 500 505 510 515
0
3
6
9
12
Ca2+ (µM)
Time (s)
2000
(a)
0 495 500 2000505 510 515
0
2
4
Time (s)
DA (µM)
(b)
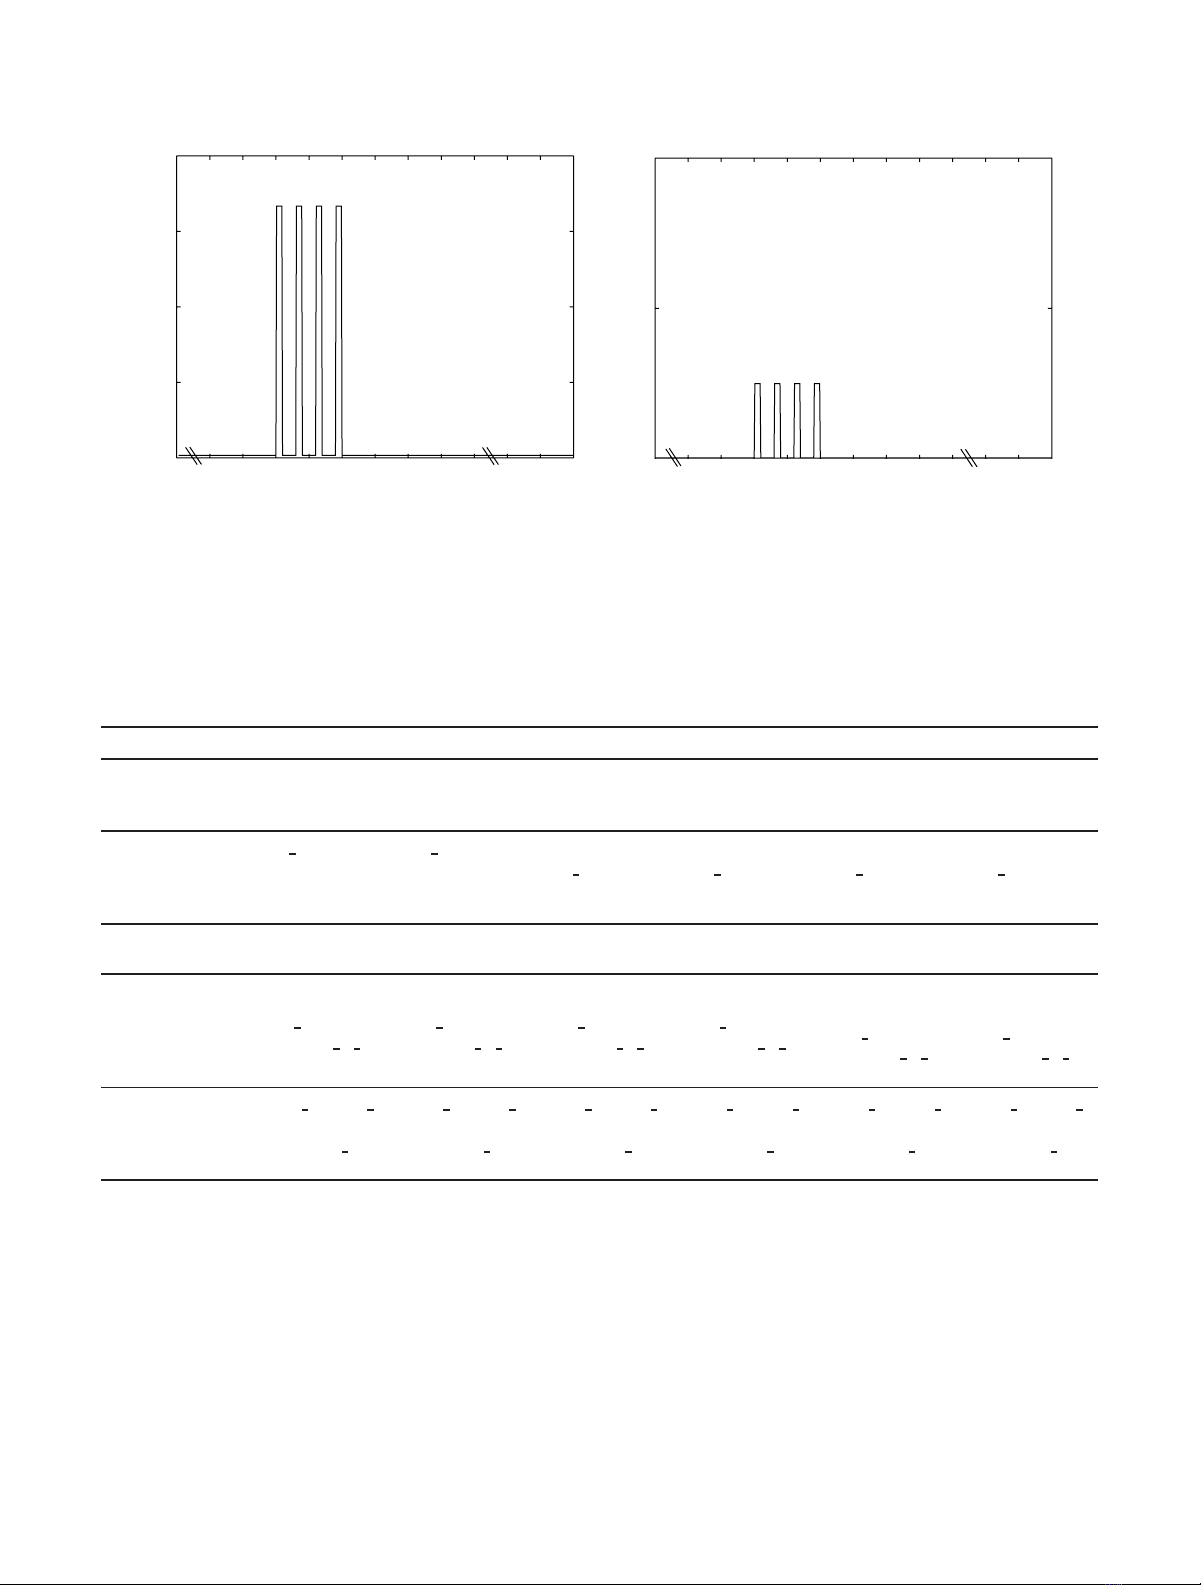
Figure 2: Four-train (a) calcium (Ca2+) and (b) dopamine (DA) inputs used in simulations.10µMCa
2+ and 1 µMDApulsesaregivenfor1s
at time points t=500, 503, 506, and 509 s. The duration of the basal plateau phases is thus 2 s. Before, between, and after the pulses a basal
concentration of 0.1 µMforCa
2+ and 0.01 µMforDAisused.
Table 4: Changed initial and total concentrations related to different states of CaMKII and PP1 to reach the total concentrations given in Ta b l e 3 .
Other values used in the simulations are based on the original models. We use here the actual names of the variables and constants as given
in the model code downloaded from a database. Values are given in units of µM.
Model Sim1 Sim2 Sim3 Sim4 Sim5 Sim6
d’Alcantara et al.
[16]
Naive states set
to total, others
zero
Naive states set
to total, others
zero
Naive states set
to total, others
zero
Naive states set
to total, others
zero
Naive states set
to total, others
zero
Naive states set
to total, others
zero
Kim et al. [17]
CK ini =0.5,
pp1tot =2,
CKCaM =0.01,
CKpCaM =0.01
CK ini =1,
pp1tot =4,
CKCaM =0.01,
CKpCaM =0.01
CK ini =2,
pp1tot =4
CK ini =4,
pp1tot =1
CK ini =20,
pp1tot =5
CK ini =20,
pp1tot =2
Lindskog et al. [18]camkmax =0.5,
PP1tot =2
camkmax =1,
PP1tot =4
camkmax =2,
PP1tot =4
camkmax =4,
PP1tot =1
camkmax =20,
PP1tot =5
camkmax =20,
PP1tot =2
Nakano et al. [19]
CaMKII =0.12,
PP1 active =
0.87, PP1 I1 p=
0.60
CaMKII =0.62,
PP1 active =
1.87, PP1 I1 p=
1.60
CaMKII =1.62,
PP1 active =
1.87, PP1 I1 p=
1.60
CaMKII =3.62,
PP1 active =
0.29, PP1 I1 p=
0.18
CaMKII =
19.62,
PP1 active =
2.37, PP1 I1 p=
2.10
CaMKII =
19.62,
PP1 active =
0.87, PP1 I1 p=
0.60
Hayer and Bhalla
[2]
basal CaMKII
PSD =0.5,
PP1-active PSD
=2
basal CaMKII
PSD =1,
PP1-active PSD
=4
basal CaMKII
PSD =2,
PP1-active PSD
=4
basal CaMKII
PSD =4,
PP1-active PSD
=1
basal CaMKII
PSD =20,
PP1-active PSD
=5
basal CaMKII
PSD =20,
PP1-active PSD
=2
produces higher concentration for active CaMKII. In this
sense, simulations of the hippocampal CA1 neuron models
by d’Alcantara et al. [16]andKimetal.[17] show similar
results for the concentrations of active CaMKII. Otherwise
the model by Kim et al. [17] produces different responses
for the concentration of active CaMKII compared to other
models.
In the case of PP1 (see Figures 3(b) and 3(e)), the higher
total concentration of PP1 produces higher concentration
for PP1. Most models have only one unbound form of PP1
which concentration is plotted. Furthermore, the same total
concentrations of PP1 (4 µMinSim2andSim3and2µMin
Sim1 and Sim6) produce about the same concentrations for
PP1.
The concentration of active PKA, which is the other
output of the model by Kim et al. [17] in addition to the
concentration of active CaMKII, varies very little due to the
variation in total concentrations of CaMKII and PP1 (see
Figure 3(f)). The simulations Sim1–Sim4, representing the
ratios 0.25, 0.5, and 4 of the total concentrations of CaMKII
and PP1, produce alike curves with peak concentrations
of about 80 nM. In addition, the simulations Sim5 and


%20--%3e%3cdefs%3e%3cstyle%3e%20.st0%20{%20fill:%20%23fff;%20}%20.st1%20{%20fill:%20%237800fa;%20}%20%3c/style%3e%3c/defs%3e%3cpath%20class='st1'%20d='M117.78,12.18H43.11c2.9,3.47,4.65,7.94,4.65,12.82,0,5.6-2.3,10.66-6.01,14.29h76.02l7.22-13.56-7.22-13.56Z'/%3e%3cg%3e%3cpath%20class='st0'%20d='M53.58,26.17h-.59v-1.46h.59v-4.96h2.83c1.78,0,2.67.94,2.67,2.82v5.76c0,1.87-.89,2.81-2.67,2.81h-2.83v-4.96ZM55.36,21.37v3.34h1.1v1.46h-1.1v3.34h1.01c.61,0,.91-.37.91-1.1v-5.93c0-.74-.3-1.1-.91-1.1h-1.01Z'/%3e%3cpath%20class='st0'%20d='M65.99,31.14h-1.8l-.31-2.07h-2.19l-.31,2.07h-1.64l1.82-11.39h2.62l1.82,11.39ZM65.28,18.04c-.25.46-.51.77-.75.94-.21.15-.47.22-.79.22-.26,0-.57-.07-.92-.22l-.38-.15c-.14-.05-.26-.07-.37-.07-.3,0-.53.18-.71.54l-.91-.68c.25-.46.51-.77.75-.94.21-.14.48-.21.79-.21.26,0,.57.07.92.21l.38.15c.14.05.26.07.37.07.3,0,.53-.18.71-.54l.91.68ZM61.91,27.52h1.73l-.87-5.76-.87,5.76Z'/%3e%3cpath%20class='st0'%20d='M74.53,26.89v1.52c0,1.91-.89,2.86-2.67,2.86s-2.67-.95-2.67-2.86v-5.93c0-1.91.89-2.86,2.67-2.86s2.67.95,2.67,2.86v1.11h-1.69v-1.22c0-.75-.31-1.12-.93-1.12s-.93.37-.93,1.12v6.15c0,.74.31,1.11.93,1.11s.93-.37.93-1.11v-1.63h1.69Z'/%3e%3cpath%20class='st0'%20d='M81.4,31.14h-1.8l-.31-2.07h-2.19l-.31,2.07h-1.64l1.82-11.39h2.62l1.82,11.39ZM75.9,19.2l1.52-1.91h1.71l1.51,1.91h-1.61l-.76-.95-.75.95h-1.61ZM77.32,27.52h1.73l-.87-5.76-.87,5.76ZM83.1,15.99l-1.76,1.91h-1.26l1.17-1.91h1.86Z'/%3e%3cpath%20class='st0'%20d='M84.86,19.75c1.78,0,2.67.94,2.67,2.82v1.48c0,1.87-.89,2.81-2.67,2.81h-.85v4.28h-1.79v-11.39h2.64ZM84.01,21.37v3.86h.85c.58,0,.87-.36.87-1.08v-1.71c0-.71-.29-1.07-.87-1.07h-.85Z'/%3e%3cpath%20class='st0'%20d='M93.51,19.75c1.78,0,2.67.94,2.67,2.82v1.48c0,1.87-.89,2.81-2.67,2.81h-.85v4.28h-1.79v-11.39h2.64ZM92.66,21.37v3.86h.85c.58,0,.87-.36.87-1.08v-1.71c0-.71-.29-1.07-.87-1.07h-.85Z'/%3e%3cpath%20class='st0'%20d='M98.8,31.14h-1.79v-11.39h1.79v4.88h2.03v-4.88h1.83v11.39h-1.83v-4.88h-2.03v4.88Z'/%3e%3cpath%20class='st0'%20d='M105.36,24.55h2.46v1.62h-2.46v3.34h3.09v1.63h-4.88v-11.39h4.88v1.63h-3.09v3.18ZM108.17,17.29l-1.76,1.91h-1.26l1.17-1.91h1.86Z'/%3e%3cpath%20class='st0'%20d='M112.2,19.75c1.78,0,2.67.94,2.67,2.82v1.48c0,1.87-.89,2.81-2.67,2.81h-.85v4.28h-1.79v-11.39h2.64ZM111.35,21.37v3.86h.85c.58,0,.87-.36.87-1.08v-1.71c0-.71-.29-1.07-.87-1.07h-.85Z'/%3e%3c/g%3e%3ccircle%20class='st1'%20cx='25'%20cy='25'%20r='20'/%3e%3cpath%20class='st0'%20d='M32.78,19.27c2.92,0,4.43,2.55,5.28,5.33l.71,2.17c.14.38-.33.75-.71.75h-5.61c.19-.33.24-.71.09-1.08l-.75-2.45c-.43-1.32-.99-2.64-1.79-3.77.75-.57,1.65-.94,2.78-.94h0ZM25,18.38c3.25,0,4.9,2.78,5.89,5.89l.76,2.45c.14.42-.33.8-.8.8h-11.69c-.42,0-.94-.38-.8-.8l.75-2.45c.99-3.11,2.64-5.89,5.89-5.89h0ZM25,11.35c1.74,0,3.11,1.37,3.11,3.11s-1.37,3.11-3.11,3.11-3.11-1.41-3.11-3.11,1.41-3.11,3.11-3.11h0ZM17.27,19.27c1.08,0,1.98.38,2.73.94-.8,1.13-1.37,2.45-1.74,3.77l-.8,2.45c-.14.38-.05.75.09,1.08h-5.56c-.42,0-.9-.38-.75-.75l.71-2.17c.9-2.78,2.41-5.33,5.33-5.33h0ZM17.27,12.91c1.51,0,2.78,1.27,2.78,2.83s-1.27,2.83-2.78,2.83-2.83-1.27-2.83-2.83,1.27-2.83,2.83-2.83h0ZM32.78,12.91c1.56,0,2.78,1.27,2.78,2.83s-1.23,2.83-2.78,2.83-2.83-1.27-2.83-2.83,1.27-2.83,2.83-2.83h0ZM27.07,28.56v.09c0,.57-.24,1.08-.61,1.46h0v.05c-.38.33-.9.57-1.46.57s-1.08-.24-1.46-.61h0c-.38-.38-.61-.9-.61-1.46v-.09h1.41v.09c0,.19.05.38.19.47v.05c.09.09.28.19.47.19s.38-.09.47-.19v-.05c.14-.09.24-.28.24-.47t-.05-.09h1.41ZM30.99,28.56v.09c0,1.65-.66,3.16-1.74,4.24-1.08,1.08-2.59,1.79-4.24,1.79s-3.16-.71-4.24-1.79l-.05-.05c-1.04-1.08-1.7-2.55-1.7-4.2v-.09h1.41v.09c0,1.27.47,2.4,1.27,3.25h.05c.85.85,1.98,1.37,3.25,1.37s2.4-.52,3.25-1.37c.85-.8,1.37-1.98,1.37-3.25v-.09h1.37ZM34.99,28.56v.09c0,2.78-1.13,5.28-2.92,7.07-1.79,1.79-4.29,2.92-7.07,2.92s-5.23-1.13-7.07-2.92c-1.79-1.79-2.92-4.29-2.92-7.07v-.09h1.41v.09c0,2.4.94,4.53,2.5,6.08,1.56,1.56,3.72,2.5,6.08,2.5s4.52-.94,6.08-2.5c1.56-1.56,2.5-3.68,2.5-6.08v-.09h1.41Z'/%3e%3c/svg%3e)