
RESEARC H Open Access
Thymoglobulin, interferon-gand interleukin-2
efficiently expand cytokine-induced killer (CIK)
cells in clinical-grade cultures
Giuseppina Bonanno
1,2
, Paola Iudicone
2
, Andrea Mariotti
1
, Annabella Procoli
1
, Annino Pandolfi
2
,
Daniela Fioravanti
2
, Maria Corallo
1
, Alessandro Perillo
1
, Giovanni Scambia
1
, Luca Pierelli
2,3†
, Sergio Rutella
4,5*†
Abstract
Background: Cytokine-induced killer (CIK) cells are typically differentiated in vitro with interferon (IFN)-gand aCD3
monoclonal antibodies (mAb), followed by the repeated provision of interleukin (IL)-2. It is presently unknown
whether thymoglobulin (TG), a preparation of polyclonal rabbit gimmunoglobulins directed against human
thymocytes, can improve the generation efficiency of CIK cells compared with aCD3 mAb in a clinical-grade
culture protocol.
Methods: Peripheral blood mononuclear cells (PBMC) from 10 healthy donors and 4 patients with solid cancer
were primed with IFN-gon day 0 and low (50 ng/ml), intermediate (250 ng/ml) and high (500 ng/ml)
concentrations of either aCD3 mAb or TG on day 1, and were fed with IL-2 every 3 days for 21 days. Aliquots of
cells were harvested weekly to monitor the expression of representative members of the killer-like immunoglobulin
receptor (KIR), NK inhibitory receptor, NK activating receptor and NK triggering receptor families. We also quantified
the frequency of bona fide regulatory T cells (Treg), a T-cell subset implicated in the down-regulation of anti-tumor
immunity, and tested the in vitro cytotoxic activity of CIK cells against NK-sensitive, chronic myeloid leukaemia K562
cells.
Results: CIK cells expanded more vigorously in cultures supplemented with intermediate and high concentrations
of TG compared with 50 ng/ml aCD3 mAb. TG-driven CIK cells expressed a constellation of NK activating/inhibitory
receptors, such as CD158a and CD158b, NKp46, NKG2D and NKG2A/CD94, released high quantities of IL-12p40 and
efficiently lysed K562 target cells. Of interest, the frequency of Treg cells was lower at any time-point compared
with PBMC cultures nurtured with aCD3 mAb. Cancer patient-derived CIK cells were also expanded after priming
with TG, but they expressed lower levels of the NKp46 triggering receptor and NKG2D activating receptor, thus
manifesting a reduced ability to lyse K562 cells.
Conclusions: TG fosters the generation of functional CIK cells with no concomitant expansion of tumor-
suppressive Treg cells. The culture conditions described herein should be applicable to cancer-bearing individuals,
although the differentiation of fully functional CIK cells may be hindered in patients with advanced malignancies.
Introduction
Adoptive cellular immunotherapy aims at restoring
tumour-cell recognition by the immune system, leading
to effective tumour cell killing. A major hurdle to the
successful immunotherapy of cancer is represented by
the difficulty in generating clinically relevant numbers of
immune effector cells with potent in vivo anti-tumour
activity, especially in heavily pre-treated patients. To
date, various populations of cytotoxic effector cells have
been expanded using robust cell culture procedures and
have been administered in a variety of human cancers.
Host effector cells endowed with killing activity against
tumour cells were initially described in the early 1980s
as lymphokine-activated killer (LAK) cells [1,2]. The
* Correspondence: srutella@rm.unicatt.it
†Contributed equally
4
Department of Hematology, Catholic University Med. School, Rome, Italy
Full list of author information is available at the end of the article
Bonanno et al.Journal of Translational Medicine 2010, 8:129
http://www.translational-medicine.com/content/8/1/129
© 2010 Bonanno et al; licensee BioMed Central Ltd. This is an Open Access article distributed under the terms of the Creative
Commons Attribution License (http://creativecommons.org/licenses/by/2.0), which permits unrestricted use, distribution, and
reproduction in any medium, provided the original work is properly cited.

LAK cell population is heterogeneous, being comprised
of CD3
-
CD56
+
NK cells, CD3
+
CD56
+
MHC-unrestricted
cytotoxic T cells and CD3
+
CD56
-
Tcells.Overthe
years, improvements in culture conditions, such as the
addition of aCD3 (OKT3) monoclonal antibody (mAb)
at the initiation of culture and the provision of cytokines
at the end of culture, translated into better expansion of
LAK cells. Current protocols to differentiate cytokine-
induced killer (CIK) cells are based on a combination of
1,000 IU/ml interferon (IFN)-gon day 1 of culture, fol-
lowed 24 hours later by OKT3 at 50 ng/ml and interleu-
kin (IL)-2 at 300 IU/ml [3]. At the end of the 21-28 day
culture period, CD3
+
CD56
+
cells, derived from
CD3
+
CD56
-
cells, acquire cytotoxicity against various
tumour cell targets, including acute myeloid leukaemia
(AML), chronic myeloid leukaemia (CML), B and T-cell
lymphoma. The expression of CD56 on CIK cells is
thoughttoresultfromIFN-gpriming with IL-12 pro-
duction from monocytes. CIK cells share phenotypic
and functional properties of both T cells and NK cells,
insofar they express CD3 and are rapidly expandable in
culture like T cells, while not necessitating functional
priming for in vivo activity like NK cells. Interestingly,
CIK cells do not recognize target cells through the T-
cell receptor (TCR) and do not require the presence of
major histocompatibility complex (MHC) molecules on
target cells, as suggested by the observation that cyto-
toxicity is not affected by antibody masking of the TCR
or MHC class I or class II molecules [4]. Cytotoxicity by
CIK cells does not rely on antibody-dependent cell cyto-
toxicity (ADCC) mechanisms, given the absence of
CD16 on their surface membrane, and is not inhibited
by the immune suppressive drugs cyclosporine A and
FK506 [5]. Conversely, the anti-tumour activity of CIK
cells mainly relies on the engagement of NK Group 2,
member D (NKG2D) by NKG2D ligands on tumour
cells, and on perforin-mediated pathways [6].
The in vivo activity of CIK cells was initially demon-
strated in a murine SCID/human lymphoma model,
where the co-administration of CIK cells with B lym-
phoma cells exerted a favorable effect on mice survival,
with a 1.5-2-log cell kill and minimal toxicity against
normal hematopoietic precursors [4]. CIK cells were
subsequently shown to protect against syngeneic and
allogeneic tumors in other experimental models, includ-
ing nude mice xenografted with human cervical carci-
noma cells [7-9]. An international registry (IRCC) has
been recently established with the aim to report results
from current clinical trials using CIK cells, either as
such or additionally manipulated [10]. Eleven clinical
trials with autologous or allogeneic CIK cells were iden-
tified, with 426 patients enrolled. Most trials included
male patients with hepatocellular carcinoma, gastric
cancer and relapsed lymphoma [11,12]. A clinical
response was reported in 384 patients who received up
to 40 infusions of CIK cells. The total response rate was
24% and a decrease of tumour volume was documented
in 3 patients. However, disease-free survival rates were
significantly higher in patients treated with CIK cells
than in a control group without CIK treatment.
Thymoglobulin® (TG) is a purified, pasteurized pre-
paration of polyclonal gimmunoglobulin raised in rab-
bits against human thymocytes [13]. TG is currently
indicated for the prevention and/or treatment of renal
transplant rejection, and displays specificity towards a
wide variety of surface antigens on both immune system
and endothelial cells. The precise mechanism(s) of
action underlying its immunosuppressive efficacy are
unclear, although T-cell depletion is considered to play
a prominent role. Other mechanisms include lympho-
cyte surface antigen modulation, transcription factor
activation, and interference with processes of immune
system cells, such as cytokine production, chemotaxis,
endocytosis, stimulation and proliferation (reviewed in
ref. [13]). TG may also induce apoptosis, antibody-
dependent lysis or complement-mediated lysis of various
immune system cells, thus negating leukocyte-endothe-
lial cell adhesion. Intriguingly, anti-lymphocyte globulin
therapy in patients with aplastic anemia enhanced the
function of MHC-unrestricted lymphocytes [14]. It is
presently unknown whether TG can expand CIK cells
more efficiently than aCD3 mAb in clinical-grade
cultures.
We report herein the results of an in vitro study
where TG was confronted with aCD3 mAb for its abil-
ity to promote the expansion and acquisition of cyto-
toxicity by CIK cells. We show that TG amplifies the
number of CIK cells with greater efficiency than aCD3
after 21 days in culture. CIK cells generated in this fash-
ion express a constellation of NK cell-associated inhibi-
tory/activating receptors, release considerable amounts
of IL-12p40 and lyse the NK-sensitive K562 cell line.
The above culture conditions were also applied to
PBMC from heavily pre-treated cancer patients, to
ascertain whether TG can be a candidate drug for the
optimization of CIK expansion protocols in preparation
for clinical trials.
Materials and methods
Generation of CIK cells
CIK cells were generated under good manufacturing
practice (GMP) conditions. Peripheral blood samples
were obtained by phlebotomy in 10 consented healthy
donors (median age 45 years; range, 22-58 years) and by
steady-state apheresis in 4 patients with advanced cervi-
cal cancer (n = 3) or melanoma (n = 1). The patients’
characteristics are listed in Table 1. The investigations
were reviewed and approved by the Ethical Committee
Bonanno et al.Journal of Translational Medicine 2010, 8:129
http://www.translational-medicine.com/content/8/1/129
Page 2 of 14

of the Catholic University Medical School in Rome (pro-
tocol ID: P/757/CE/2009).
Peripheral blood samples collected by venipuncture
were layered over Ficoll-Paque® (GE Healthcare Life
Sciences; Milan, Italy) and peripheral blood mononuc-
lear cells (PBMC) were separated by centrifugation at
1,400 rpm for 30 minutes, as already detailed [15]. After
washings with PBS, PBMC were grown in serum-free
medium (X-VIVO 10; Bio-Whittaker Europe, Belgium)
supplemented with 80 mg/L gentamycin (Schering
Plough, Milan, Italy) and incubated at 37°C in a 5% CO
2
atmosphere. Cells were seeded at 2.0 × 10
6
cells/ml in
25 cm
2
cell culture flasks (Corning, NY 14831, USA).
On day 0, cells were activated with recombinant human
IFN-g(1,000 IU/ml; Imukin®, Boehringer Ingelheim,
Ingelheim, Germany). The following day, cells were sti-
mulated with either aCD3 mAb (UCHT1 clone; 50-500
ng/ml, BD Biosciences, San Diego, CA) or Thymoglobu-
lin® (50-500 ng/ml, Genzyme Corp., Cambridge, MA)
and recombinant human IL-2 (rHuIL-2, 300 IU/ml; Pro-
leukin®, Novartis Pharma, Milan, Italy). Cell suspensions
were maintained in subculture with fresh medium sup-
plemented with rHuIL-2 every 3 days for 3 weeks. For
quality control, aliquots of cells were harvested weekly
and used for automatic cell counting, phenotypic analy-
sis, and microbiologic testing. Cell viability was evalu-
ated at the end of the culture period by flow cytometry,
after labeling with 7-amino-actinomycin-D (7-AAD;
Sigma-Aldrich, Milan, Italy) [16].
Flow cytometry and immunofluorescence
At baseline (day 0) and after 7, 14 and 21 days in cul-
ture, aliquots of cells were incubated for 30 minutes at
4°C with fluorochrome-conjugated mAb to CD3, CD8,
CD45, CD16+CD56 (BD Multitest™IMK Kit; BD Bios-
ciences, Mountain View, CA), CD94, CD158a
(KIR2DL1), CD158b (KIR2DL2/DL3; BD Biosciences),
NKG2A (KLRC1 or CD159a; R&D Systems, Oxon, UK),
NKp46 (CD335), NKG2D (CD314; Beckman Coulter,
Milan, Italy). Isotype-matched, fluorochrome-conjugated
mAb from the same manufacturers were used to control
for background fluorescence. The intracellular expres-
sion of the FoxP3 transcription factor was detected in
fixed/permeabilized T cells that were initially labeled
with anti-CD4 and anti-CD25 mAb (both from BD Bios-
ciences), followed by Alexa Fluor 488-conjugated rat
anti-human FoxP3 mAb (PCH101 clone; Human Regu-
latory T Cell Staining Kit; eBioscience, San Diego, CA).
Cells were run through a FACS Canto® flow cytometer
(BD Biosciences) with standard equipment [17]. Samples
were analyzed with the FACS Diva® software package
(BD Biosciences).
Cytotoxicity assay
After 21 days in culture, aliquots of cells were used for
cytotoxicity assays. Calcein acetoxymethyl ester (CAM)
has been recently developed as an alternative to radioac-
tive
51
Cr release assay [18]. CAM is a lipid-soluble,
non-polar compound that passively crosses the plasma
membrane in living cells, where it is cleaved by intracel-
lular esterases to reveal a very polar derivative of fluor-
escein (calcein) that remains trapped in the cytoplasm.
CAM (Fluka, Sigma Aldrich) was dissolved in DMSO to
a final concentration of 1 mM and stored in aliquots at
-80°C. K562 target cells (1 × 10
6
), derived from a patient
suffering from CML in blast crisis, were incubated in X-
VIVO 10 medium in the presence of pre-titrated con-
centrations of CAM (0.1 μM) for 10 minutes at 37°C,
shielded from light. The labeled cells were washed two
times in ice-cold medium supplemented with 10% fetal
bovine serum (FBS), were re-suspended in X-VIVO 10
and then plated in round bottom 96-well plates at 5-10
×10
5
cells/well in triplicate. CIK cells were added at the
effector-to-target (E:T) ratios detailed in the Figure
legends, in a final volume of 200 μl, and were incubated
for 4 hours. Cells were then washed with ice-cold PBS
and re-suspended in 20 μg/ml 7-AAD for 20 minutes at
room temperature, shielded from light, before flow cyto-
metry analysis [19]. 7-AAD is a fluorescent DNA
dye that selectively binds to GC regions of the DNA.
Table 1 Patients’characteristics
UPN Age/
Sex
Tumor
(histotype)
Stage/grade at
diagnosis
Previous treatments WBC×10
3
/μl
(PB/LK)*
Lymphocytes×10
3
/
μl (PB/LK)*
1 30/F Melanoma Advanced,
metastatic disease
Surgery, chemotherapy 4.8/55.1 1.19/28.82
2 62/F Cervical cancer
(squamous)
FIGO IIB Neoadjuvant radiochemotherapy, radical surgery,
chemotherapy (2 lines)
5.0/66.2 1.28/33.9
3 44/F Cervical cancer
(squamous)
FIGO IB Radical surgery, adjuvant radiochemotherapy,
chemotherapy (4 lines)
5.52/29.8 0.69/14.66
4 55/F Cervical cancer
(squamous)
FIGO IIIB Radiochemotherapy, chemotherapy (3 lines) 5.41/51.6 1.52/22.14
WBC = white blood cells; PB = peripheral blood; LK = leukapheresis product.
*Blood cell counts were obtained at patient enrolment.
Bonanno et al.Journal of Translational Medicine 2010, 8:129
http://www.translational-medicine.com/content/8/1/129
Page 3 of 14

The 7-AAD assay has been used to detect the loss of
membrane integrity during apoptosis of murine thymo-
cytes and human peripheral lymphocytes [20]. Percent
specific cell death was calculated according to the fol-
lowing formula, as previously published [21]:
%%
%
dead targets spontaneous dead targets
1 spontane
−
−00 oous dead targets
×100
Measurement of IL-12p40
After 21 days, supernatants from CIK cell cultures were
collected and used to quantify IL-12p40 production by
enzyme-linked immunosorbent assay (ELISA; R&D Sys-
tems, Oxon, UK), as reported [22]. The limit of detec-
tion was <15 pg/ml IL-12p40.
Statistical analysis
Data distribution was preliminarily tested with kurtosis
and symmetry. Data were presented as median and
inter-quartile range. All comparisons were performed
with the Mann-Whitney or the Wilcoxon signed-rank
tests for paired or unpaired determinations, as appropri-
ate. The criterion for statistical significance was defined
as p< 0.05.
Results
Generation of CIK cells with TG
In a first set of experiments, we determined whether
and to what extent TG promotes the generation of func-
tional CIK cells and other desirable populations of
immune effectors, namely, CD3
+
CD8
+
T cells and CD3
-
CD56
+
NK cells, starting from PBMC preparations. To
this end, PBMC from consented volunteer donors were
cultured in the presence of IFN-g, IL-2 and either TG
or aCD3 mAb at low (50 ng/ml), intermediate (250 ng/
ml) or high concentration (500 ng/ml), as schematically
depicted in Figure 1A. Cells were harvested on days +7,
+14 and +21, were counted to calculate fold-expansion
compared with baseline and were used to assess infor-
mative phenotypic features. The percentage of CD3
+
,
CD8
+
and CD3
+
CD56
+
T cells in a representative
day
0
IFN-Ȗ
TG/ĮCD3
21
IL-2
19
IL-2
16
IL-2
13
IL-2
10
IL-2
7
IL-2
4
IL-2
1
IL-2
C
A
B
4.3 15.7
12.3 9.0
26.1 53.9
12.4 66.3
*
**
D0 D7 D14 D21
0
25
50
75
100
125
low
TG
Cells (x10
6
)
D0 D7 D14 D21
0
25
50
75
100
125
int
TG
Cells (x106)
D0 D7 D14 D21
0
25
50
75
100
125
hi
TG
Cells (x10
6
)
D0 D7 D14 D21
0
10
20
30
40
50
60
low DCD3
Cells (x106)
D
0
D7 D14 D21
0
10
20
30
40
50
60 int
DCD3
Cells (x10
6
)
D
0
D7 D14 D21
0
10
20
30
40
50
60
hiDCD3
Cells (x106)
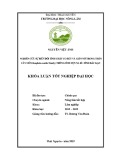
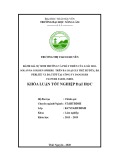
Figure 1 Experimental layout and expansion of PBMC in cultures supplemented with TG.Panel A: PBMC from consented healthy donors
were initially exposed to IFN-g(day 0), followed by different concentrations of either TG or aCD3 mAb (day +1) and IL-2 every 3 days. Further
details are provided in Materials and Methods. Panel B: The frequency of CD3
+
CD8
+
T cells, NK cells (CD3
-
CD16
+
CD56
+
) and CD3
+
CD56
+
T cells
from a representative PBMC sample at baseline is shown. Quadrant markers were set according to the proper isotypic control (not shown). The
percentage of cells staining positively for a given antigen is indicated. Panel C: Cells were harvested weekly and counted. The number of cells
was significantly higher after challenging with TG either at 250 (
int
TG; *p < 0.05) or 500 ng/ml (
hi
TG; **p < 0.05) compared with equal
concentrations of aCD3 mAb (bottom row).
Bonanno et al.Journal of Translational Medicine 2010, 8:129
http://www.translational-medicine.com/content/8/1/129
Page 4 of 14

PBMCsamplebeforeculturingisshowninFigure1B.
When used at intermediate (
int
TG) and high concentra-
tion (
hi
TG), TG induced a greater expansion of PBMC
compared with equal concentrations of aCD3 mAb, and
the difference was maximal after 14 and 21 days in
culture(Table2andFigure1c).
Hi
TG promoted a
46.08-fold expansion of PBMC on day +21, compared
with a median 11.75-fold expansion in the presence of
hi
aCD3 mAb. In contrast,
int
aCD3 and
hi
aCD3 mAb
failed to further increase PBMC number compared with
low
aCD3 at any time-point in culture (Table 2), likely
reflecting enhanced levels of activation-induced cell
death. As shown in Table 2, both
int
TG and
hi
TG caused
a greater fold-expansion of PBMC compared with aCD3
mAb at a concentration routinely used to differentiate
CIK cells, i.e., 50 ng/ml.
We next calculated the absolute number and esti-
mated the frequency of CD3
+
CD8
+
T cells, CD3
-
CD16
+
CD56
+
(NK cells), and CD3
+
CD16
+
CD56
+
(CIK cells)
in cultures supplemented with aCD3 mAb (Figure 2A;
Figure 3) or TG (Figure 2B; Figure 3). These PBMC cul-
tures started with a typical percentage of approximately
6-9% and 8-12% CD3
+
CD56
+
T cells and NK cells,
respectively (Figure 1B). After the 21-day culture period,
the median percentages of CIK cells and NK cells in
cultures maintained with
hi
aCD3 and
hi
TG were 64%
and 9.7%, and 55% and 27.5%, respectively. As expected,
CIK cells were predominantly comprised of CD3
+
CD8
+
T cells. It should be noted that the percentage of CD3
+
CD8
+
T cells at any time-point was consistently higher
in cultures supplemented with TG. This difference was
maximal when comparing CIK cultures at day +7 after
priming with TG or aCD3 mAb, as illustrated in Figure
A B
*
*
*
*
*
*
*
D0 D7 D14 D21
0
20
40
60
80
100
low
DCD3
CD3
+
CD8
+
T cells (x10
6
)
D0 D7 D14 D21
0
20
40
60
80
100
int
DCD3
CD3
+
CD8
+
T cells (x10
6
)
D
0
D7 D14 D21
0
20
40
60
80
100 hi
DCD3
CD3+CD8+ T cells (x106)
D0 D7 D14 D21
0
20
40
60
80
100
low
TG
CD3
+
CD8
+
T cells (x10
6
)
D0 D7 D14 D21
0
20
40
60
80
100
int
TG
CD3
+
CD8
+
T cells (x10
6
)
*
D
0
D7 D14 D21
0
20
40
60
80
100 hi
TG
CD3+CD8+ T cells (x106)
D0 D7 D14 D21
0
5
10
15
20
25
30
35
low
DCD3
CIK (x106)
D0 D7 D14 D21
0
5
10
15
20
25
30
35
int
DCD3
CIK (x106)
D
0
D7 D14 D21
0
5
10
15
20
25
30
35 hi
DCD3
CIK (x106)
D0 D7 D14 D21
0
10
20
30
40
50
60
low TG
CIK (x106)
D0 D7 D14 D21
0
10
20
30
40
50
60
intTG
CIK (x106)
D
0
D7 D14 D21
0
10
20
30
40
50
60
hi
TG
CIK (x10
6
)
D0 D7 D14 D21
0
1
2
3
4
5
low DCD3
NK cells (x10
6
)
D0 D7 D14 D21
0
1
2
3
4
5
intDCD3
NK cells (x10
6
)
D
0
D7 D14 D21
0
1
2
3
4
5
hi
DCD3
NK cells (x10
6
)
D0 D7 D14 D21
0
10
20
low TG
NK cells (x106)
D0 D7 D14 D21
0
10
20
intTG
NK cells (x106)
D
0
D7 D14 D21
0
10
20
hi
TG
NK cells (x10
6
)
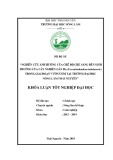
Figure 2 Expansion of CIK cells, NK cells and CD8
+
T cells in cultures supplemented with TG. The absolute number of CD3
+
CD8
+
T cells,
NK cells (CD3
-
CD16
+
CD56
+
) and CIK cells (CD3
+
CD16
+
CD56
+
) was estimated weekly after the provision of either aCD3 mAb (panel A) or TG
(panel B) to the cultures. Cumulative results from 10 experiments performed with 10 different PBMC preparations are expressed as median and
inter-quartile range. *denotes a statistically significant difference (p < 0.05) when comparing cell numbers in TG-containing cultures with those
in cultures nurtured with an equal concentration of aCD3 mAb.
Table 2 TG-induced expansion (fold-increase) of PBMC
from healthy donors
Culture
condition
T = 7d T = 14d T = 21d
low
aCD3
(50 ng/ml)
1.70
(1.2-2.3)
8.47
(3.9-15.58)
22.21
(9.78-33.04)
low
TG
(50 ng/ml)
2.90
(1.72-2.94)
8.74
(7.85-16.61)
30.56
(18.91-33.65)
int
aCD3
(250 ng/ml)
0.30
(0.24-1.35)
2.63
(0.26-5.01)
14.3
(10.05-15.41)
int
TG
(250 ng/ml)
2.50
(2.47-3.56)
14.86*
,
^
(7.21-17.45)
33.47
§,
^
(23.72-40.77)
hi
aCD3
(500 ng/ml)
0.59
(0.28-0.9)
5.28
(5.03-8.30)
11.75
(9.80-12.05)
hi
TG
(500 ng/ml)
2.63
(2.05-3.02)
11.96**,^
(6.01-17.91)
46.08
§§,
^^
(34.84-57.31)
Fold expansion of PBMC cells in culture has been calculated by dividing the
absolute number of cells at days 7, 14 and 21 by the absolute number of cells
at day 0. * and
§
p < 0.05 compared with
int
aCD3 mAb; ** and
§§
p < 0.01
compared with
hi
aCD3 mAb. ^ p < 0.05 compared with
low
aCD3 mAb; ^^ p <
0.01 compared with
low
aCD3 mAb.
Bonanno et al.Journal of Translational Medicine 2010, 8:129
http://www.translational-medicine.com/content/8/1/129
Page 5 of 14


%20--%3e%3cdefs%3e%3cstyle%3e%20.st0%20{%20fill:%20%23fff;%20}%20.st1%20{%20fill:%20%237800fa;%20}%20%3c/style%3e%3c/defs%3e%3cpath%20class='st1'%20d='M117.78,12.18H43.11c2.9,3.47,4.65,7.94,4.65,12.82,0,5.6-2.3,10.66-6.01,14.29h76.02l7.22-13.56-7.22-13.56Z'/%3e%3cg%3e%3cpath%20class='st0'%20d='M53.58,26.17h-.59v-1.46h.59v-4.96h2.83c1.78,0,2.67.94,2.67,2.82v5.76c0,1.87-.89,2.81-2.67,2.81h-2.83v-4.96ZM55.36,21.37v3.34h1.1v1.46h-1.1v3.34h1.01c.61,0,.91-.37.91-1.1v-5.93c0-.74-.3-1.1-.91-1.1h-1.01Z'/%3e%3cpath%20class='st0'%20d='M65.99,31.14h-1.8l-.31-2.07h-2.19l-.31,2.07h-1.64l1.82-11.39h2.62l1.82,11.39ZM65.28,18.04c-.25.46-.51.77-.75.94-.21.15-.47.22-.79.22-.26,0-.57-.07-.92-.22l-.38-.15c-.14-.05-.26-.07-.37-.07-.3,0-.53.18-.71.54l-.91-.68c.25-.46.51-.77.75-.94.21-.14.48-.21.79-.21.26,0,.57.07.92.21l.38.15c.14.05.26.07.37.07.3,0,.53-.18.71-.54l.91.68ZM61.91,27.52h1.73l-.87-5.76-.87,5.76Z'/%3e%3cpath%20class='st0'%20d='M74.53,26.89v1.52c0,1.91-.89,2.86-2.67,2.86s-2.67-.95-2.67-2.86v-5.93c0-1.91.89-2.86,2.67-2.86s2.67.95,2.67,2.86v1.11h-1.69v-1.22c0-.75-.31-1.12-.93-1.12s-.93.37-.93,1.12v6.15c0,.74.31,1.11.93,1.11s.93-.37.93-1.11v-1.63h1.69Z'/%3e%3cpath%20class='st0'%20d='M81.4,31.14h-1.8l-.31-2.07h-2.19l-.31,2.07h-1.64l1.82-11.39h2.62l1.82,11.39ZM75.9,19.2l1.52-1.91h1.71l1.51,1.91h-1.61l-.76-.95-.75.95h-1.61ZM77.32,27.52h1.73l-.87-5.76-.87,5.76ZM83.1,15.99l-1.76,1.91h-1.26l1.17-1.91h1.86Z'/%3e%3cpath%20class='st0'%20d='M84.86,19.75c1.78,0,2.67.94,2.67,2.82v1.48c0,1.87-.89,2.81-2.67,2.81h-.85v4.28h-1.79v-11.39h2.64ZM84.01,21.37v3.86h.85c.58,0,.87-.36.87-1.08v-1.71c0-.71-.29-1.07-.87-1.07h-.85Z'/%3e%3cpath%20class='st0'%20d='M93.51,19.75c1.78,0,2.67.94,2.67,2.82v1.48c0,1.87-.89,2.81-2.67,2.81h-.85v4.28h-1.79v-11.39h2.64ZM92.66,21.37v3.86h.85c.58,0,.87-.36.87-1.08v-1.71c0-.71-.29-1.07-.87-1.07h-.85Z'/%3e%3cpath%20class='st0'%20d='M98.8,31.14h-1.79v-11.39h1.79v4.88h2.03v-4.88h1.83v11.39h-1.83v-4.88h-2.03v4.88Z'/%3e%3cpath%20class='st0'%20d='M105.36,24.55h2.46v1.62h-2.46v3.34h3.09v1.63h-4.88v-11.39h4.88v1.63h-3.09v3.18ZM108.17,17.29l-1.76,1.91h-1.26l1.17-1.91h1.86Z'/%3e%3cpath%20class='st0'%20d='M112.2,19.75c1.78,0,2.67.94,2.67,2.82v1.48c0,1.87-.89,2.81-2.67,2.81h-.85v4.28h-1.79v-11.39h2.64ZM111.35,21.37v3.86h.85c.58,0,.87-.36.87-1.08v-1.71c0-.71-.29-1.07-.87-1.07h-.85Z'/%3e%3c/g%3e%3ccircle%20class='st1'%20cx='25'%20cy='25'%20r='20'/%3e%3cpath%20class='st0'%20d='M32.78,19.27c2.92,0,4.43,2.55,5.28,5.33l.71,2.17c.14.38-.33.75-.71.75h-5.61c.19-.33.24-.71.09-1.08l-.75-2.45c-.43-1.32-.99-2.64-1.79-3.77.75-.57,1.65-.94,2.78-.94h0ZM25,18.38c3.25,0,4.9,2.78,5.89,5.89l.76,2.45c.14.42-.33.8-.8.8h-11.69c-.42,0-.94-.38-.8-.8l.75-2.45c.99-3.11,2.64-5.89,5.89-5.89h0ZM25,11.35c1.74,0,3.11,1.37,3.11,3.11s-1.37,3.11-3.11,3.11-3.11-1.41-3.11-3.11,1.41-3.11,3.11-3.11h0ZM17.27,19.27c1.08,0,1.98.38,2.73.94-.8,1.13-1.37,2.45-1.74,3.77l-.8,2.45c-.14.38-.05.75.09,1.08h-5.56c-.42,0-.9-.38-.75-.75l.71-2.17c.9-2.78,2.41-5.33,5.33-5.33h0ZM17.27,12.91c1.51,0,2.78,1.27,2.78,2.83s-1.27,2.83-2.78,2.83-2.83-1.27-2.83-2.83,1.27-2.83,2.83-2.83h0ZM32.78,12.91c1.56,0,2.78,1.27,2.78,2.83s-1.23,2.83-2.78,2.83-2.83-1.27-2.83-2.83,1.27-2.83,2.83-2.83h0ZM27.07,28.56v.09c0,.57-.24,1.08-.61,1.46h0v.05c-.38.33-.9.57-1.46.57s-1.08-.24-1.46-.61h0c-.38-.38-.61-.9-.61-1.46v-.09h1.41v.09c0,.19.05.38.19.47v.05c.09.09.28.19.47.19s.38-.09.47-.19v-.05c.14-.09.24-.28.24-.47t-.05-.09h1.41ZM30.99,28.56v.09c0,1.65-.66,3.16-1.74,4.24-1.08,1.08-2.59,1.79-4.24,1.79s-3.16-.71-4.24-1.79l-.05-.05c-1.04-1.08-1.7-2.55-1.7-4.2v-.09h1.41v.09c0,1.27.47,2.4,1.27,3.25h.05c.85.85,1.98,1.37,3.25,1.37s2.4-.52,3.25-1.37c.85-.8,1.37-1.98,1.37-3.25v-.09h1.37ZM34.99,28.56v.09c0,2.78-1.13,5.28-2.92,7.07-1.79,1.79-4.29,2.92-7.07,2.92s-5.23-1.13-7.07-2.92c-1.79-1.79-2.92-4.29-2.92-7.07v-.09h1.41v.09c0,2.4.94,4.53,2.5,6.08,1.56,1.56,3.72,2.5,6.08,2.5s4.52-.94,6.08-2.5c1.56-1.56,2.5-3.68,2.5-6.08v-.09h1.41Z'/%3e%3c/svg%3e)