Abstract We have studied the photoluminescence
and Raman spectra of a system consisting of a poly-
styrene latex microsphere coated by CdTe colloidal
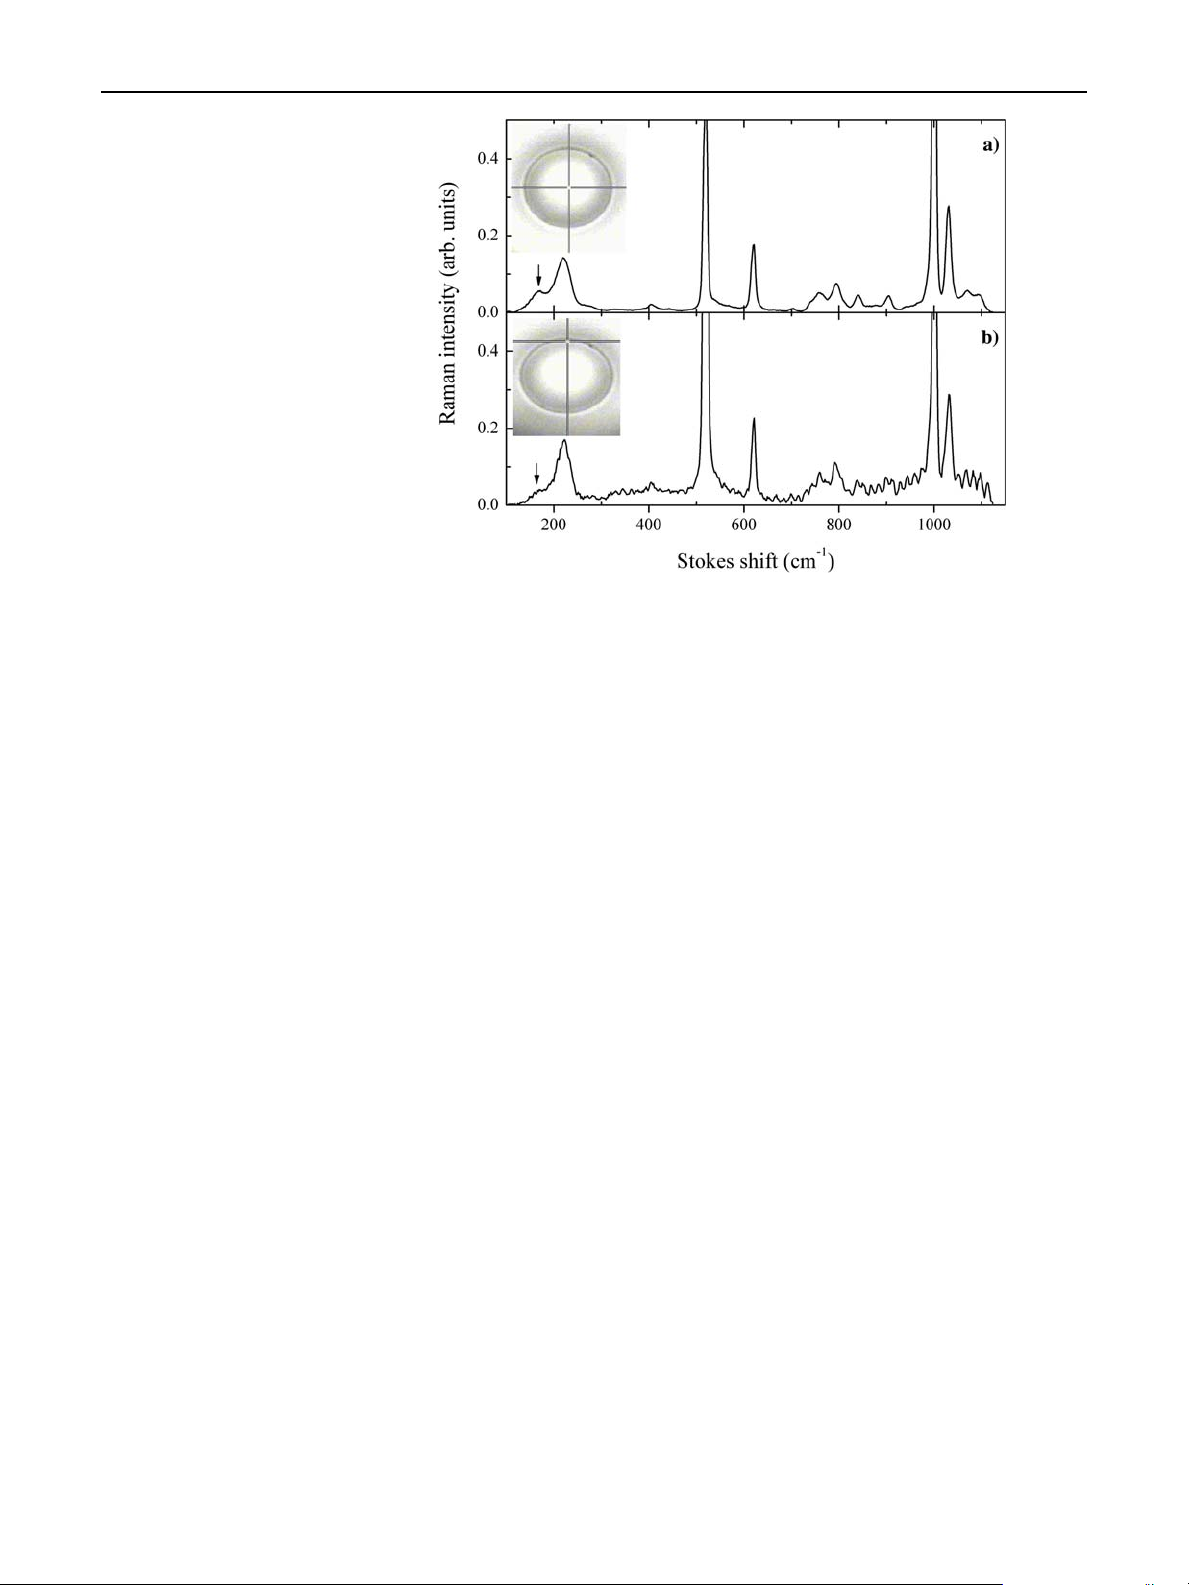
quantum dots. The cavity-induced enhancement of the
Raman scattering allows the observation of Raman
spectra from only a monolayer of CdTe quantum dots.
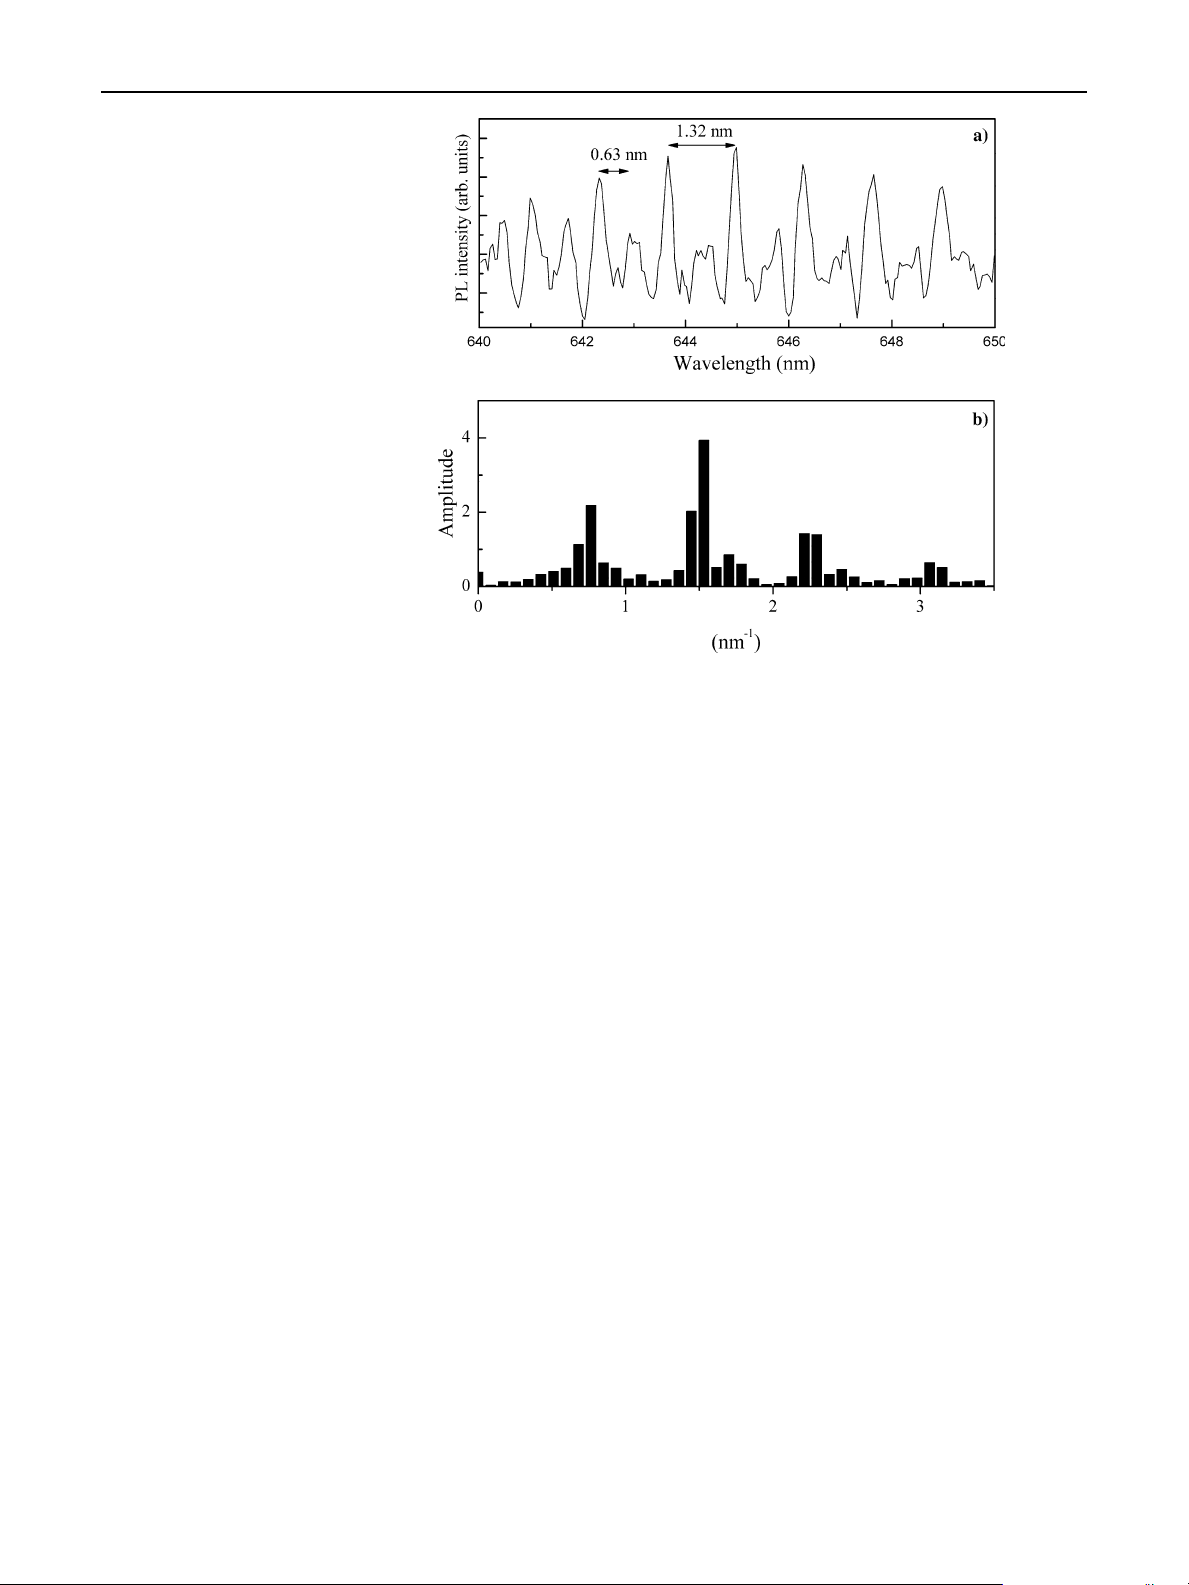
Periodic structure with very narrow peaks in the pho-
toluminescence spectra of a single microsphere was
detected both in the Stokes and anti-Stokes spectral
regions, arising from the coupling between the emis-
sion of quantum dots and spherical cavity modes.
Keywords Microcavity ÆNanocrystals ÆQuantum dots Æ
Raman spectroscopy ÆAnti-Stokes emission
Introduction
Spherical particles of 2–100 lm in diameter can act as
three-dimensional optical resonators providing the
feedback required for linear and non-linear optical
processes such as enhanced Raman scattering [1].
Polymer latex microspheres containing semiconductor
quantum dots (QDs) are promising candidates for the
development of advanced Raman sources [2], which
can extend the available range of semiconductor mic-
rolasers [3]. The combination of the high quality factor
(Q) and the small mode volume of dielectric micro-
spheres with the tunable emission properties of QDs
has made it possible to observe narrow resonant
structure in emission spectra [4,5], to detect the
modification of photoluminescence (PL) decay life-
times [4,5], enhanced spontaneous emission and lasing
[5,6]. Nowadays the understanding gained from the
organization of microspheres is starting to be used to
create new materials such as 3D photonic crystals that
can function as optical elements in a number of de-
vices. The properties of photonic band gap materials
depend sensitively on the microstructure of the sphere
packing and on the possibility to create localized states
in the optical spectrum. Thus, there is great incentive
to control the optical properties and the quality of such
building blocks on the level of a single microsphere.
Experimental method
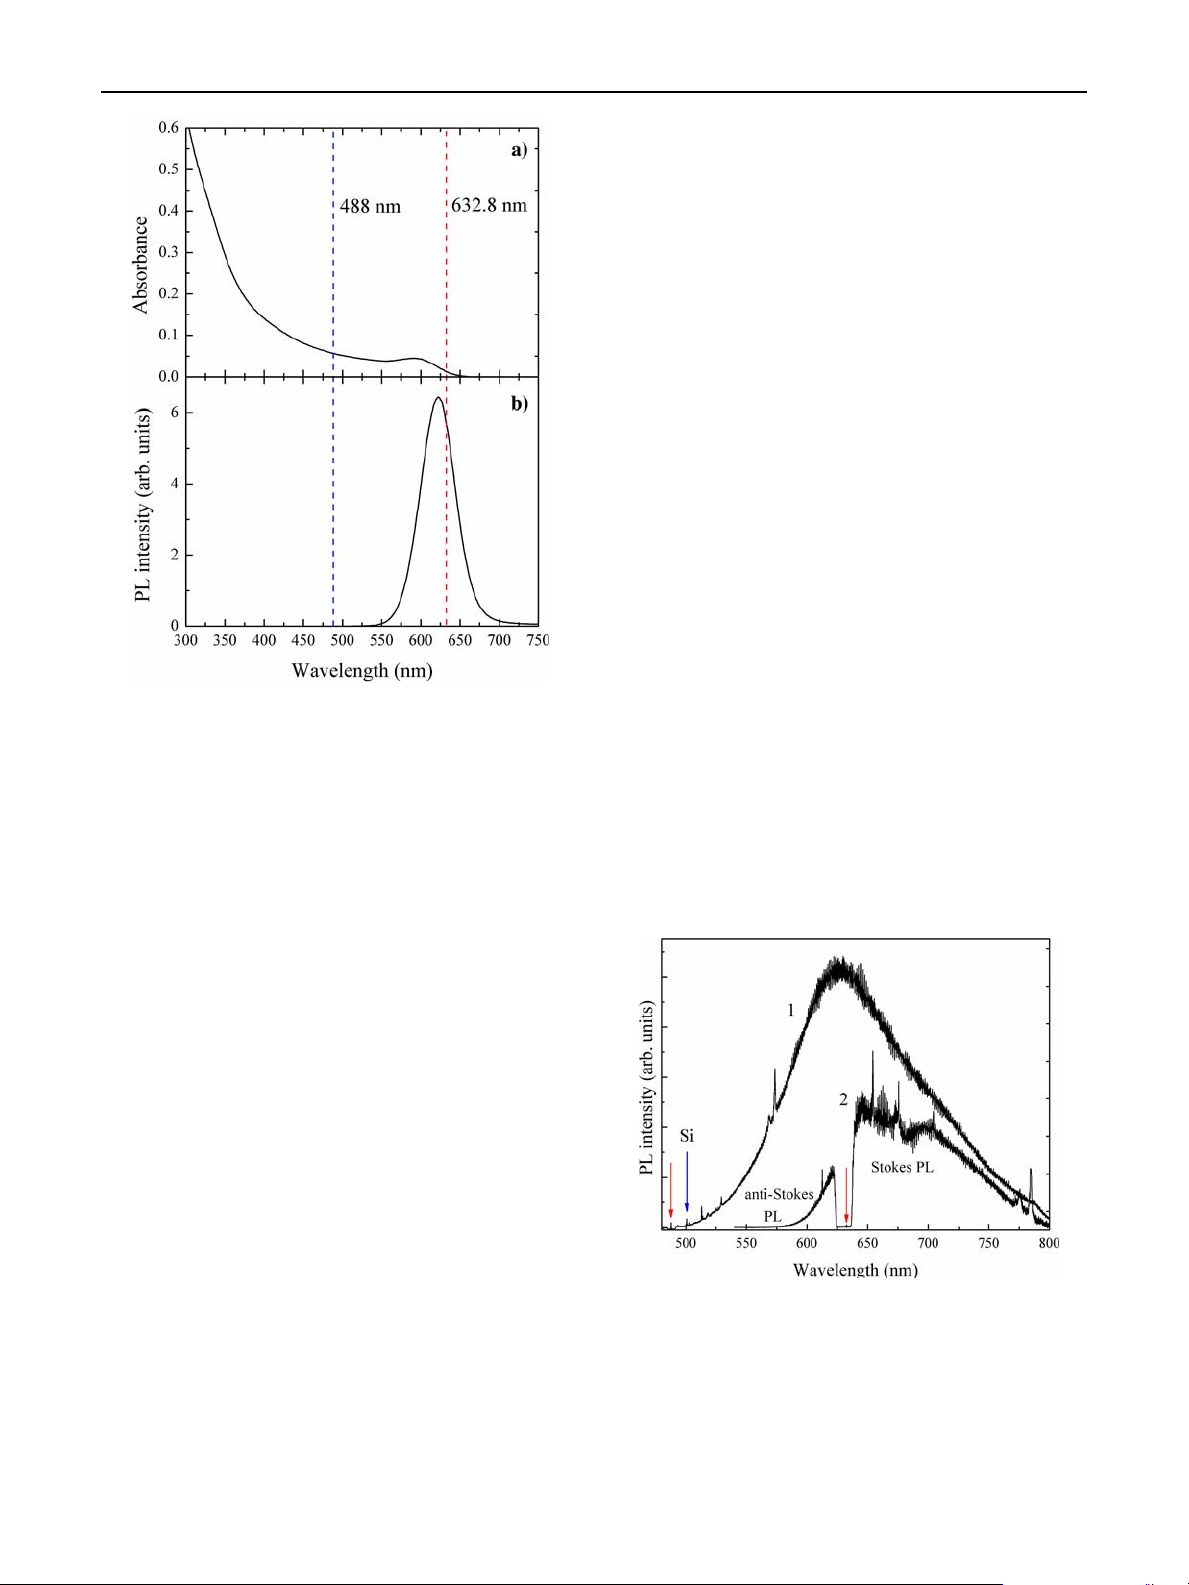
In this work, we have studied the photoluminescence
and Raman spectra of a microcavity-QD system con-
sisting of CdTe colloidal QDs coated onto a polysty-
rene (PS) microsphere. CdTe QDs capped with
thioglycolic acid were synthesized in aqueous media as
described elsewhere [7]. A colloidal solution of CdTe
QDs with a PL maximum at 620 nm (2.4 nm radius)
(Fig. 1) and a PL quantum efficiency of ~25% at room
temperature was used for coating PS microspheres with
N. Gaponik
Physical Chemistry/Electrochemistry, TU Dresden, 01062
Dresden, Germany
Y. P. Rakovich (&)ÆM. Gerlach ÆJ. F. Donegan
Semiconductor Photonics Group, School of Physics, Trinity
College, Dublin 2, Ireland
e-mail: Yury.Rakovich@tcd.ie
D. Savateeva
Brest State Technical University, 224017 Brest, Belarus
A. L. Rogach
Department of Physics and CeNS, University of Munich,
80799 Munich, Germany
Nanoscale Res Lett (2006) 1:68–73
DOI 10.1007/s11671-006-9005-9
123
NANO EXPRESS
Whispering gallery modes in photoluminescence and Raman
spectra of a spherical microcavity with CdTe quantum dots:
anti-Stokes emission and interference effects
Nikolai Gaponik ÆYury P. Rakovich Æ
Matthias Gerlach ÆJohn F. Donegan Æ
Diana Savateeva ÆAndrey L. Rogach
Published online: 25 July 2006
to the authors 2006
a monolayer of QDs utilizing the layer-by-layer
deposition technique [8]. The diameter of the PS
spheres used was 70 microns. Absorption and PL
spectra of aqueous solutions of colloidal QDs were
measured using Shimadzu-3101 and Spex Fluorolog
spectrometers, respectively. The Raman spectra from a
single microsphere were recorded in a backscattering
geometry using a Renishaw micro-Raman system
(~1,800 mm
–1
grating, 1 cm
–1
resolution). For all
measurements, the microspheres were deposited on a
Si wafer, which provides the built-in standard of the Si
transverse optical (TO) mode at 520 cm
–1
. PL and
Raman spectra of single microspheres were excited by
the 488 nm line of an Ar
+
laser with a power of 2 mW
or a He–Ne laser at 632.8 nm with a power up to
3 mW.
Results and discussion
The optical spectra of colloidal CdTe QDs in water are
presented in Fig. 1, demonstrating the high optical
quality by the pronounced peak in absorption and a
single band edge PL band. The blue shift of the QDs
absorption band by ~610 meV with respect to bulk
CdTe indicates a strong electronic quantum confine-
ment effect.
In contrast to the broad, featureless PL band in the
spectra of colloidal QDs (Fig. 1), the emission spectra
of a single PS/CdTe microsphere exhibit a tiny ripple
structure (Fig. 2, curve 1), which is superimposed on a
broad background signal. The spectrum also shows a
number of sharp peaks, which are intrinsic to the
Raman signal from the PS [9].
Figure 3a shows an enlargement of the measured PL
spectrum where the periodic structure of WGM peaks
can be seen in more detail, demonstrating that the
modes in the PL spectrum are arranged in pairs of two
pronounced peaks one of higher intensity and a second
smaller peak. Moreover, a few extra tiny peaks can be
distinguished in the spectral region between them. To
gain more insight into the WGM structure in the
microcavity we carried out a fast Fourier analysis,
which makes it possible to investigate the periodicity
more thoroughly. In the spectral frequency interval 0–
3.5 nm
–1
, we observed strong peaks corresponding to a
periodicity of 1.31, 0.65, 0.44 and 0.33 nm (see bars in
Fig. 3b). The highest periodicity value could be
assigned to the free spectral range (FSR) between
modes of the same polarization with radial order
numbers n= 1. Because transverse electric modes (TE)
have normally a higher quality factor than transverse
magnetic (TM) modes, we can attribute the stronger
peaks in Fig. 3a to the TE modes of the WGM. The
good agreement between the measured FSR of 1.32 nm
between the TE modes supports this hypothesis. In
turn, the periodicity of 0.65 nm is attributed to the FSR
between modes of different polarizations (i.e. between
Fig. 1 Room temperature absorption and PL spectra of CdTe
NCs in water. Dashed lines indicate the excitation wavelength
used in micro-PL and Raman experiments
Fig. 2 Room temperature PL spectra from a single PS micro-
sphere coated by one monolayer of CdTe QDs excited by an Ar
+
laser (above band-gap excitation, k= 488 nm, curve 1) and a
He–Ne laser (below band-gap excitation, k= 632.8 nm, lower
curve 2). The anomalous decrease of the PL intensity in the
wavelength region from 626 to 640 nm is due to the notch filter
used. Excitation wavelengths are indicated by red arrows
Nanoscale Res Lett (2006) 1:68–73 69
123
adjacent TE and TM modes) again in agreement with
measured modes separation (Fig. 3a). Periodicities of
0.44 and 0.33 nm, obtained from the Fourier analysis,
are indicative of the TE and TM modes with radial
order numbers which are greater than 1.
We also studied the optical behavior of the micro-
cavity-quantum dot system with excitation below the
band gap of the CdTe QDs in the region of low
absorption. In addition to the normal Stokes-shifted
luminescence, we make the observation of anti-Stokes
emission. The tail of the anti-Stokes PL (ASPL) can be
seen ranging up to (~200 meV) above the excitation
energy (Fig. 2, curve 2). The ASPL process is certainly
highly efficient having an intensity comparable to the
Stokes PL as seen from Fig. 2. We found that the
integrated intensity of ASPL has an almost linear
dependence on the excitation intensity under weak or
moderate excitation ( < 200 W/cm
2
). This dependence
is very similar to the behavior of ASPL in colloidal
CdTe QDs where the progressive transition from
Stokes PL into ASPL can be observed when changing
the excitation wavelength to below the band-gap
region [10]. A similar effect was recently reported in
small (2 lm) microspheres with a thin shell of semi-
conductor nanocrystals, and explained by multipho-
non-assisted excitation of an electron from the ground
state to the excited state through the mediation of the
shallow trap levels [2]. In the case of colloidal QDs
such a low cross-section mechanism, like anti-Stokes
excitation can be only efficient in samples with high
enough quantum yields [11,12]. The observation of
ASPL from a PS microsphere with a single layer of
CdTe QDs which have an order of magnitude lower
quantum efficiency than the colloidal dots can be
attributed to the optical feedback via the microcavity
with a WGM structure which leads to an increased
probability of energy transfer to the emitting species.
As a result, strong coupling between photonic states of
the spherical microcavity and electronic states of CdTe
QDs can be achieved simultaneously in both Stokes
and anti-Stokes spectral regions (Fig. 2, curve 2).
Although anti-Stokes PL was reported for colloidal
solutions of highly-luminescent CdTe and CdSe QDs
[10,12,13] the observation of up-converted PL for a
single monolayer of close-packed QDs is scarce [2].
As discussed above, Raman scattering from the PS
gives a significant contribution to the PL spectra shown
in Fig. 2. In order to investigate the microcavity effect
on phonon spectra we have studied the Raman scat-
tering from a single CdTe layer on a PS microsphere at
different excitation conditions.
The measured Raman spectra at resonance excita-
tion by an Ar
+
-laser (488 nm) shows a number of peaks
which are intrinsic to the PS (220, 620, 759, 793, 1,001
and 1,031 cm
–1
) (Fig. 4a, b). In addition to these lines,
the cavity-induced enhancement of the Raman scat-
tering allows for the observation of the LO phonon
mode from only a monolayer of CdTe QDs (166.0 cm
–1
)
(Fig. 4a, b), the mode is redshifted due to confinement
of optical phonons [14]. It is noteworthy that we were
Fig. 3 (a) Expansion of the
measured fluorescence
spectrum. Arrows indicate the
free spectral range (FSR) and
TE/TM mode splitting. (b)
Result of fast Fourier analysis
70 Nanoscale Res Lett (2006) 1:68–73
123
not able to observe any Raman signal arising from a
monolayer of CdTe QDs directly deposited on top of
the Si wafer. However, the most remarkable experi-
mental observation is a periodic (ripple) structure with
very narrow regular peaks in the spectra of the PS/NCs
microsphere, which can be clearly seen in Fig. 4b. This
structure corresponds to the WGM modes of the
spherical microcavity and can best be detected by
providing excitation at the rim of the microsphere.
The observed difference in the efficiency of the
WGM peaks at excitation in the center and at the rim
of the microsphere can be explained by the spatial
distribution of the electro-magnetic field inside the
microsphere. The resonant internal field of a spherical
cavity corresponding to high-Q modes is mostly con-
fined to the near-surface interior of the microsphere
[15]. Therefore, a uniform intensity distribution within
the rim of the microsphere in the volume determined
by the WGM can be expected if the incident wave is
resonant with a WGM. In such a situation edge illu-
mination with a focused beam excites the WGM of a
microsphere more uniformly and more efficiently than
at central excitation [15] which is in good agreement
with our experimental results.
As indicated above, for all measurements the micr-
ospheres were deposited on a Si wafer, which can
function also as a mirror reflecting the excitation beam.
On the other hand, the observation of WGM in spectra
of single microcavity testify to the high optical quality
of the microsphere surface. Combination of these two
modalities can be used to produce an interference
patterns with shape and fringe spacing depending on
the excitation geometry. Figure 5shows the interfer-
ence patterns recorded when excitation light was
focused on the top of a spherical microcavity and just
outside the rim of the microsphere. The resultant
interference light is generated by multiple reflections
between the microsphere surface and the Si wafer
surface. As the excitation spot shifts well off the
microsphere rim, the number of interference fringes
increases. We believe that the observed phenomenon
can be used for the development of optical encoders
that can determine the precise position of a micro-
particles above a reflecting interface.
Another feature, which can be clearly seen in
Fig. 4b is that the intensity of WGM peaks decreases as
they approach the excitation wavelength. We suggest
that the observed reduction of the peaks intensity in
the spectra of a CdTe/PS microsphere is due to
absorption by QDs that are coupled to the relevant
WGM. It is well- known that absorption or gain or
refractive index variation alter the Q value of the
spherical microcavity [16]. Because of the Stokes shift
(30 nm) between the intrinsic PL peak and the
absorption peak of the CdTe QDs, the absorption
coefficient is reduced on the long-wavelength part of
the PL band (Fig. 1), allowing a higher Qfactor to be
achieved in this spectral region.
Gaining a better insight into these experimental
findings, we have studied spectra of CdTe/PS micr-
ospheres using low intensity non-resonance excita-
tion by a He–Ne laser. In that case, strong coupling
between the WGM of the spherical microcavity and
the electronic states of the CdTe QDs was achieved
resulting in an enhanced luminescence contribution
to the signal simultaneously in both the Stokes and
Fig. 4 The Raman spectra of
a single CdTe/PS microsphere
on a Si substrate (excitation at
the center (a) and at the rim
of a spherical particle (b)).
Excitation by Ar
+
laser
k= 488 nm. The insets show
microscope images of the
CdTe/PS microsphere. The
dark cross indicates the
excitation position. Arrows
indicate the LO phonon mode
from a monolayer of CdTe
QDs
Nanoscale Res Lett (2006) 1:68–73 71
123
anti-Stokes spectral regions (Fig. 6). Both down and
up-converted PL emissions from QDs and WGM
are dominant in the spectra, while the Stokes and
anti-Stokes Raman signals from the Si TO modes
arising from substrate have a relatively small
contribution.
Fig. 5 Microscope images of
the CdTe/PS microsphere on
a Si substrate and the
corresponding interference
images. The dark cross
indicates the excitation
position
Fig. 6 Room temperature
spectrum of a single PS/CdTe
microsphere on a Si substrate.
Excitation by HeNe laser
k= 632.8 nm before (a) and
after (b) PL background
subtraction
72 Nanoscale Res Lett (2006) 1:68–73
123