J. Vet. Sci. (2007),
8(2), 117–120
J O U R N A L O F Veterinary Science
The micronucleus frequency in cytokinesis-blocked lymphocytes of cattle in the vicinity of a nuclear power plant
Hae-June Lee1, Chang-Mo Kang2, Se-Ra Kim1, Jong-Choon Kim1, Chun-Sik Bae1, Ki-Seok Oh1, Sung-Kee Jo3, Tae-Hwan Kim4, Jong-Sik Jang5, Sung-Ho Kim1,*
1College of Veterinary Medicine, Chonnam National University, Gwangju 500-757, Korea 2Korea Institute of Radiological & Medical Science, Seoul 139-240, Korea 3Advanced Radiation Technology Institute, KAERI, Jeongeup 580-185, Korea 4College of Veterinary Medicine, Kyungbuk National University, Daegu 702-701, Korea 5Department of Animal Science, Sangju National University, Sangju 742-711, Korea
One way of assessing the risk of genotoxins to humans is to develop nonhuman biological models where the dose, route of exposure, cell type, and end point examined are closely matched with those used for human screening. The peripheral blood lymphocyte (PBL) is the model cell type of choice for cytogenetic analyses. PBLs are relatively long- lived, initially nondividing cells that can be removed from human subjects with minimal discomfort, and have been used successfully as a biological dosimeter for examining the level of exposure to ionizing radiation [4,10,17,21].
Cytogenetic and hematological analyses were performed on the peripheral blood lymphocytes (PBLs) obtained from Korean native cattle bred in the vicinity of three nuclear power plants (Wolsong, Uljin and Yeonggwang) and in a control area. The micronucleus (MN) rates for the cattle from the Wolsong, Uljin and Yeonggwang nuclear power plants and for the control area were 9.87 ± 2.64, 8.90 ± 3.84, 9.20 ± 3.68 and 9.60 ± 3.91 per 1,000 cytokinesis-blocked lymphocytes, respectively. The apparent difference is not statistically significant. The MN frequencies of PBLs from cattle bred in the four areas are within the background variation for this study. The MN frequencies and hematological values were similar regardless of whether the cattle were bred near a nuclear power plant or in the control area.
Key words: cattle lymphocyte, micronucleus, nuclear power plant
Introduction
The cytokinesis-blocked micronucleus (CBMN) assay has been used widely to assess in vitro radiation-induced chromosomal damage, and a satisfactory dose relationship has been reported [14,16,22]. The micronucleus (MN) frequency has also been shown to be a reliable biomarker in many biomonitoring studies involving human populations examining therapeutic [8,19], occupational [5,9,20,23], and accidental or environmental [6,7] exposure to ionizing radiation. Compared with classical cytogenetic methods for evaluating the level of chromosomal damage, the MN assay for PBLs is relatively simple to perform and allows the rapid scoring of a large number of cells by personnel who are not specifically trained in chromosomal analysis. The ease of MN assays, as well as the reliability of the cytokinesis- blocked (CB) approach is an obvious advantage in radiobiological monitoring [1,12,18].
It is often useful to match human epidemiology with animal studies. Animals monitored or evaluated in situ for an appropriate suite of endpoints can provide required information on both the exposure levels and any potential adverse health effects. Animals have served as sentinel indicators for various health effects associated with a number of environmental hazards, including radiation [25,27]. Domestic animals may be particularly valuable in this application because they also share the human environment.
The ultimate goal of any mutagen testing program is to test the potential mutagen directly on human genetic material or at least to confidently extrapolate the results from other test systems to humans [2,3,13,15]. From a purely genetic standpoint, it is inconceivable that controlled testing will ever be performed on humans. Therefore, an extrapolation method must be developed. In order to accomplish this, it is essential that parallel experiments be carried out on either identical, or closely related, biological systems.
*Corresponding author Tel: +82-62-530-2837; Fax +82-62-530-2841 E-mail: shokim@chonnam.ac.kr
118
Hae-June Lee et al.
Cytokinesis-block method
The aim of this investigation was to determine the MN frequencies in PBLs of cattle bred in the vicinity of three nuclear power plants in the Korea (Wolsong, Uljin and Yeonggwang) and in a group of cattle bred in a control area, using the CBMN assay and hematological analysis.
Materials and Methods
Subjects and samples
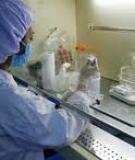
Cytochalasin B (Cyt-B; Aldrich Chemical, USA) was dissolved as a stock solution in dimethylsulfoxide at a concentration of 2 mg/ml, and was divided into small portions, and stored at −70oC. The Cyt-B stock solution was thawed, diluted in the medium and was added at a concentration of 4.0 µg/ml in medium 44 h after beginning the culture. A concentration of 4.0 µg/ml Cyt-B was chosen as this concentration was found to yield the largest number of binucleated cells. After a 72 h incubation period, the cells were resuspended and harvested onto glass slides using a cytocentrifuge (Cellspin; Hanil Science, Korea). The slides were air-dried, fixed in a mixture of methanol:glacial acetic acid (3 : 1) for 10 min and were stained using May- Gruenwald Giemsa for 10 min.
Blood samples were obtained from 35 Korean native cattle in farms located about 2 km away from each nuclear power station (Wolsong, Uljin and Yeonggwang) and 15 cattle in a control area (an area 100 km away from any of the nuclear power plants). All animals were free from viral infection and had not been exposed to vaccinations and drugs during the previous 3 months. The animals had been living in a herd for at least 1.5 years.
Scoring of MN
Measurement of hematograms and hematocrits
The MN in a total of 1,000 CB cells were scored using a microscope (Nikon Eclipse E600; Nikon, Japan) at a magnification of 1,000× with oil emulsion. Published criteria were used to identify the MN [1].
Statistic analysis
Whole blood was collected from the jugular vein of the cattle and the hematological parameters (hemoglobin, erythrocyte count, leukocyte count, platelet count and hematocrit) were determined by using an automated counter (Hemavet 850+; CDC Technologies, USA).
Cell culture
The data is presented as the mean and standard deviation. Statistical analysis was performed using the Student’s t-test to express the difference between the two groups. All analyses were performed using computer software (Graph PAD In Plot; Graph PAD Software, USA) and a personal computer.
Results
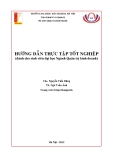
Table 1 shows the hematograms and hematocrits determined for the cattle from farms adjacent to the nuclear power plants and from a control area. Hematotolical analysis was performed to evaluate the general biological state of the animals. No significant difference was found in the counts between animals located near a nuclear power plant and animals in the control area.
Lymphocytes were separated from the whole blood of cattle on Ficoll-Hypaque gradients, washed twice in Hank’s balanced salt solution and were resuspended in RPMI 1640 medium containing Hepes buffer, 15% heat inactivated fetal calf serum, 2 mM L-glutamine, 0.05 mM 2-mercaptoethanol, 100 U/ml penicillin and 100 µg/ml streptomycin. The lymphocytes were cultured in 12-well tissue culture plates (Corning, USA) at concentration of 5 × 10⁵ cells/ml. The optimum concentration (2%) of phytohemagglutinin (PHA; Gibco BRL, USA) was used to stimulate the lymphocytes to transform and divide. The cells were cultured in a humidified at 37oC. atmosphere containing 5% CO 2
Table 1. Hematological values from cattle in the vicinity of the Wolsong, Uljin, Yeonggwang nuclear power plants and a control region
Test Unit Control Wolsong Uljin Yeonggwang
*mean ± SD.
7.16 ± 0.50 9.83 ± 0.52 29.90 ± 1.960 8.18 ± 1.89 3.37 ± 1.13 4.49 ± 1.47 0.25 ± 0.10 0.13 ± 0.10 0.04 ± 0.03 240 ± 590 7.48 ± 1.30 10.15 ± 1.210 33.13 ± 3.510 8.38 ± 2.14 3.66 ± 1.58 3.99 ± 1.12 0.37 ± 0.12 0.28 ± 0.15 0.10 ± 0.05 226 ± 600 8.78 ± 1.10 13.52 ± 1.620 33.02 ± 3.260 8.70 ± 1.51 4.01 ± 1.33 4.14 ± 0.42 0.26 ± 0.14 0.22 ± 0.10 0.07 ± 0.04 279 ± 420 8.57 ± 1.34 12.30 ± 1.890 34.31 ± 2.710 9.18 ± 2.16 2.97 ± 0.94 5.24 ± 1.66 0.80 ± 0.25 0.12 ± 0.08 0.05 ± 0.04 390 ± 840 Erythrocyte Hemoglobin Hematocrit Leukocyte Neutrophil Lymphocyte Monocyte Eosinophil Basophil Thrombocyte 106/µl g/dl % 103/µl 103/µl 103/µl 103/µl 103/µl 103/µl 103/µl
Lymphocyte micronuclei of cattle in vicinity of nuclear power plant
119
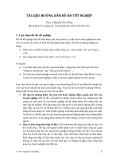
Table 2. Micronucleus frequency in binucleated lymphocytes of cattle in the vicinity of the Wolsong, Uljin, Yeonggwang nuclear power plants and a control region
aberrations is expensive and time consuming. Thus, a micronucleus test is more suitable for this study. The use of the MN assay would make a good screening test after an accidental release at a known point in time, and it would be useful in elucidating mechanisms of biological response in this species.
Ecological dosimetry could revolutionize ecological risk assessment by providing a direct, accurate and precise method for estimating the dose that organisms have received in the field. Direct investigations of the effects of chronic, low-level environmental exposures in humans are impossible for obvious ethical reasons. Therefore, in addition to being ecologically relevant, ecodosimetric investigations could provide valuable insight into the effects of this type of exposure on humans [25].
Number of MN per 1,000 CB cells Subject Control Wolsong Uljin Yeonggwang
10 15 07 08 03 14 09 04 11 08 07 11 08 11 10 06 13 04 06 16
The difference in the MN values between those of cattle bred near the nuclear power plants and those of cattle in the control area were not significantly different. The MN frequencies of PBLs from cattle bred in four areas show values that are within the background variation in this study The MN frequencies and hematological values were similar regardless of whether the cattle were bred near a nuclear power plant or the control area.
The peak of binucleated cell formation (16%) was found at a concentration of 2% PHA and 4 µg/ml Cyt-B. Table 2 shows the incidence of MN observed in cattle from all of the four areas. All of the cells with micronuclei were seen with only one micronucleus per binucleated cell. The incidence in Wolsong, Uljin, Yeonggwang and the control area were 9.87 ± 2.64, 8.90 ± 3.84, 9.20 ± 3.68 and 9.60 ± 3.91, respectively. The apparent difference is not statistically significant.
The cytogenetic biomarkers of radiation exposure in the cattle lymphocytes for environmental biodosimetry represent a useful methodology to employ for determining the level of exposure of a radionuclide-contaminated environment and provide genetically relevant measurement endpoints for ecological risk assessments [24]. The technique can be more sensitive when the MN frequencies are determined only in B-lymphocytes [22]. Another method to consider is the determination of the number of MN with centromeres. For this purpose, hybridization with pancentromeric DNA probes and fluorescence labeling is advantageous to perform [22] under the same experimental conditions.
10 4 7 7 21 10 10 13 7 07 09 08 11 08 12 9.60 ± 3.91 13 09 08 06 11 07 12 07 10 06 13 10 10 12 14 9.87 ± 2.64 8.90 ± 3.84 9.20 ± 3.68 01 02 03 04 05 06 07 08 09 10 11 12 13 14 15 mean ± SD
Discussion
Acknowledgments
This work was performed under the Nuclear R&D
Program by MOST, Korea.
References
1. Almassy Z, Krepinsky AB, Bianco A, Koteles GJ. The present state and perspectives of micronucleus assay in radiation protection. A review. Int J Rad Appl Instrum [A] 1987, 38, 241-249.
2. Brewen JG, Preston RJ. Cytogenetic effects of environmental mutagens in mammalian cells and the extrapolation to man. Mutat Res 1974, 26, 297-305.
Environmental release of low levels of radionuclides associated with mining, nuclear power and weapons production, as well as the medical use of radionuclides is a topic of continuing public concern [11,26]. Ecoepizoological methods are more suitable for assessment, because variations from factors other than pollution can be considered. For example, livestock have enforced controlled conditions such as a standard diet, enclosure, and in open grazing practice, low social stress, which make them an excellent sentinel animal for assessing the level of chromosomal damage that is most likely to be relevant to ecological risk from chronic, low-level exposure to radionuclides (and other clastogens) in the environment. The monitoring of chromosomal aberrations in agricultural animals is suitable for assessing the hygiene levels of herds that might have been exposed to genotoxicants. The radiation effects of ecodosimetric fields are expected to be weak. Moreover, a study of chromosomal
3. Brewen JG, Preston RJ, Jones KP, Gosslee DG. Genetic hazards of ionizing radiations: cytogenetic extrapolations from mouse to man. Mutat Res 1973, 17, 245-254.
4. Brewen JG, Preston RJ, Littlefield LG. Radiation-induced following an human chromosome aberration yields
120
Hae-June Lee et al.
implications for biological dosimetry. Radiat Res 1996, 145, 575-585. accidental whole-body exposure to 60Co gamma-rays. Radiat Res 1972, 49, 647-656. 17. Müller WU, Streffer C. Biological indicators for radiation damage. Int J Radiat Biol 1991, 59, 863-873.
5. Cardoso RS, Takahashi-Hyodo S, Peitl P Jr, Ghilardi- Neto T, Sakamoto-Hojo ET. Evaluation of chromosomal aberrations, micronuclei, and sister chromatid exchanges in hospital workers chronically exposed to ionizing radiation. Teratog Carcinog Mutagen 2001, 21, 431-439.
18. Ramalho A, Sunjevaric I, Natarajan AT. Use of the frequencies of micronuclei as quantitative indicators of X- ray-induced chromosomal aberrations in human peripheral blood lymphocytes: comparison of two methods. Mutat Res 1988, 207, 141-146.
19. Ramírez MJ, Surrallés J, Galofré P, Creus A, Marcos R. Radioactive iodine induces clastogenic and age-dependent aneugenic effects in lymphocytes of thyroid cancer patients as revealed by interphase FISH. Mutagenesis 1977, 12, 449- 455. 6. Chang WP, Hwang BF, Wang D, Wang JD. Cytogenetic effect of chronic low-dose, low-dose-rate gamma-radiation in residents of irradiated buildings. Lancet 1997, 350, 330-333. 7. Fenech M, Perepetskaya G, Mikhalevich L. A more comprehensive application of the micronucleus technique for biomonitoring of genetic damage rates in human populations -experiences from the Chernobyl catastrophe. Environ Mol Mutagen 1997, 30, 112-118.
131I exposure:
8. Gutiérrez S, Carbonell E, Galofré P, Creus A, Marcos R. in study induction by Micronuclei hyperthyroidism patients. Mutat Res 1997, 373, 39-45. 9. Heimers A. Chromosome aberration analysis in Concorde pilots. Mutat Res 2000, 467, 169-176. 20. Sari-Minodier I, Orsiere T, Bellon L, Pompili J, Sapin C, Botta A. Cytogenetic monitoring of industrial radiographers using the micronucleus assay. Mutat Res 2002, 521, 37-46. 21. Stephan G, Hadnagy W, Hammermaier C, Imhof U. Biologically and physically recorded doses after an accidental exposure to 60Co-gamma rays. Health Phys 1983, 44, 409-411.
10. IAEA. Biological dosimetry: chromosomal aberration analysis for dose assessment. In: Technical Reports Series. No. 260. pp. 9-13, International Atomic Energy Agency, Vienna, 1986. 22. Streffer C, Müller WU, Kryscio A, Böcker W. Micronuclei-biological indicator for retrospective dosimetry after exposure to ionizing radiation. Mutat Res 1998, 404, 101-105. 11. Jones D, Domotor S, Higley K, Kocher D, Bilyard G. in radiological ecological risk issues Principles and assessment. J Environ Radioact 2003, 66, 19-39.
23. Thierens H, Vral A, De Ridder L. A cytogenetic study of radiological workers: effect of age, smoking and radiation burden on the micronucleus frequency. Mutat Res 1996, 360, 75-82.
12. Kim SH, Cho CK, Kim TH, Yoo SY, Koh KH, Yun HG. Frequency of micronuclei in lymphocytes following gamma and fast-neutron irradiations. Anticancer Res 1993, 13, 1587- 1591.
24. Ulsh BA, Miller SM, Mallory FF, Mitchel RE, Morrison DP, Boreham DR. Cytogenetic dose-response and adaptive response in cells of ungulate species exposed to ionizing radiation. J Environ Radioact 2004, 74, 73-81.
13. Kligerman AD, Halperin EC, Erexson GL, Honore G, Westbrook-Collins B, Allen JW. A cytogenetic comparison of the responses of mouse and human peripheral blood lymphocytes to 60Co-gamma radiation. Radiat Res 1988, 115, 334-346. 25. Ulsh BA, Muhlmann-Diaz MC, Whicker FW, Hinton TG, Congdon JD, Bedford JS. Chromosome translocations in turtles: a biomarker in a sentinel animal for ecological dosimetry. Radiat Res 2000, 153, 752-759. 26. Vandecasteele CM. Environmental monitoring 14. Köksal G, Dalcí DO, Pala FS. Micronuclei in human lymphocytes: the Co-60 gamma-ray dose-response. Mutat Res 1996, 359, 151-157. and radioecology: a necessary synergy. J Environ Radioact 2004, 72, 17-23.
15. McFee AF, Banner MW, Sherrill MN. Induction of chromosome aberrations by in vivo and in vitro gamma- irradiation of swine leukocytes. Int J Radiat Biol Relat Stud Phys Chem Med 1972, 21, 513-520.
27. van der Schalie WH, Gardner HS Jr, Bantle JA, De Rosa CT, Finch RA, Reif JS, Reuter RH, Backer LC, Burger J, Folmar LC, Stokes WS. Animals as sentinels of human health hazards of environmental chemicals. Environ Health Perspect 1999, 107, 309-315. 16. Mill AJ, Wells J, Hall SC, Butler A. Micronucleus induction in human lymphocytes: comparative effects of X rays, alpha particles, beta particles and neutrons and