
BioMed Central
Page 1 of 12
(page number not for citation purposes)
Journal of Immune Based Therapies
and Vaccines
Open Access
Original research
A phase I, randomized study of combined IL-2 and therapeutic
immunisation with antiretroviral therapy
Gareth AD Hardy†1, Nesrina Imami†1, Mark R Nelson2, Ann K Sullivan2,
Ron Moss3, Marlén MI Aasa-Chapman4, Brian Gazzard2 and
Frances M Gotch*1
Address: 1Department of Immunology, Imperial College London, Chelsea and Westminster Hospital, 369 Fulham Road, London, SW10 9NH, UK,
2Department of HIV/GU Medicine, Imperial College London, Chelsea and Westminster Hospital, 369 Fulham Road, London, SW10 9NH, UK,
3Immune Response Corporation, Carlsbad, CA, USA and 4Wohl Virion Centre, Windeyer Institute of Medical Sciences, UCL, London, W1T 4JF, UK
Email: Gareth AD Hardy - gareth.hardy@case.edu; Nesrina Imami - n.imami@imperial.ac.uk; Mark R Nelson - sandra.mead@chelwest.nhs.uk;
Ann K Sullivan - ann.sullivan@chelwest.nhs.uk; Ron Moss - shotdoc92130@yahoo.com; Marlén MI Aasa-Chapman - m.aasa-
chapman@ucl.ac.uk; Brian Gazzard - eileen.witney@chelwest.nhs.uk; Frances M Gotch* - f.gotch@imperial.ac.uk
* Corresponding author †Equal contributors
Abstract
Background: Fully functional HIV-1-specific CD8 and CD4 effector T-cell responses are vital to the
containment of viral activity and disease progression. These responses are lacking in HIV-1-infected
patients with progressive disease. We attempted to augment fully functional HIV-1-specific CD8 and CD4
effector T-cell responses in patients with advanced chronic HIV-1 infection.
Design: Chronically infected patients with low CD4 counts T-cell counts who commenced antiretroviral
therapy (ART) were subsequently treated with combined interleukin-2 and therapeutic vaccination.
Methods: Thirty six anti-retroviral naive patients were recruited and initiated on combination ART for
17 weeks before randomization to: A) ongoing ART alone; B) ART with IL-2 twice daily for 5 days every
four weeks starting at week 17 for 3 cycles; C) ART with IL-2 as in group B and Remune HIV-1 vaccine
administered once every 3 months, starting at week 17; and D) ART with Remune vaccine as in group C.
Patients were studied for 65 weeks following commencement of ART, with an additional prior 6 week
lead-in observation period. CD4 and CD8 T-cell counts, evaluations of HIV-1 RNA levels and proliferative
responses to recall and HIV-1 antigens were complemented with assessment of IL-4-secretion alongside
quantification of anti-HIV-1 CD8 T-cell responses and neutralizing antibody titres.
Results: Neither IL-2 nor Remune™ vaccination induced sustained HIV-1-specific T-cell responses.
However, we report an inverse relationship between HIV-1-specific proliferative responses and IL-4
production which continuously increased in patients receiving immunotherapy, but not patients receiving
ART alone.
Conclusion: Induction of HIV-1-specific cell-mediated responses is a major challenge in chronically HIV-
1-infected patients even when combining immunisation with IL-2 therapy. An antigen-specific IL-4-
associated suppressive response may play a role in attenuating HIV-specific responses.
Published: 11 April 2007
Journal of Immune Based Therapies and Vaccines 2007, 5:6 doi:10.1186/1476-8518-5-6
Received: 29 September 2006
Accepted: 11 April 2007
This article is available from: http://www.jibtherapies.com/content/5/1/6
© 2007 Hardy et al; licensee BioMed Central Ltd.
This is an Open Access article distributed under the terms of the Creative Commons Attribution License (http://creativecommons.org/licenses/by/2.0),
which permits unrestricted use, distribution, and reproduction in any medium, provided the original work is properly cited.

Journal of Immune Based Therapies and Vaccines 2007, 5:6 http://www.jibtherapies.com/content/5/1/6
Page 2 of 12
(page number not for citation purposes)
Background
Immune recovery subsequent to antiretroviral therapy
(ART) often appears to be partial and does not comprise
the HIV-1-specific CD4 or CD8 T-cell proliferative and IL-
2-producing responses that are associated with protection
from disease progression [1-5]. These potentially protec-
tive HIV-1-specific T-cell responses [6-9], become dys-
functional and exhausted with progressing disease. A
number of approaches attempt modulation of cell-medi-
ated responses, including therapeutic immunisation
[2,10-12]. Remune™ is a whole, gp120-depleted, inacti-
vated, HIV-1 immunogen in incomplete Freund's adju-
vant (IFA) prepared from the recombinant primary isolate
HZ-321 [13] (clade A envelope, clade G gag). Clinical tri-
als of intramuscular (I/M) Remune™ including one phase
III [14], have failed to demonstrate increases in disease-
free survival time despite Remune's™ induction of HIV-1-
specific CD4 T-cell responses [15]. Sub-group analysis
failed to demonstrate any consistent effects on viral loads
or CD4 counts [16]. Despite this, Remune™ may delay dis-
ease progression and reduce development of antiretroviral
resistance [17].
Sub-cutaneous (S/C) interleukin (IL)-2, administered
with ART, increases CD4 T-cell numbers [18-21] and
recall antigen-specific CD4 lymphocyte proliferation
[22,23]. However timing may be crucially important to
the induction of cell-mediated responses [24]. We have
previously shown that IL-2 administration subsequent to
immunization was associated with boosted responses to
the antigen in question, suggesting a therapeutic role for
IL-2 in enhancing proliferative T-cell responses in HIV-1
infection [2,25].
We investigated the ability of Remune™ and IL-2, com-
bined and separately, to induce HIV-1-specific CD4 and
CD8 T-cell responses in chronically HIV-1-infected
patients on ART in an observational, open-label, rand-
omized, pilot study. We also assessed antigen-specific IL-
4 release as this cytokine plays a role in balance and/or
suppression of cell-mediated responses [26,27], We report
here evaluation of specific T-cell proliferation, antigen-
specific IL-4 release, CD8 T-cell IFN-γ responses and neu-
tralizing antibody titres, in order to comprehensively
describe the specific immune response relevant to control
of viral replication.
Methods
Patients and Study Design
In this observational, phase I, pilot study conducted at
Chelsea and Westminster Hospital, London, 36 antiretro-
viral-naive patients were initiated on ART at week 0, which
was continued for the duration of the study. ART com-
prised 2 nucleoside analogues and one protease inhibitor
or non-nucleoside reverse transcriptase inhibitor. At week
17 patients were randomized to receive immunotherapy
with IL-2 and/or therapeutic immunisation with a gp120-
depleted whole inactivated HIV-1 immunogen. Sufficient
Remune™ was donated for use in 20 patients by Immune
Response Corporation (IRC), Carlsbad, CA, USA. Patients
were randomized at week 17 only if their viral load was
<50 copies ml/plasma and CD4 T-cell count was ≥ 300
cells/µl blood at week 16. Treatment groups for randomi-
zation were as follows: A) ART alone (n = 9); B) ART plus
IL-2 (Proleukin™) (n = 11); C) ART plus IL-2 and
Remune™ (n = 7); and D) ART plus Remune™ (n = 9). IL-
2 (5 × 10⁶U) was administered S/C, twice daily, for 5 days
at weeks 17, 21 and 25. 100 µg Remune™ was adminis-
tered I/M at weeks 17, 29, 41 and 53. Laboratory analysis
was conducted at weeks- -6, -3 and 0 before ART, and
weeks 1, 2, 4, 8, 16, 17, 21, 25, 29, 41, 53 and at study
completion at week 65. The primary outcome was induc-
tion of positive changes in lymphocyte proliferative
responses to HIV-1 antigens. In addition to the main
study time points, a further sub-study of viral loads and
lymphocyte subset numbers was conducted in a sub-set of
patients (n = 15) receiving IL-2 in groups B and C on the
5th day of each IL-2 cycle, i.e. at weeks 18, 22 and 26. This
sub-study was initiated after the main study had begun
and included all patients receiving IL-2 in groups B and C
from the date of its inception. Appropriate regulatory
approval was granted by Riverside Ethics Committee and
patients gave written informed consent.
Separation of PBMCs
PBMC were separated from whole blood by density gradi-
ent centrifugation and cultured in RPMI-1640 with
NaCO3 (Sigma, Poole, UK) and 100 IU/ml penicillin, 100
µg/ml streptomycin and 2 mM L-glutamine supple-
mented with 10% human AB plasma (all Sigma).
Viral Load and Lymphocyte Subsets
Plasma viral load was measured using the Bayer HIV-1
RNA 3.0 assay (bDNA) (lower limit 50 copies/ml) (Bayer
Diagnostics, Newbury, UK). Whole blood lymphocytes
were counted with monoclonal antibodies to: CD3, CD4,
CD8, and CD45 (Tetra One, Beckman Coulter, High
Wycombe, UK) on an Epics XL-MCL flow cytometer
(Beckman Coulter).
Recall and HIV-1 antigens
Recombinant HIV-1 and recall antigens (Medical
Research Council Centralised Facility for AIDS Reagents,
National Institute for Biological Standards and Controls,
Potters Bar, UK) were used as described previously [2], at
a final concentration of 10 µg/ml. Remune™ and its native
p24 (IRC, Ca) were used at 3 µg/ml [28].

Journal of Immune Based Therapies and Vaccines 2007, 5:6 http://www.jibtherapies.com/content/5/1/6
Page 3 of 12
(page number not for citation purposes)
Lymphocyte Proliferative Assays
Proliferation assays and supernatant collection for IL-4
assessment were conducted as previously described [2].
Stimulation indices (SI) for triplicates (standard error
<15%) were calculated as antigen-stimulated β-particle
counts per minute (cpm)/no antigen cpm. A positive
response was regarded as a SI >5.
Measurement of Cytokine Production
IL-4 bioassays were carried out as previously described [2]
using IL-4 (CT.h4S) dependent cell lines. Briefly, IL-4 was
measured in culture supernatants of HIV-1 antigen stimu-
lated proliferation assays. Proliferation of the IL-4-
dependent cell line CT.h4S was measured by incorpora-
tion of tritiated thymidine. Results are presented as IL-4
driven cpm.
Delayed hypersensitivity (DTH) tests to Remune™
In vivo delayed-type hypersensitivity (DTH) skin tests to
Remune™ antigen were performed to assess HIV-1-specific
cell-mediated immune responses as described elsewhere
[29] in all patients at weeks 17, 29 and 53.
HLA-typing
HLA haplotypes of patients were assessed by PCR-SSP
[30].
IFN-
γ
ELIspot assays
IFN-γ ELIspots were conducted as described previously
[31]. Briefly, 2.5 × 10⁵ PBMC from individual patients
who had been tissue typed were cultured with or without
10 µg/ml of appropriate HLA-restricted peptides or PHA
(positive control) in 96-well anti-IFN-γ (Mabtech, Stock-
holm, Sweden) coated PVDF-backed plates (Millipore,
Watford, UK). After overnight incubation IFN-γ spot-
forming cells (SFC) were detected according to the manu-
facturer's instructions (Mabtech).
Neutralisation assays
Immunoglobulin (Ig)G was purified from patient and
HIV-1 negative plasma using the MAbTrap kit (Amersham
Biosciences, Little Chalfont, UK), and quantified by Pro-
tein Assay (Bio-Rad, Munich, Germany). Two-fold serial
dilutions of purified IgG, from 1 mg/ml, were incubated
with 100 focus forming units (FFU) of HIV-1SF162 for 1 hr
at 37°C and then plated onto NP2/CD4+/CCR5+ cells.
Infection was detected after 48 hrs by p24-immunostain-
ing, as detailed before [32]. The percentage reduction of
infection was calculated: 100 × (1-(mean FFU with patient
IgG)/(mean FFU with seronegative IgG at 1 mg/ml)).
Statistical Analysis
Changes in lymphocyte subsets and viral load between
week 0 and 16, weeks 0 and 65 and weeks 16 and 65, were
assessed using the Wilcoxon Signed Rank test. Prolifera-
tion and IL-4 data were assessed with repeated measures
analysis of variance using MIXED procedure in SAS statis-
tical software. For log-transformed antigen-specific prolif-
erative stimulation indices, between and within subject
weeks 0 to 17, weeks 17 to 65 and weeks 0 to 65, adjusted
separate slopes were estimated for each study arm with
95% confidence interval. Differences in overall viral load
from week 18–26, between groups B and C were assessed
using the Pearson Chi-squared test.
Results
Patient demographics
Fifty two anti-retroviral naïve patients were screened for
this study which was carried out at the Chelsea and West-
minster Hospital, London over a six year period. Of the
screened patients 16 dropped out prior to randomisation
at week 17. All the remaining 36 patients who were ran-
domised completed the study. The mean age of patients at
study entry was 38.75 years. There was one female patient
(2.78%) and 100% of patients were of white European
ethnicity.
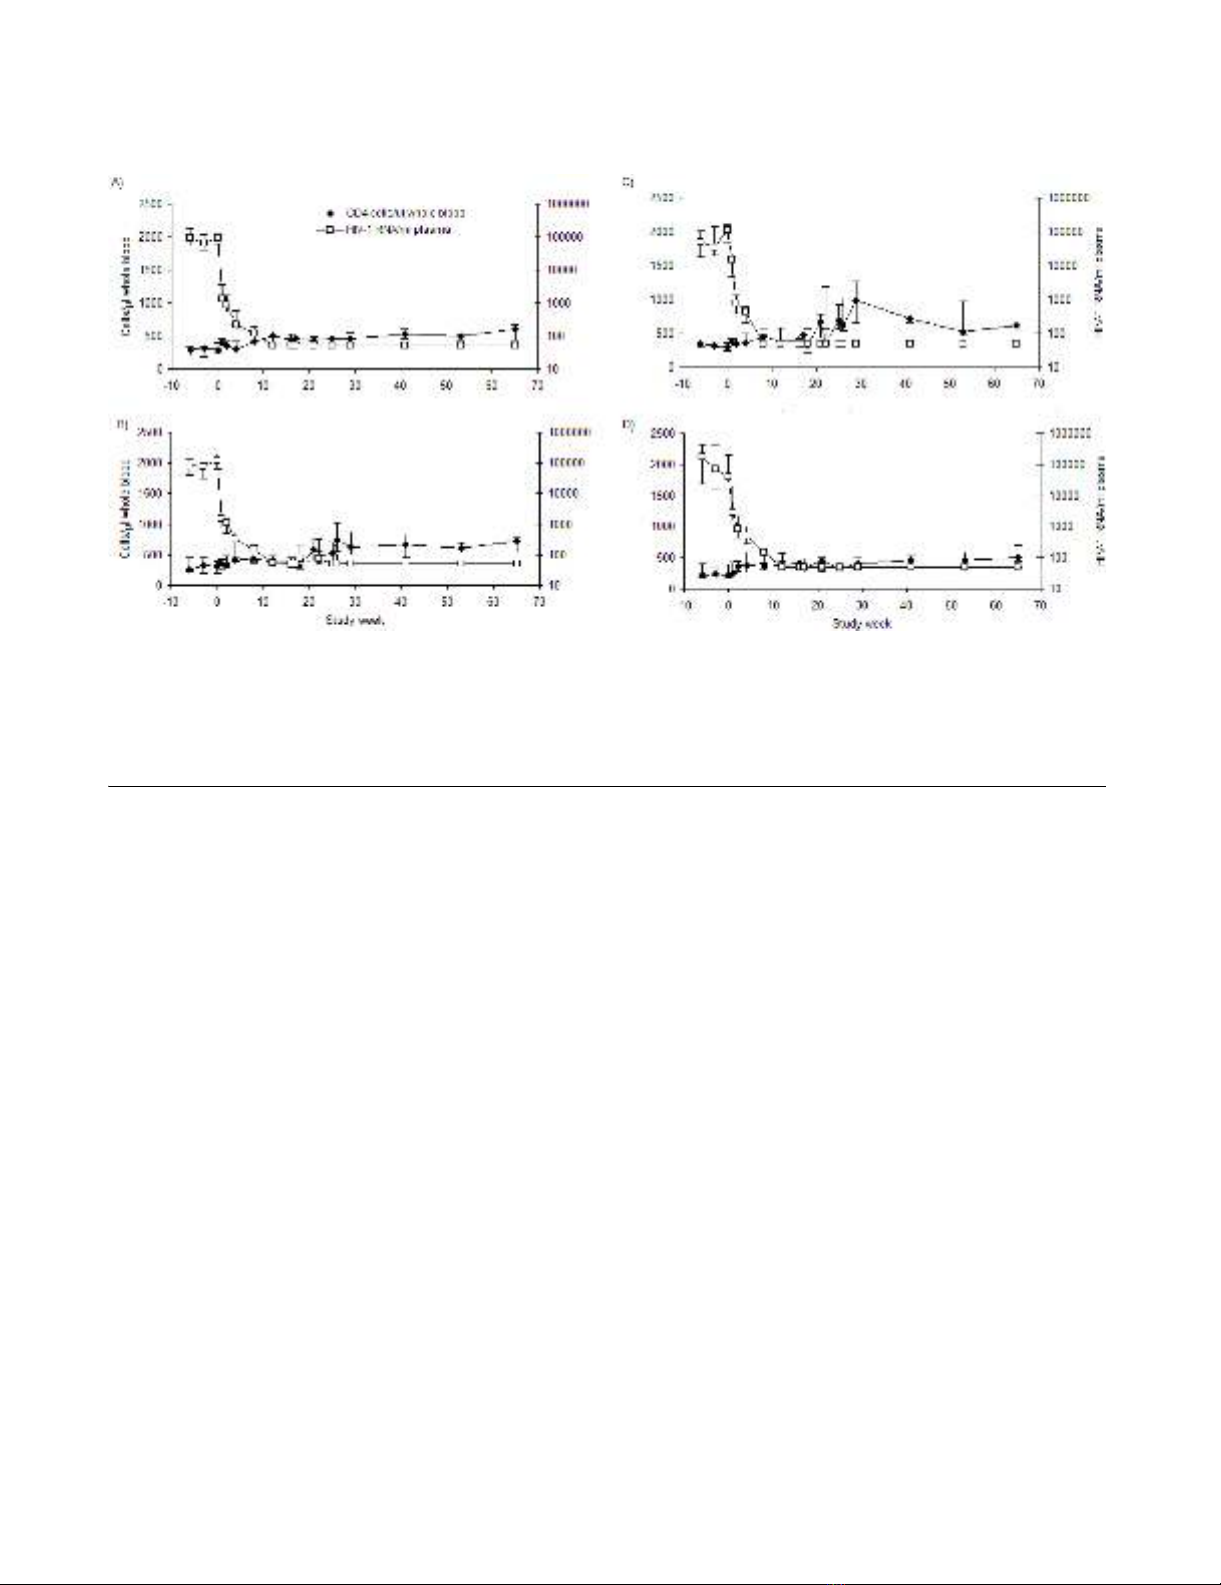
Viral loads and CD4 T-cell counts
Median viral loads and CD4 T-cell counts for each group
are depicted in Figure 1. The median week 0 viral load for
all patients was 88,699 copies/ml plasma (range 50–
779,254). The median absolute CD4 T-cell count was 294
cells/µl whole blood (range 76–551). Nineteen of 36
patients (53%) had CD4 T-cell counts below 300 cells/µl
blood at pre-ART time points.
By week 17 the median viral load in all groups was less
than 50 copies. All patients, except 5 (one in Group A,
three in Group B, one in group D), maintained viral sup-
pression at the main study time points from week 17
onwards while receiving ongoing ART. One patient in
Group C (patient 11) elected to discontinue ART at week
47 causing subsequent rebound in viraemia. At week 17
the median CD4 T-cell count in each complete group was
as follows: Group A, 456 cells/µl (range 261–673) (Figure
1A); Group B, 377 cells/µl (range 81–742) (Figure 1B);
Group C, 468 cells/µl (range 306–680) (Figure 1C);
Group D, 337 cells/µl (range 289–702) (Figure 1D). IL-2-
induced increases in absolute CD4 T-cell counts are also
apparent in groups B and C. By week 65 these values were
602 cells/µl (range 300–918) for Group A, 731 cells/µl
(range 253–1025) for Group B, 619 cells/µl (range 358–
1404) for Group C and 505 cells/µl (range 345–768) for
Group D.
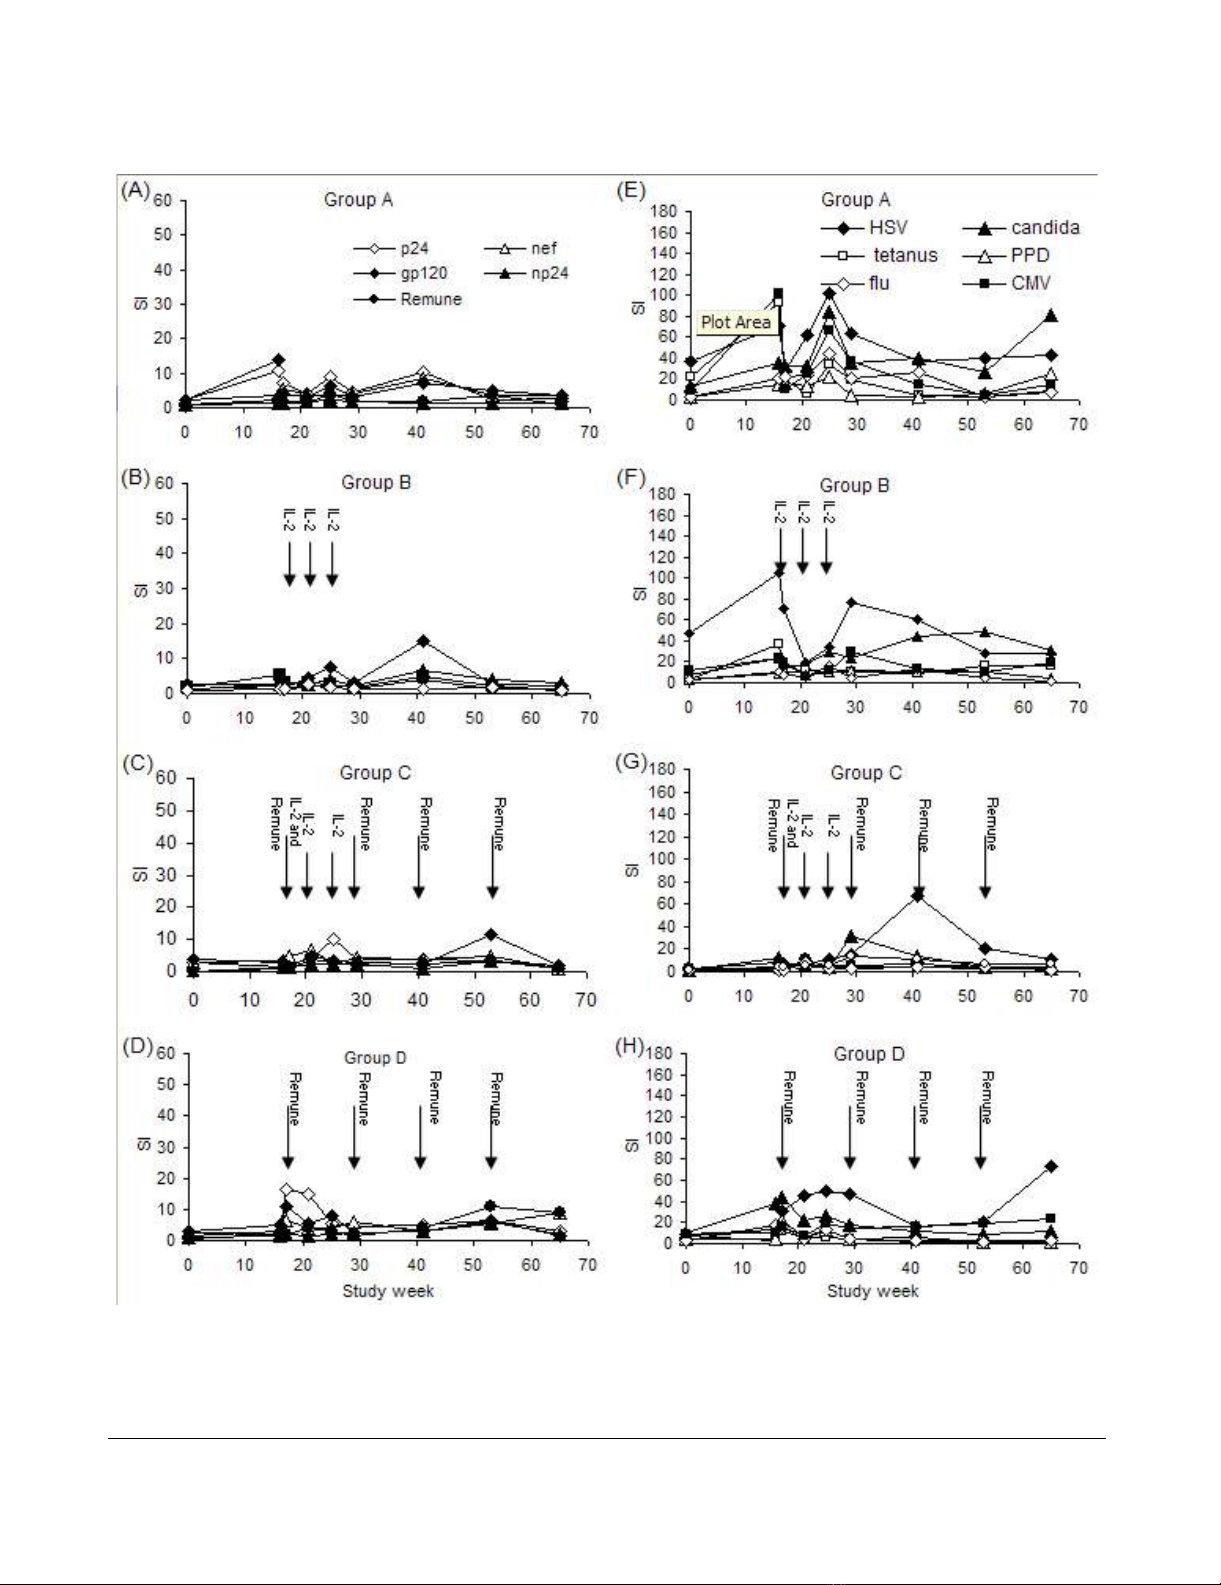
Lymphocyte proliferation to HIV-1 antigens
HIV-1-specific proliferative responses increased tran-
siently for many patients. Regression analysis of these
responses revealed no significant changes in group A (Fig.
2A). In group-B from week 0 to 65 a significant increase in
Journal of Immune Based Therapies and Vaccines 2007, 5:6 http://www.jibtherapies.com/content/5/1/6
Page 4 of 12
(page number not for citation purposes)
the np24 response (p = 0.005) was observed (Fig. 2B). In
group C no increase in HIV-1-specific proliferative
responses were seen (Fig. 2C). Of note was an outstanding
response to Remune™ with an SI of 95 at week 65 for
patient 11 in this group (data not shown) coincident with
rebound viraemia (152,536 copies/ml) following self-
imposed ART discontinuation. In group D a positive
regression was seen in responses to Nef (p = 0.004) and
whole Remune™ antigen (p = 0.005) from week 0 to 65.
(Fig. 2D). The only response which significantly increased
between week 17 and 65 in any group was the p24
response in group D (p = 0.039). Patient 8 in this group
demonstrated a very large response to Remune™ (SI =
261) and np24 (SI = 144) at week 29 following break-
through of resistant virus at week 25 (6,315 copies/ml)
(data not shown). No other substantial increases in
responses occurred between week 17 and 65 for any group
or at any time point between the groups.
In vivo delayed type hypersensitivity reactions to
Remune™
Induration size of hypersensitivity reactions to Remune™
did not become positive (>9 mm diameter) in any patient
at any of the time points tested (weeks 17, 29 and 53).
Lymphocyte proliferation to recall antigens
Baseline to week 16 T-cell responses have been described
in detail previously [1]. Regression analysis revealed sig-
nificant increases in recall responses in all groups between
week 0 and 65 (Fig. 2E–H), predominantly for the persist-
ent recall antigens: For group A (Figure 2E) responses to
CMV and Candida significantly increased (p = 0.027 and
p = 0.006 respectively); for group B (Figure 2F) HSV
responses significantly increased (p = 0.007), CMV
responses increased p = 0.002 and Candida responses
increased (p = 0.0006); in group C (Figure 2G) CMV and
Candida responses increased (p = 0.002 and p = 0.007
respectively); in group D (Figure 2H) HSV and CMV
responses significantly increased (p = 0.002 and p =
0.001). Responses to transient antigens were less apparent.
In group A PPD and tetanus responses showed significant
positive regressions over the 65 weeks (p = 0.018 and p =
0.018 respectively); in group B only the PPD response
regression curve was significant (p = 0.044); and in group
C only the tetanus response was significant (p = 0.0003).
There were no significant differences in recall responses
between treatment groups.
HIV-1-specific IL-4 production
Antigen-specific IL-4 production may be associated with
suppression of proliferative responses and dampening of
inflammatory immune responses. Therefore we measured
Median absolute CD4 T-cell counts per µl of whole blood (closed diamonds) and median HIV-1 RNA viral load per ml of plasma (open squares) with 1st and 3rd interquartile ranges over the entire study period for group A (A), group B (B), group C (C), and group D (D)Figure 1
Median absolute CD4 T-cell counts per µl of whole blood (closed diamonds) and median HIV-1 RNA viral load per ml of
plasma (open squares) with 1st and 3rd interquartile ranges over the entire study period for group A (A), group B (B), group C
(C), and group D (D). A subset of patients were assessed for viral load and CD4 T-cell counts at day 5 of each IL-2 cycle in
groups B and C. Results are shown for all patients. Elevations in viral loads occurred more often in viral loads of patients
receiving ART and IL-2 without Remune™ (group B), than in patients receiving ART and IL-2 with Remune™ (group C).
Journal of Immune Based Therapies and Vaccines 2007, 5:6 http://www.jibtherapies.com/content/5/1/6
Page 5 of 12
(page number not for citation purposes)
Mean HIV-1-specific lymphocyte proliferative responses (left-hand panel) with the times of IL-2 and Remune™ administration, showing responses for group A (A), group B (B), group C (C) and group D (D) and mean recall-specific lymphocyte prolifera-tive responses (right-hand panel) with the times of IL-2 and Remune™ administration, for group A (E), group B (F), group C (G) and group D (H)Figure 2
Mean HIV-1-specific lymphocyte proliferative responses (left-hand panel) with the times of IL-2 and Remune™ administration,
showing responses for group A (A), group B (B), group C (C) and group D (D) and mean recall-specific lymphocyte prolifera-
tive responses (right-hand panel) with the times of IL-2 and Remune™ administration, for group A (E), group B (F), group C
(G) and group D (H). The scale of HIV-1-specific responses is displayed as half the magnitude of that for recall responses.


![Vaccine và ứng dụng: Bài tiểu luận [chuẩn SEO]](https://cdn.tailieu.vn/images/document/thumbnail/2016/20160519/3008140018/135x160/652005293.jpg)


