JOURNAL OF FOREST SCIENCE, 57, 2011 (5): 185–191
Specifi cation of the beechwood soil environment based on chosen soil properties, aiming at the Fageta paupera habitat
A. K1, K. R1, P. D1, K. M1, P. S2, J. S1
1Faculty of Forestry and Wood Technology, Mendel University in Brno, Brno, Czech Republic 2Forest Management Institute, Brandýs nad Labem, Czech Republic
ABSTRACT: This paper deals with a specific type of homogeneous beechwood called Fageta paupera. The aim is to acquire information about the heterogeneity of soil environment. As a material we used 20 research plots of semi-natural European beech stands, where the sampling of soil profile and the observation of floristic conditions were realized. Laboratory assessment of soil samples was focused on physicochemical and chemical properties of soil: pH/CaCl2, K+, Ca2+, Mg2+, CEC (T, S, V), Cox, Nt, C/N, C-FA, C-HA, C-CHL, C-HA/FA. Data processing was done with the aim to discover a variability of soils, observing soil genetic horizons individually (H, A, B, C). Research plots were divided into biotopes with the cover of understory vegetation < 15% and > 15% (in accordance with the definition of Fageta paupera) and the variability of soil properties in each horizon for the two above-mentioned biotopes and furthermore for all plots together was investigated. Results show the highest variability of soil properties in the biotope of Fageta paupera, especially in its holorganic (H) and organomineral (A) horizons. Furthermore, regression analysis showed the strongest dependence of the variability of soil properties in the biotope of Fageta paupera.
Keywords: Fageta paupera; soil; variability of soil properties
communities are presently better known in theo- ries than in facts based on original data of research (K 2009), especially results of soil investiga- tions are relatively scarce.
Th is article disserts on the European beech in relation to a forest habitat, which on the one hand means natural conditions and, on the other hand, the habitat is highly infl uenced by present vegetation.
European beech (Fagus sylvatica L.) belongs to tree species with the complicated creation of for- est communities. One of several factors causing this fact is the wide ecological valence of condi- tions in which beech is able to grow and a high aptitude of competition. Naturally, it is not domi- nating vert over all forest area of its widespread. Despite of that, in conditions of Central Europe, it is an abundant species with a high ecological potential and it exceeds other autochthonous spe- cies. Furthermore, in supraoptimal conditions it creates homogeneous ecosystems, wherein it rep- resents almost 100% species and in many cases, ecosystems of Fageta paupera (B, L 2002) or also Fagetum nudum (E 1996; C et al. 2001) communities. Th ese forest coenoses are defi ned as beechwood, where the un- derstory vegetation does not cover more than 15% of the soil surface. Causes of the formation of such
In comparison with many deciduous species the beech infl uences humic conditions less posi- tively (G, M 2005) but along with other species it can preserve and ameliorate the good quality of forest fl oor. So although beech litter represents the material with a high amount of nutrients, beech alone tends to degrade humus forms from mull towards moder. Another study (F et al. 2009) reported a signifi cant infl u- ence of management and species composition on
Supported by the Ministry of Education, Youth and Sports of the Czech Republic, Project No. MSM 6215648902.
185
J. FOR. SCI., 57, 2011 (5): 185–191
topes (a) and (b) to describe the stability and vari- ability of soil properties in the observed soil genetic horizons.
the forest fl oor, when the quality of observed soil properties (humus reserves and forms, pH, Cox, Nt and C/N) increased from spruce to beech forest.
MATERIAL AND METHODS
Vegetation by itself is a signifi cant eco-indica- tor of edaphic conditions. Based on the observa- tion of phytocoenoses, the soil environment can be described. As a typical example we can cite the specifi cation of groups of types of geobiocoenoses using soil acidity, base saturation and C/N ratio. Th e relationship between vegetation and soil char- acteristics, and/or humus forms, can be defi ned by observing the process of decomposition, pedo- chemical properties and presence of plant com- munities (K et al. 1990). Another question is when the understory vegetation is absent, like in the case of Fageta paupera.
For the assessment, 20 research plots were se- lected in all homogeneous beech stands at the stage of mature stands. Basic characteristics are shown in Table 1. Th ese habitats were classifi ed on the basis of the geobiocoenological classifi ca- tion system, which defi nes Fageta paupera infe- riora 3 AB-B(BC) 3 and Fageta paupera superiora 4 AB-B(BC) 3. Th ese semi-natural European beech stands are situated in small-scale preserved areas, i.e. in the areas with a special statute of protection (S et al. 2004) as a part of Natura 2000 Net- work (C et al. 2001).
Using a single soil property, the description of Fageta paupera is very complicated. To describe soils of Fageta paupera, in this study soil properties are used as the indicator of stability or variability of soil environment from two aspects: fi rstly, for a comparison of soils with herb cover densities < 15% and > 15%; secondly, for a comparison of present soil horizons in each type of biotope.
On each research plot, a soil pit was dug to de- scribe the soil profi le and to determine the soil unit (N et al. 2001), classifi ed also in accordance with the World Reference Base (WRB 2006), used also in Table 1. Samples were taken from each soil genetic horizon. In accordance with the classifi ca- tion of Domin scale (M et al. 1994), the den- sity of understory vegetation cover was classifi ed.
Haplic Cambisols are the most abundant soil type while Luvisols, Podzosols and Leptosols are less frequent; as forest fl oor, humus types of typical moder and mull moder are the most abundant.
Changes of soil properties with depth are typical of the soil environment in general (B, W 2002; W 2006). Although the beech belongs to the species of scientists’ interest, the variability of the soil profi le environment in natural conditions is not assessed so much and furthermore it is little known (C et al. 2006; V et al. 2010), especially when we talk about a concrete stand type.
In this contribution, the soil environment is solved from a more complex point of view, using soil properties such as pH/CaCl2, exchangeable macro-bioelement (K+, Ca2+, Mg2+) content, soil ad- sorption characteristics (T, S, V), soil carbon (Cox) and nitrogen (Nt) and C/N ratio and characteristics of humic substances (C-HK, F-FK, C-CHL, C-HK/ FK). Such soil conditions are used to express a mea- sure of invariability of soil properties, along the soil profi le, for the stands of homogeneous beech for- ests (BF), more narrowly specifi ed as a beechwood with the understory vegetation cover < 15% (FP) and a beechwood with the understory vegetation cover > 15% (BV).
Laboratory analyses were focused on the assess- ment of physicochemical and chemical properties of soil: pH/CaCl2 was assessed in 0.01M solution of CaCl2 at the soil to solution ratio 1:2.5; nutri- ent (K+, Ca2+, Mg2+) content in Mehlich 3 solution (Z 2002); H+ ion content by the method of double measuring (A, E 1962); cation exchange capacity (CEC) was computed by the ac- cumulative method; Cox was assessed by the oxida- tion of organic substances by chromsulphuric acid in wet medium (W, B 1934) by the oxidative-volumetric method; Nt was assessed by the method ISE (with ion-selective electrodes us- ing a calibration curve in accordance with ISO 11 261 (R 1999)); content of humus substances was assessed in accordance with K and B (1961).
Concrete aims of this study are: based on fi eld observations, laboratory and statistical analyses of 20 research plots (1) to determinate the variability of soil properties in each soil genetic horizon for all 20 plots; (2) these plots are divided into biotopes of (a) FP (9 plots of 20) and (b) BV (11 plots of 20) – so the general specifi cations of point (1) apply to bio-
Data processing was done with the accent on as- sessing the variability of soil properties in each soil horizon to be able to deduce the heterogeneity of environments of selected stand types. To achieve the aims, data were organized (a) according to soil horizons: holorganic H horizon; organomineral A
186
J. FOR. SCI., 57, 2011 (5): 185–191
Table 1. Research plots where the research was realised
Name of research plot PLO Groups of types of geobiocoenoses Soil unit Humus form Type of habitat
6 AB 3 (Abieti-Fageta piceae) BV haplic Cambisols 27 moder Bučina pod Františkovou myslivnou
BV 3 BC 3 (Qureci-Fageta aceris) luvic Cambisols Bukoveček I 37 moder
FP 3 AB-B(BC) 3 (Fageta paupera inferiora) haplic Luvisols Bukoveček II 37 moder
FP 4 AB-B(BC) 3 (Fageta paupera superiora) rubic Luvisols Býčí skála 30 moder
BV 5 BC 3 (Abieti-Fageta aceria inferiora) lithic entic Podzols Čantoria 40 moder
BV 6 A-AB 2v (Abieti-Fageta piceae humilis) haplic Podzols Čerňavina 40 mor
BV 3 BC 3 (Qureci-Fageta aceris) stagnic Luvisols Dvorčák 37 moder
FP Habrůvecká bučina 4 AB-B(BC) 3 (Fageta paupera superiora) luvic Cambisols 30 moder
BV 4 AB 3 (Fageta abietino-quercina) haplic Cambisols Javorový 40 moder
BV 5 BC 3 (Abieti-Fageta aceria inferiora) lithic Cambisols Jelení bučina 27 moder
FP Mazázký Grůnik 4 AB-B(BC) 3 (Fageta paupera superiora) luvic cambisols 40 moder
FP 4 AB-B(BC) 3 (Fageta paupera superiora) dystric Cambisols Mrhatina 16 moder
FP 4 AB-B(BC) 3 (Fageta paupera superiora) luvic Cambisols Rakovec 30 moder
BV 5 B 3 (Abieti-Fageta typica) haplic Cambisols Razula 41 moder
FP 4 AB-B(BC) 3 (Fageta paupera superiora) haplic Cambisols Salajka 40 moder
FP 4 AB-B(BC) 3 (Fageta paupera superiora) stagnic Cambisols Sidonie 38 moder
FP 4 AB-B(BC) 3 (Fageta paupera superiora) lithic Cambisols Skalka 40 moder
BV 5 B 3 (Abieti-Fageta typica) entic Podzols Smrk 40 moder
BV 30 Vývěry Punkvy 3 BD 3 (Querci-Fageta Tiliae) cambic rendzic Leptosols moder
FP – Fageta paupera; BV – beechwood with understory vegetation
Partial task (2) (heterogeneity of soils in FP and in BV) was realized in the same way but a diff erent analysis was used. For the assessment of confi dence intervals for each property in each horizon, data set has a small size of statistical samples (9 values in FP and 11 values in BV). In this case, a robust meth- odology for the estimation of reference intervals for data sets with small numbers of observations (so called Horn analysis) (H et al. 1998) was used. Th e second part of assessment was analogical with task (1): for each soil horizon, sizes of confi - dence intervals of all assessed soil properties were grouped and these data were used for ANOVA, which renders information about the variability of the analogue composition of soil properties in each soil horizon, it means one arithmetical mean and limits of confi dence interval for each horizon in FP and in BV.
To acquire information about a signifi cant distinc- tion of variability among soil horizons, all three sta- tistical samples (BF, FP, BV) were tested by Tukey’s
horizon; metamorphic B horizon; parent weather- ing material – C horizon; (b) according to observed stand types (Beech Forest – BF; Fageta paupera – FP; Beechwood with understory vegetation – BV). Because statistical data have a character of mul- tivariate values, measured data were autoscaled us- ing the formula yj = (xj – xj )/sj, where xj = measured value in statistical sample; xj = arithmetic mean of original statistical sample; sj = standard devia- tion. Partial task (1) (heterogeneity of soils in beech- wood ‒ BF) was assessed by one-way ANOVA in Sta- tistica 9.0. Th is analysis provides information about the limits of confi dence intervals ± 95% (signifi cance level α = 0.05) for each soil property in each considered soil horizon. For each soil horizon, sizes of confi dence intervals of all assessed soil properties were grouped and these data were used for a new ANOVA. Results from the analysis provide information about the vari- ability of the analogue composition of soil properties in each soil horizon, it means one arithmetical mean and limits of confi dence interval for each horizon.
BV 16 Žákova hora dystric Cambisols moder 5 B 3 (Abieti-Fageta typica)
187
J. FOR. SCI., 57, 2011 (5): 185–191
Table 3. Multiple comparisons (Tukey’s HSD test) for the statistical sample BF (beech forest) (P = 0.05)
range test of multiple comparisons. To complete the information about the dependence of soil properties on soil depth, each stand type was tested by a regres- sion analysis in MS Excel 2003 to get the R2 value.
H A B C
0.020227 0.000159 0.000164 H
0.020227 0.000159 0.089639 A
RESULTS
0.000159 0.000159 0.003533 B
C 0.000164 0.089639 0.003533
Table 2. Confi dence intervals of ANOVA for the entire statistical sample of 20 plots (BF). Results in this table show variability of soil properties in each soil horizon
Soil horizons Soil property H A C B
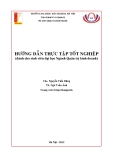
Confi dence intervals of ANOVA for the entire statistical sample of 20 plots (BF) are shown in Ta- ble 2. Results from the second part of the analysis of BF are documented in Fig. 1. It shows the variability of soil properties in each soil horizon, where X-axis represents variability and Y-axis compared soil ho- rizons. From the graph (Fig. 1) and from Table 3 it is evident that ANOVA rejects the null hypothesis and the sets are signifi cantly diff erent. Variability is the highest in H horizon and the lowest in B hori- zon, multiple comparisons show the agreement of variability just between horizons A and C, where the null hypothesis is closely non-rejected.
pH/KCl 1.2679 1.1690 0.9708 1.0901
0.9869 0.9099 0.7556 0.8485 K+
Ca2+ 0.9869 0.9099 0.7556 0.8485
0.9869 0.9099 0.7556 0.8485 Mg2+
1.0312 0.9507 0.7895 0.8866 H+
1.1591 1.0686 0.8874 0.9965 CEC
0.9869 0.9099 0.7556 0.8485 S
1.0085 0.9298 0.7722 0.8670 V
For FP and BV, confi dence intervals of Horn analy- sis are shown in Table 4. ANOVA testing the groups of properties for each horizon and stand type shows signifi cant variability in horizons H and A in FP; horizons do not reject the null hypothesis. Results show facilitation of research plot diversifi cation in FP and BV to determine that the soils of Fageta pau- pera are mostly the cause of large diff erences and that they are characterized by high heterogeneity of the soil environment, especially in top soil.
0.9869 0.9099 0.7556 0.8485
0.9869 0.9099 0.7556 0.8485
0.9869 0.9099 0.7556 0.8485 Cox Nt C/N
0.9869 0.9099 0.7556 0.8485 C-HK
0.9869 0.9099 0.7556 0.8485 C-FA
C-CHL 0.9869 0.9099 0.7556 0.8485
Table 5 shows the highest dependence of vari- ability of soil properties with depth in the case of FP; the statistical sample BV is the most indiff er- ent among the tested sets. Its separation seems to enable to show the extremity of the depth gradi- ent in Fageta paupera; the statistical sample BF is logically situated by its value of R2 between the two specifi ed stand types.
C-HA/FA 0.9869 0.9099 0.7556 0.8485
DISCUSSION
H
A
s n o z i r o h
B
l i o S
C
Th e fi rst point is a diff erent method of statistical assessment of BF contrary to FP and BV. Th e reason is a small size of FP and BV sets and slight invalida- tion of normality contrary to an optimal size of BF, when ANOVA can be used. Furthermore, the data are valuable for the observation of trends in the soil profi le and those tendencies are comparably shown in the regression results.
0.70 0.75 0.80 0.85 0.90 0.95 1.00 1.05 1.10 Variability of soil properties
Fig. 1. Results of ANOVA with 0.95 confi dence intervals for entire statistical sample of 20 plots (BF)
One of the important points is also that in the spectrum of used soil properties physical proper- ties are absent. Th e reason is that for H horizon, the analysis of physical ring or texture is not possible,
188
J. FOR. SCI., 57, 2011 (5): 185–191
Table 4. Confi dence intervals of Horn analysis for the statistical samples FP and BV. Results in this table show vari- ability of soil properties in each soil horizon of each type of biotope
Type of biotope/Soil horizons Soil property BV/H FP/A BV/A FP/B BV/B FP/C BV/C FP/H
0.8496 3.6167 0.5434 0.6527 0.6046 4.8226 0.3982 4.7581
pH/CaCl2 K+ 1.1966 1.5131 0.9475 1.1854 1.1756 2.1235 1.6771 3.1038
0.5647 2.6562 0.5561 0.4077 0.2279 1.1930 0.2630 3.7239 Ca2+
Mg2+ 2.7105 3.9874 2.2564 1.5768 1.0731 2.5288 0.6756 3.8796
3.2639 3.6577 2.1752 1.0477 2.1519 2.3854 2.5214 5.0735 H+
CEC 10.1499 3.9841 3.9130 1.0402 1.7731 0.7083 1.1996 0.6485
S 0.5744 2.7847 0.6762 0.2815 0.3232 1.2591 0.4424 4.4000
V 2.1240 4.2299 1.1760 1.0466 0.8078 2.4106 1.1862 5.8764
1.1405 4.7628 1.7383 1.4793 0.9407 2.2527 1.9911 4.1084
2.4899 3.8726 1.3598 1.0228 1.1275 1.7343 1.4104 3.7950
Cox Nt C/N 0.9781 4.0234 2.3415 0.6327 1.7878 1.9131 2.0654 3.4284
C-HA 2.2201 4.6223 0.7711 0.6069 1.4157 1.7469 1.9377 3.3791
C-FA 2.9402 2.7347 1.9762 0.8872 1.6246 1.4493 2.0059 2.0334
C-CHL 2.5634 3.1209 1.2448 0.6896 1.4444 1.5296 2.0904 1.9908
FP – Fageta paupera; BV – beechwood with understory vegetation
so for the equivalent number of compared proper- ties in each horizon we used properties observable in the entire soil profi le.
tire profi le are more variable in soil properties than BV – in FP: H0 is non-rejected relatively “closely” in comparison with B and C horizons (P = 0.0939) while in BV the P-value in Table 6 are higher in most cases than the critical value (P = 0.05).
Results show that in the zones of subsoil, beech- wood soils are generally uniform in the soil proper- ties while in the rhizosphere the diversifi cation of soil properties can be observed.
Th e unanswered question is if the diff erence in top soil between FP and BV is caused by understory vegetation and the rest of phytocoenosis contribut- ing to the formation of the soil environment or on the contrary, the absence or presence of herbs on the soil surface is primarily caused by the specifi c- ity of the soil environment.
After summarization of the computed values it is evident that the soils of Fageta paupera in the en-
A signifi cant gradient of variability in soil proper- ties within the soil profi le is also evident from the regression analysis (Table 5). ANOVA also shows a signifi cant variability in all three assessed cases. Variability is strictly dependent on soil depth and it decreases towards the base of regolith. Comparing with literature, the infl uence of soil depth as a pre- diction factor for the constancy of soil environment was assessed in the permeability of soil for rain water (J, P 2008). Contrary to this study, the soil depth was not found to be a signifi cant factor.
C-HA/FA 2.0776 4.1406 1.0118 1.4150 1.0545 1.5420 1.7241 4.1115
Table 5. Results of regression analysis
R2 Type of biotope
BF 0.395
FP 0.600
BF – entire statistical sample of beech forest; FP – Fageta paupera; BV – beechwood with understory vegetation
On the contrary, the character of the ecosystem aboveground part of soil was observed for the com- parison with physicochemical properties of for- est fl oor (P 2006) in beech forests with closed canopy, compared with the character of forest fl oor under canopy gaps. Th eir conclusion showed an acceleration of decomposition (reduction of hu- mus layer thickness, increase of pH, V and CEC and number of nutrients), consequently amelioration of conditions for seedlings. Such a situation could
BV 0.258
189
J. FOR. SCI., 57, 2011 (5): 185–191
Table 6. Multiple comparisons (Tukey’s HSD test) of variability of soil properties for the statistical samples FP and BV (P = 0.05)
Type of biotope/Soil horizons Type of biotope/ Soil horizons FP/H BV/H FP/A BV/A FP/B BV/B FP/C BV/C
FP/H 0.0001 0.5651 0.0001 0.0001 0.0001 0.0001 0.0001
BV/H 0.0001 0.0007 0.6043 0.1130 0.2306 1.0000 0.7498
FP/A 0.5651 0.0007 0.0001 0.0001 0.0001 0.0008 0.0001
BV/A 0.0001 0.6043 0.0001 0.9808 0.9986 0.5526 1.0000
FP/B 0.0001 0.1130 0.0001 0.9808 1.0000 0.0939 0.9382
BV/B 0.0001 0.2306 0.0001 0.9986 1.0000 0.1974 0.9900
FP/C 0.0001 1.0000 0.0008 0.5526 0.0939 0.1974 0.7028
FP – Fageta paupera; BV – beechwood with understory vegetation
BV/C 0.0001 0.7498 0.0001 1.0000 0.9382 0.9900 0.7028
R e f e r e n c e s
A F., E C.E. (1962): A rapid method for measuring lime requirement of red-yellow podzolic soils. Soil Science Society of America Journal: 355–357.
B N.,W R. (2002): Th e Nature and Properties of Soil.
Upper Saddle River, Prentice Hall: 960.
B A., L J. (2002): Gebiocenology II. [Textbook.]
lead to the conclusion that the soil environment is non-changeable when the aboveground soil is ho- mogeneous. Th ese results demonstrate that vegeta- tion can be absent in more cases of the soil specifi c- ity than it can be present. On the basis of this work project we can conclude that the causation does not lie in the presence of a concrete soil property, but in the heterogeneity of soils in general.
Brno, MZLU: 249. (in Czech)
CONCLUSION
C E., E Z.,M J., H V. (2006): Forest topsoil organic carbon content in Southwest Bohe- mia region. Journal of Forest Science, 52: 387–398.
E H. (1996): Vegetation Mitteleuropas mit den Alpen in Ökologischer, Dynamischer und Historischer Sicht. Stuttgart, Ulmer: 623.
F T., M L., T I., K J. (2009): Eff ects of spruce, beech and mixed commercial stand on humus conditions of forest soils. Systems Biology, 32: 119–126.
Th is contribution deals with a topic of the soil en- vironment in beech forest stands, focused on the specifi c biotope Fageta paupera. As a feature for soil assessment, soil conditions are used to explain the stability of soil environment or the measure of homogeneity of soil conditions within the entire soil profi le. Results of this study show a high vari- ability of soils in the specifi c beechwood ecosystem Fageta paupera, compared with a beechwood with understory vegetation cover > 15%.
G S., M W., K N. (2005): Variation in the herb species response and the humus quality across a 200-year chronosequence of beech and oak plantations in Belgium. Ecography, 28: 223–235.
H P.S., P A.J., C B.E. (1998): A robust approach to reference interval estimation and evaluation. Clinical Chemistry, 44: 622–631.
Th is study does not provide any information about the specifi c causation defi ning soils of Fageta paupera, on the contrary, the contribution to the knowledge of this ecosystem is in the determina- tion of complicated soil environment, compared with the monotonously and “uncomplicatedly” looking forest aboveground part of soil.
C M., K T., K M. 2001: Catalogue of Biotopes of the Czech Republic. Praha, AOPK ČR: 307. (in Czech) J R., P J. (2008): Amounts of throughfall and lysimetric water in a sub-mountain beech forest in the Kremnické vrchy Mts. (West Carpathian Mts., Slovakia). Sciences-New York, 54: 207–211.
K K.,W Q.,C R.E. (1990): Relationships among humus forms, forest fl oor nutrient properties, and understory vegetation. Forest Science, 36: 564–581.
Further activities should lead to the assessment of nearly holorganic and organomineral horizons, to determination of soil properties which are “re- sponsible” for high variability or of stable proper- ties conditioning the creation of the Fageta pau- pera ecosystem.
190
J. FOR. SCI., 57, 2011 (5): 185–191
in Specially Protected Areas (Methods.) Brno, MZLU: 60. (in Czech)
K M.M., B N.P. (1961): Rapid methods for obtaining of humus content in mineral soils. Počvoveděnie, 10: 75–87. (in Russian)
V T., P J., MB A., D J. (2010): Spatial variability of soil horizon depth in natural loess-derived soils. Geoderma, 157: 37–45.
K A. (2009): Case study, assessing the type of forest ecosystem Fageta paupera, realised on the part of study area of Alois Zlatník n. 6 in research area group Javornik. In: H V., Š J. (eds): Geobiocenology and its Application in the Landscape. Papers of Geobiocenology. Vol. 13. Brno, MZLU: 70–77.
W A., B I.A. (1934): An examination of the Detjareff method for determinating soil organic matter and a proposed modifi cation of the chromic acid titration method. Soil Science, 37: 29–38.
M J. (1994): Phytocenology. Praha, Academia: 403.
(in Czech)
N J.E. (2001): Taxonomical Classifi cal System of Soil
of the Czech Republic. Praha, ČZU: 78. (in Czech)
W R.E. (2006): Principles and Practice of Soil Science: the Soil as a Natural Resource. Oxford, Blackwell: 363. WRB (2006): World Reference Base for Soil Resources. A Framework for International Classifi cation, Corelation and Communcation. Roma, FAO/ISRIC/ISSS: 128.
Z J. (2002): Soil Analysis I. Method Operations. Brno,
P V.V. (2006): Changes in humus forms in gaps of the canopy of semi-natural beech stand. Journal of Forest Science, 52: 243–248.
ÚKZÚZ: 197. (in Czech)
R K. (1999): Forest Pedology-Practice. Brno, MZLU:
152. (in Czech)
Received for publication July 2, 2010 Accepted after corrections January 5, 2011
S J., V S., B A. (2004): Rating of Risk Resulting from Assertion of the Production Function of the Forest
Corresponding author: Ing. A K, Mendel University in Brno, Faculty of Forestry and Wood Technology, Department of Geology and Pedology, Zemědělská 3, 613 00 Brno, Czech Republic e-mail: ala.coutchera@gmail.com
191
J. FOR. SCI., 57, 2011 (5): 185–191