
CAN THO JOURNAL OF SCIENCE AND TECHNOLOGY - No.05 February, 2025
14
EFFECT OF CALCINATION TEMPERATURE AND DOPING IONS
CONCENTRATION ON OPTICAL PROPERTIES OF YPO4:Tb3+
Ngo Quoc Luan
1
, Le Thi Thao
2
, Nguyen Dang Hoa Nghiêm
2
, Chung Dieu Nga
3
,
and Ngo Khac Khong Minh
2
1Can Tho University
2Can Tho University of Technology
3Can Tho Technical Economic College
Email: nkkminh@ctuet.edu.vn
ARTICLE INFO
Received: 25/01/2025
Revised: 16/02/2025
Accepted: 18/02/2025
Keywords: Combustion, emission,
luminescence, YPO4:Tb3+
ABSTRACT
The luminescent nanomaterial YPO4:Tb3+ was successfully
synthesized via the combustion method. The crystal structure and
optical properties were analyzed using X-ray diffraction (XRD),
fluorescence excitation spectroscopy, emission spectroscopy, and
lifetime measurements. The synthesized material was single-phase
with a tetragonal crystal structure and an average particle size of
20 - 30 nm. Under 220 nm excitation, these materials exhibited a
strong blue emission corresponding to the 5D4 → 7FJ transitions of
Tb3+, with the 5D4 → 7F5 transition being the most intense. The
optimal synthesis temperature in laboratory conditions was from
800 to 900°C, with the best Tb3+ doping concentration at 7 mol%.
The measured luminescence lifetime of the material was 363 μs.
1. INTRODUCTION
Nanoscience and nanotechnology are
modern interdisciplinary fields that integrate
physics, chemistry, and biology. Over the
years, both globally and in Vietnam, extensive
research has been conducted on nanomaterials
in general and luminescent nanomaterials in
particular. One of the key advantages of nano-
sized luminescent materials is their high
uniformity, strong fluorescence intensity, and
sharp emission lines (Blasse, 1994; Bhushan,
2004). Rare earth ions play a crucial role in
optics due to their strong luminescence, narrow
emission bands, long luminescence lifetime,
and excellent stability (Hung, 2005). In 2020,
Thai Thi Dieu Hien successfully synthesized
GdPO
4
:Tb
3+
, a material that exhibits blue
emission under 273 nm excitation,
corresponding to the
5
D
4
→
7
F
J
transitions of
Tb³⁺, with an optimal doping concentration of
10 mol% (Hien, 2020). Additionally, in 2021,
she investigated YPO
4
:Eu
3+
and demonstrated
that yttrium orthophosphate is a highly suitable
host lattice for rare earth ion doping (Hien,
2021). This suitability arises from its
advantageous physical and chemical
properties, including a broad optical
transparency range, low phonon energy, high
quantum efficiency, strong luminescence when
combined with an orthophosphate host,
excellent thermal and mechanical stability, and
environmental friendliness. Furthermore, the
Y
3+
ion has a similar valence state and ionic
radius to rare earth dopant ions, facilitating
their substitution into the host lattice (Roan,
2009). Due to these advantages, the synthesis
and optical characterization of YPO₄:Tb³⁺ have
attracted significant research interest. Various
synthesis methods have been employed for
fabricating YPO
4
:Tb
3+
, including hydrothermal
synthesis (Ying Yu, 2023), sol-gel processes
(Jinyu Yang, 2016), and solid-state reactions

CAN THO JOURNAL OF SCIENCE AND TECHNOLOGY - No.05 - February, 2025
15
(Weihua Di, 2005). Among these, the
combustion synthesis method is particularly
promising. This technique relies on an
oxidation-reduction reaction between an
oxidizing agent, typically nitrate ions (NO
3-
),
and a reducing agent, commonly an organic
compound containing amino groups (-NH
2
).
The combustion synthesis method offers
several advantages, such as the ability to
produce large quantities of material, the use of
simple equipment, and ease of implementation.
In this study, we synthesized YPO
4
:x%Tb
3+
using the combustion synthesis method and
investigated the effects of annealing
temperature and dopant concentration on the
structural, morphological, and optical
properties of the material.
2. EXPERIMENTAL
Materials
The chemicals used for synthesis
included Y
2
O
3
(Aldrich, 99.99%), Tb
2
O
3
(Aldrich, 99.99%), urea (99%, Merck),
HNO
3
65% (Merck), H
3
PO
4
85% (Merck),
and NH
3
25% (Merck).
Synthesis of YPO
4
:Tb
3+
Y(NO
3
)
3
(0.2M) and Tb(NO
3
)
3
(0.02M)
solutions were prepared by dissolving Y
2
O
3
and Tb
2
O
3
in concentrated HNO
3
. The
required volumes of these solutions,
corresponding to the desired dopant
concentration (Tb
3+
), were measured and
transferred into a becher. The solution was
then evaporated at 70-80°C, with 3 mL of
distilled water added after each evaporation
cycle. After three evaporation cycles, the
resulting metal nitrate mixture was dissolved
in 5 mL of distilled water to obtain a
homogeneous solution. An appropriate
amount of urea was then added, and the
solution was stirred at 50°C for 30 minutes to
obtain solution 1. A mixture of NH
3
and
H
3
PO
4
(in a ratio suitable for the target
composition) was prepared and stirred at 50°C
for 30 minutes, yielding solution 2.
Solution 2 was slowly added to Solution 1
under continuous stirring for 1 hour. The
resulting mixture was evaporated and
subsequently dried at 80°C for 12 hours,
forming a white powder precursor. This
precursor was then annealed at temperatures
ranging from 300°C to 900°C for 1 hour to
obtain the final YPO
4
:x%Tb material.
Characterization
X-ray diffraction patterns were recorded
using a D8 Advance-Bruker diffractometer at
the Faculty of Chemistry, University of
Science (Vietnam National University,
Hanoi). Fluorescence excitation and emission
spectra were measured using a Cary Eclipse
spectrofluorometer, equipped with an 80 Hz
pulsed xenon lamp as the excitation source.
These measurements were conducted at the
Institute of Physics, Vietnam Academy of
Science and Technology (VAST).
3. RESULTS AND DISCUSSIONS
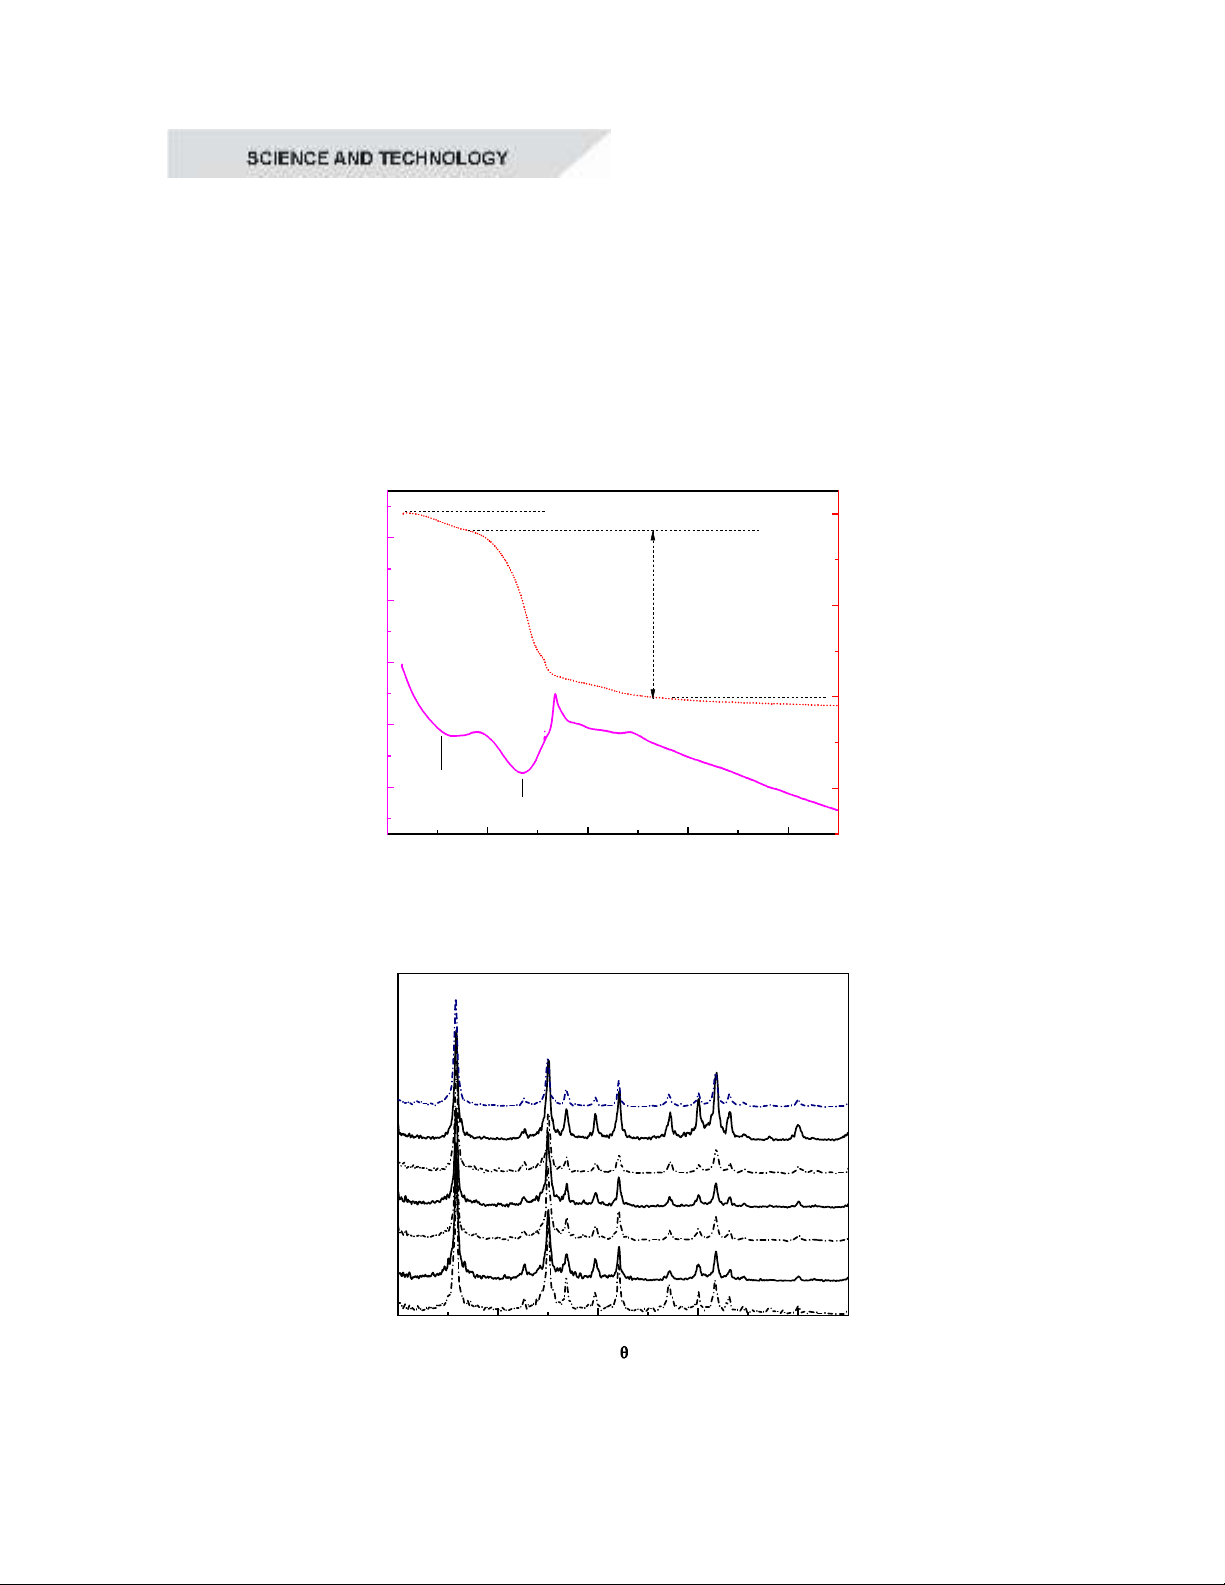
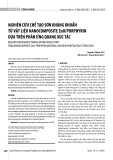
To study thermal behavior, the precursor
sample of YPO
4
:5%Tb
3+
underwent thermal
analysis (DTA and TGA) in an air
environment from room temperature to 800°C
at a heating rate of 10°C/min. The thermal
analysis diagram revealed two main mass loss
stages within the examined temperature range.
The first mass loss occurred between room
temperature and 150°C, amounting to 2.9%.
This loss was accompanied by an endothermic
peak at 91°C, which was attributed to the
evaporation of water. The second mass loss
took place between 150°C and 350°C, with a
significant weight reduction of 55.7%. This
stage was associated with two endothermic
effects at 226°C and 290°C, likely
corresponding to the decomposition of
precursor components. Additionally, an
CAN THO JOURNAL OF SCIENCE AND TECHNOLOGY - No.05 February, 2025
16
exothermic peak at 316°C was observed,
which can be attributed to combustion
reactions involving urea and nitrate radicals.
Beyond 350°C, the mass loss became
negligible, and no further exothermic or
endothermic effects were detected. This
suggested the formation of the crystalline
phase of the material. In the 400-900°C range,
the mass remained nearly constant, indicating
that the material was thermally stable and no
significant chemical reactions occurred in this
stage. Based on these thermal analysis results,
the temperature range of 300–900°C was
selected for further investigation. The
obtained samples will be analyzed for
structural characteristics using X-ray
diffraction (XRD).
0 200 400 600 800
-80
-40
0
40
80
Temperature
(
o
C
)
m= -66,279%
m= -6,097%
317
o
C
265
o
C
109,6
o
C
DTA (mW)
-30
-20
-10
0
TG (mg)
Figure 1. TG/DTA curves of the precursor sample
20 30 40 50 60
2
Intensity (a.u.)
g
f
e
d
c
b
(400)
(312)
(321)
(103)
(301)
(202)
(220)
(112)
(211)
YPO
4
:5%Tb
a
(200)
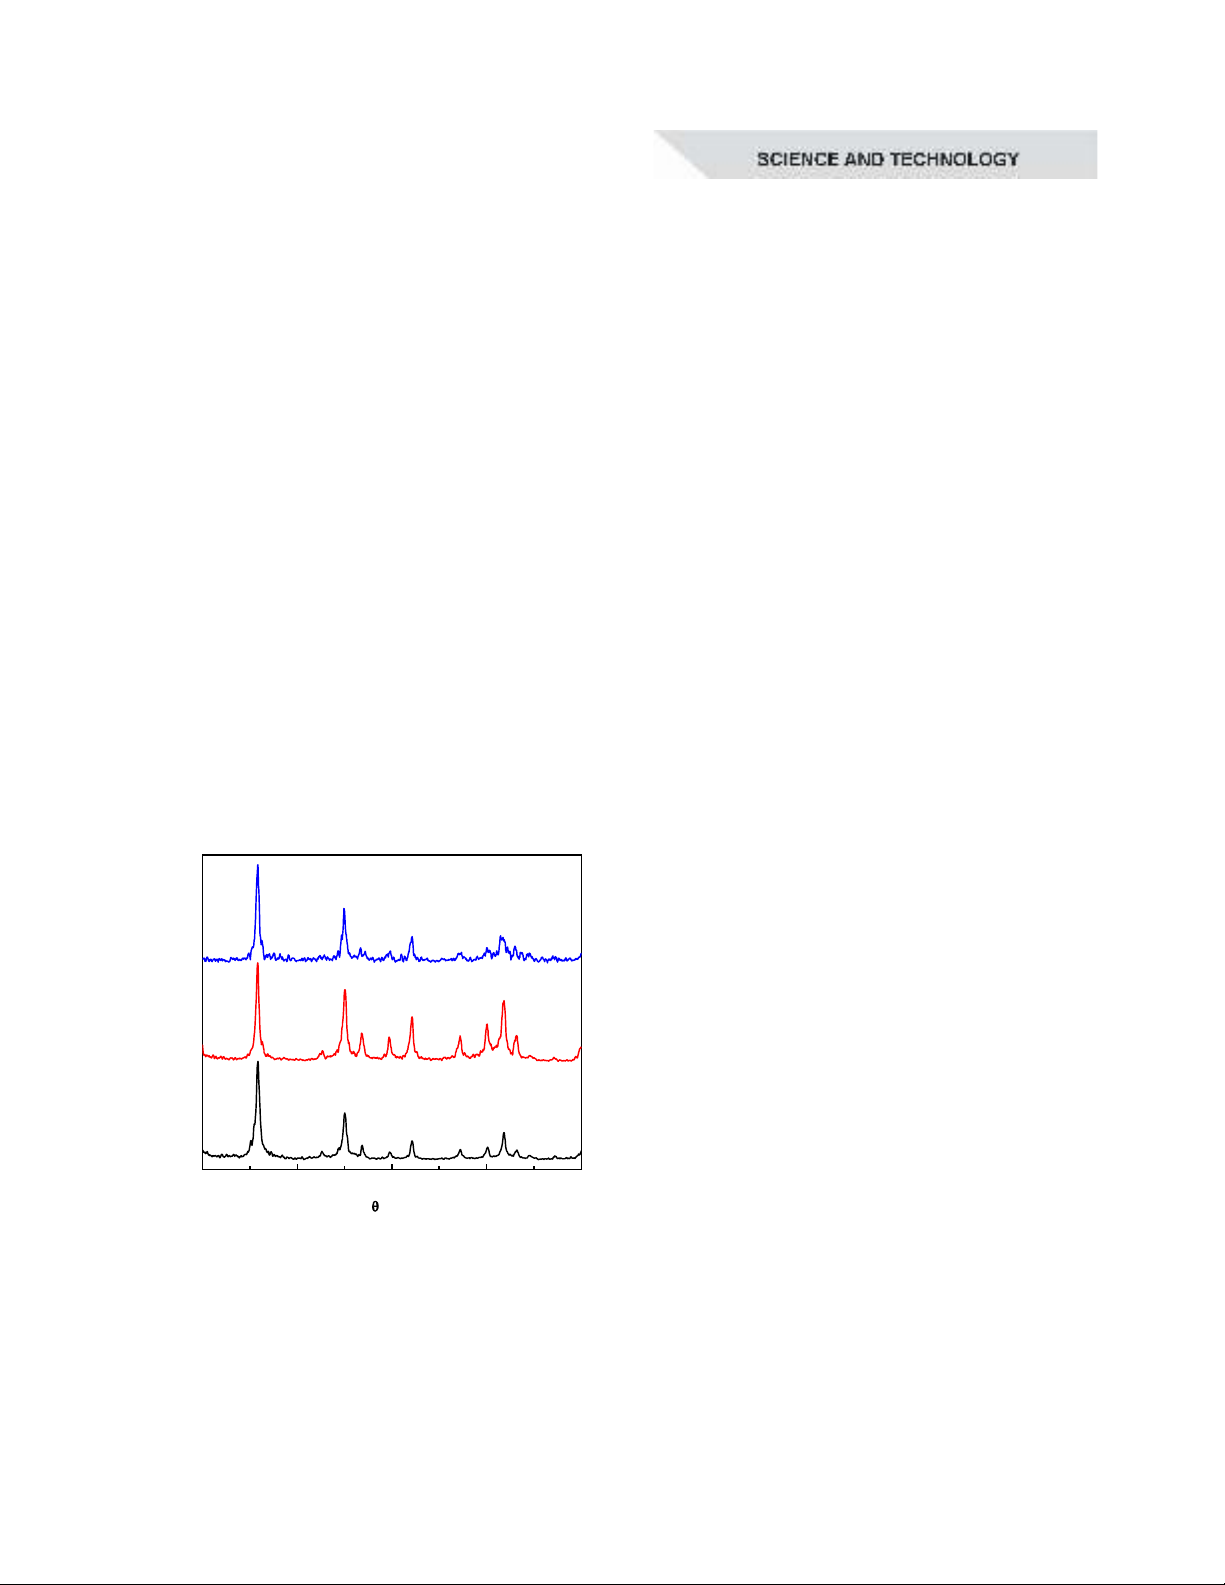
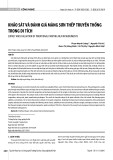
Figure 2. XRD patterns of YPO
4
:5%Tb
3+
material calcined at different temperatures:
300ºC(a), 400ºC(b), 500ºC(c), 600ºC(d), 700ºC(e), 800ºC(f), and 900ºC(g)
CAN THO JOURNAL OF SCIENCE AND TECHNOLOGY - No.05 - February, 2025
17
Figure 2 presents the XRD patterns of
YPO
4
:5%Tb
3+
material calcined at different
temperatures ranging from 300°C to 900°C
for 1 hour. The X-ray diffraction results
indicated that the crystalline phase of the
YPO
4
matrix was formed when the sample
was calcined at 300°C. The synthesized
samples exhibited a single-phase tetragonal
crystal structure, with all diffraction peaks
matching the standard JCPDS 74-2429 card.
Several characteristic diffraction peaks
appeared at 2θ = 25.8º, 32.5º, 34.9º, 36.7º,
39.6º, 42º, 47.1º, 49.9º, 51.8º, and 53.1º,
corresponding to the lattice planes (200),
(211), (112), (220), (202), (301), (103), (321),
(312), and (400), respectively (Jinyu Yang,
2016). The average crystallite size fell within
the range of 21-27 nm. Additionally, while
particle aggregation was observed as the
calcination temperature increased to 900°C,
the extent of this change remains minimal.
20 30 40 50 60
2
Intensity (a.u.)
c
b
a
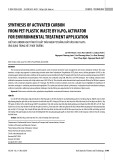
Figure 3. X-ray diffraction patterns of
YPO
4
:x%Tb
3+
samples (x=1(a), 5(b), 10(c))
Figure 3 presents the X-ray diffraction
(XRD) patterns of YPO
4
:x%Tb
3+
samples (x =
1, 5, 10) calcined at 800°C. The XRD results
confirmed the formation of the YPO
4
crystalline phase, indicating that the
synthesized material is single-phase with no
detectable impurities. All diffraction peaks
aligned well with the JCPDS 074-2429
standard card, verifying the material's
structural integrity. The average crystallite
sizes for the YPO
4
:1%Tb
3+
, YPO
4
:5%Tb
3+
,
and YPO
4
:10%Tb
3+
samples were 22 nm, 20
nm, and 21 nm, respectively. These results
suggested that varying the Tb
3+
ion
concentration had a negligible effect on grain
size and did not induce other phase
transitions. Thus, it can be concluded that the
synthesis conditions were relatively stable,
ensuring reproducibility and structural
consistency in the fabricated materials.
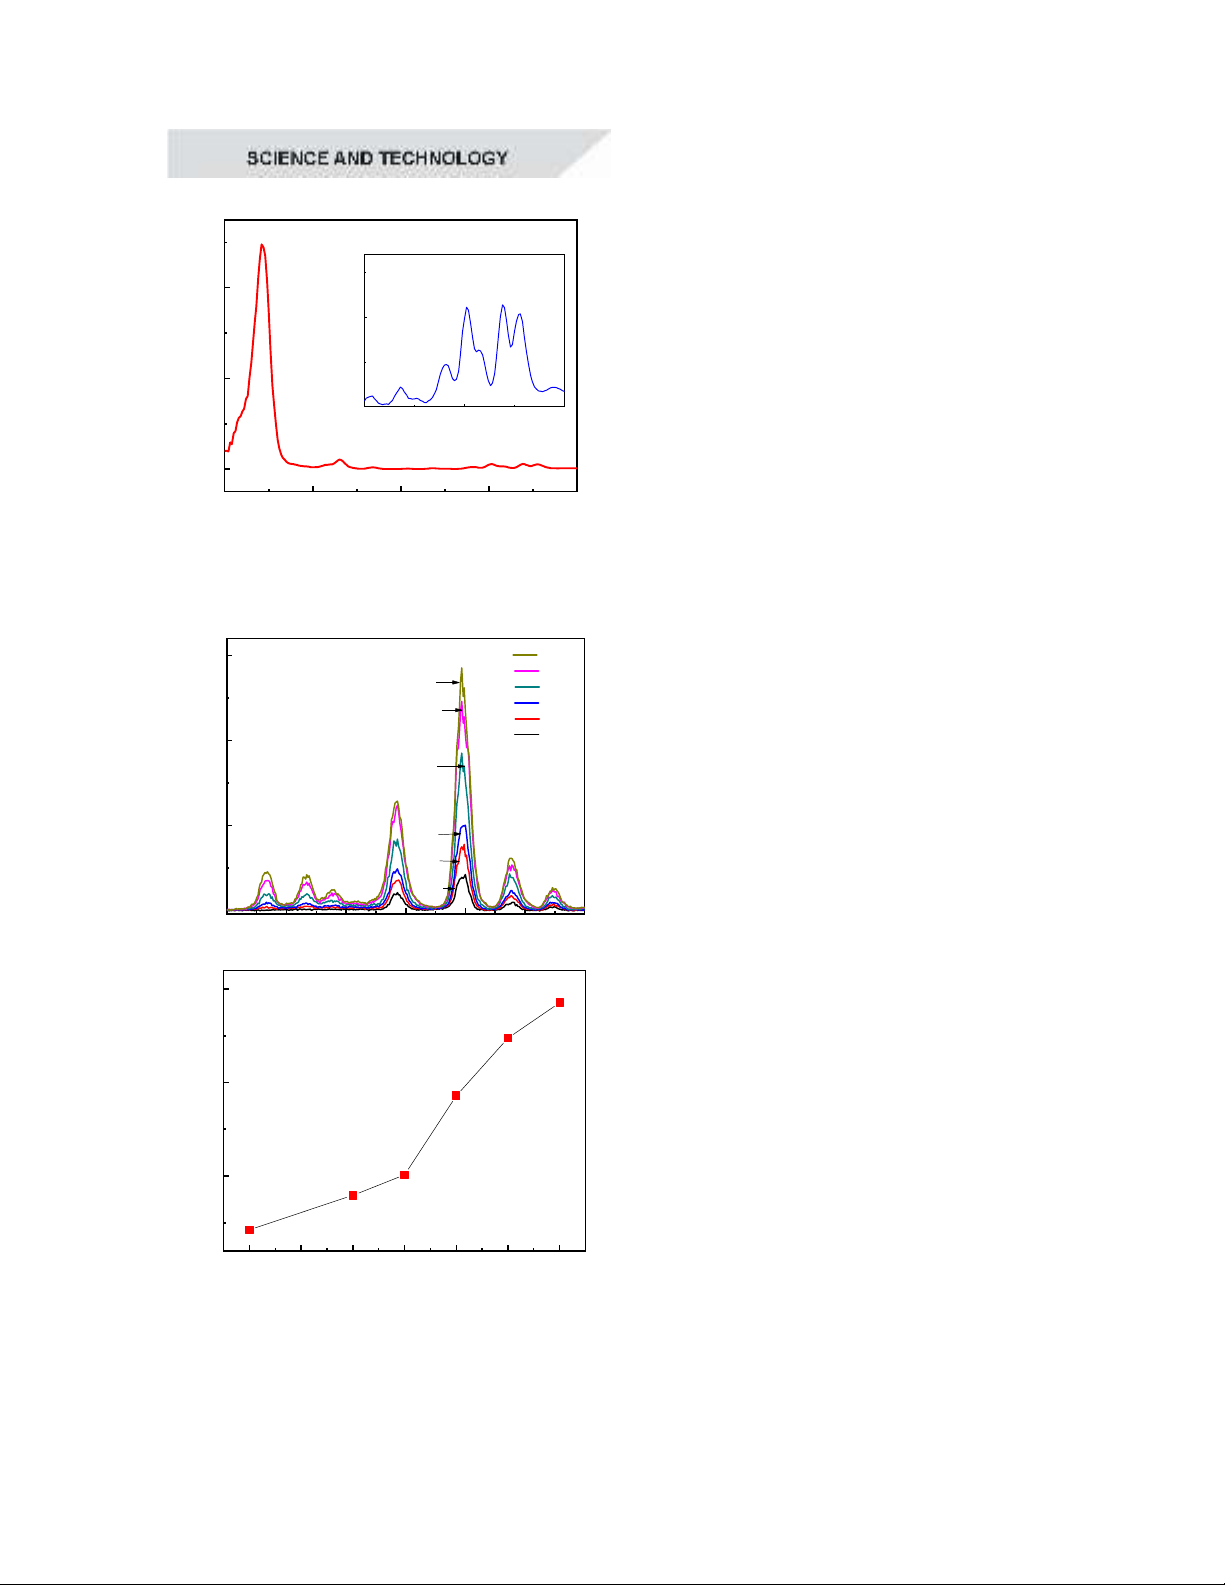
The optical properties of the
YPO₄:5%Tb
3+
material were investigated
using fluorescence spectroscopy. By
analyzing how the optical properties are
influenced by doping concentration and
annealing temperature, the optimal
conditions for material synthesis were
evaluated. Figure 4 presents the fluorescence
excitation spectrum of YPO
4
:5%Tb
3+
for an
emission wavelength of 546 nm. The
spectrum had a broad and intense band
around 220 nm, which was attributed to the
charge transfer band (CTB) between oxygen
and Tb³⁺ ions. Additionally, the excitation
spectrum exhibited several distinct excitation
lines in the 250–300 nm range,
corresponding to 4f-5d transitions, as well as
direct excitation transitions from the ground
state
7
F
6
to various excited states of Tb
3+
.
Specifically, the excitation line at 317, 340,
350, 368, and 378 nm corresponded to the
7
F
6
→
5
D
0
,
7
F
6
→
5
L
8
,
7
F
6
→
5
L
9
,
7
F
6
→
5
G
6
,
and
7
F
6
→
5
D
3
transitions, respectively
(Junfeng Yang, 2018; Hemam Jenee Devi,
2017). These transitions were characteristic
of 4f-4f electronic excitations of the Tb³⁺ ion,
confirming its incorporation into the YPO
4
host lattice.
CAN THO JOURNAL OF SCIENCE AND TECHNOLOGY - No.05 February, 2025
18
200 250 300 350 400
0
200
400
300 350 400
0
10
Intensity (a.u.)
Wavelength
(nm)
CTB
7
F
6
-
5
D
3
7
F
6
-
5
G
6
7
F
6
-
5
L
9
7
F
6
-
5
L
8
Figure 4. Excitation spectrum of
YPO
4
:5%Tb
3+
350 400 450 500 550 600 650
0
500
1000
1500
f)
900
o
C
e) 800
o
C
d) 700
o
C
c) 600
o
C
b) 500
o
C
a) 300
o
C
5
D
4
-
7
F
3
5
D
4
-
7
F
4
5
D
4
-
7
F
5
5
D
4
-
7
F
6
5
D
3
-
7
F
4
5
D
3
-
7
F
5
5
D
3
-
7
F
6
Intensity (a.u.)
Wavelength (nm)
a
b
c
d
e
f
A
300 400 500 600 700 800 900
500
1000
1500
Intensity (a.u.)
Temperature
(
o
C
)
5
D
4
-
7
F
5
B
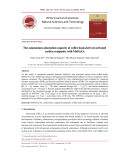
Figure 5. Emission spectra of
YPO
4
:5%Tb
3+
samples annealed at
different temperatures (A) and the
dependence of the intensity of
5
D
4
→
7
F
5
transition on temperatures (B)
Under excitation at 220 nm, electron
transitions within the Tb
3+
ion occurred.
When excited to higher-energy states, the
electrons underwent non-radiative relaxation
to lower excited states, specifically
5
D
3
and
5
D
4
, before radiatively transitioning to the
ground-state energy levels
7
F
J
(J = 3–6),
resulting in fluorescence emission. Figure 5
presents the fluorescence spectra of
YPO
4
:5%Tb
3+
samples annealed at
temperatures ranging from 300°C to 900°C.
The spectra exhibited similar shapes across
all annealing temperatures, with emission
predominantly in the blue region. The
fluorescence spectrum consisted of narrow
emission lines corresponding to the
5
D
3
→
7
F
J
and
5
D
4
→
7
F
J
transitions, specifically:
384 nm (
5
D
3
→
7
F
6
), 417 nm (
5
D
3
→
7
F
5
),
440 nm (
5
D
3
→
7
F
4
), 493 nm (
5
D
4
→
7
F
6
),
546 nm (
5
D
4
→
7
F
5
), 588 nm (
5
D
4
→
7
F
4
),
and 623 nm (
5
D
4
→
7
F
3
) (Jinyu Yang, 2016;
Wiehua Di, 2005). Among these transitions,
the
5
D
4
→
7
F
5
emission at 546 nm exhibited
the highest intensity, making them the
dominant feature in the fluorescence
spectrum. It is observed that the fluorescence
intensity of the
5
D
4
–
7
F
5
transition increased
as the synthesis temperature rose from 300°C
to 900°C. Although X-ray diffraction
analysis confirmed the formation of the
crystalline phase at 300°C, the fluorescence
intensity remained weak at temperatures
between 300°C and 600°C. Furthermore,
when the synthesis temperature exceeded
800°C, the fluorescence intensity began to
approach saturation. The presence of
characteristic Tb³⁺ emissions confirmed that
these ions were well dispersed within the
YPO
4
matrix. Based on these findings, the
optimal calcination temperature for
YPO
4
:Tb
3+
material in this study was
determined to be in the range of 800-900°C.
Figure 6 presents the fluorescence
spectra of YPO
4
:x%Tb
3+
(x = 0.1-15)


![Ô nhiễm không khí từ nông nghiệp: Thách thức toàn cầu và định hướng hành động [Mới nhất]](https://cdn.tailieu.vn/images/document/thumbnail/2025/20250917/kimphuong1001/135x160/52891758099584.jpg)