174
HNUE JOURNAL OF SCIENCE
Natural Sciences 2024, Volume 69, Issue 3, pp. 174-184
This paper is available online at http://hnuejs.edu.vn/ns
DOI: 10.18173/2354-1059.2024-0047
CLIMATE CHANGE TRENDS IN THE RED RIVER DELTA
Nguyen Thi Phuong Hang1, Nguyen Hoang Long2 and Dao Ngoc Hung1
1Faculty of Geography, Hanoi National University of Education, Hanoi city, Vietnam
2Department of Training, Hanoi National University of Education, Hanoi city, Vietnam
*Corresponding author: Nguyen Thi Phuong Hang, e-mail: phuonghang2993cht@gmail.com
Received September 4, 2024. Revised September 16, 2024. Accepted October 30, 2024.
Abstract. The Red River Delta (RRD) is one of the regions most significantly
impacted by climate change (CC) in Vietnam. This study utilizes correlation
assessment methods and regression equations to evaluate the trends of certain
meteorological factors and extreme weather events during the period 1961 - 2020 in
the RRD. Overall, climate factors across the region exhibit quite clear trends of
change. The highest trends in annual average temperature and maximum annual
average temperature are observed in the northwestern part of the RRD, especially in
major cities such as Ha Noi (the increase in mean annual temperature ranges from
0.0317 - 0.0336 ºC/year). The lowest trends in these temperatures are found in
coastal, island, and mountainous areas (the increase in mean annual temperature
ranges from 0.0133 - 0.0224 ºC/year). The annual rainfall reports a decreasing trend
at 17 out of 23 meteorological stations in the RRD, varying from -11 to 9 mm/year.
Extreme weather phenomena report little significant change, with maximum daily
rainfall records a decreasing trend, varying from -3.119 to 1.395 mm/year; the
number of days with rainfall exceeding 50 mm also reports a decrease, varying from
-0.058 to 0.017 days/year. The results of this study will serve as a basis for
developing action plans to respond to CC in the RRD.
Keywords: climate change trends, mean annual temperature, annual rainfall, extreme
weather, Red River Delta.
1. Introduction
According to the Law on Meteorology and Hydrology (2015), “CC is a change in climate
over a long period due to the impact of natural conditions and human activities, manifested
by global warming, rising sea levels, and increasing extreme meteorological and hydrological
phenomena” [1]. Human economic and social activities have increasingly intensified
greenhouse gas emissions, leading to more severe global CC [2].
According to the IPCC (2023), the global surface temperature trend during 2011 - 2020
was 1.09 ºC higher than the 1850 - 1900 period; sea levels rose by 0.15 - 0.25 m between

Climate change trends in the Red River Delta
175
1901 - 2018 [3]. According to the 2022 Annual Global Climate Report, the ten warmest years
in history occurred between 2010 - 2022 [4]. In Russia, the average temperature trend from
1981 - 2020 increased by 0.61 ºC/10 years, 2.5 times the global increase; annual rainfall
generally increased across Russia, especially in the central parts of the Asian territory, while
rainfall decreased slightly in the central and southern parts of the European territory [5]. In China,
the mean annual temperature has been increasing compared to the 1961 - 1990 period, with
a potential rise of 1.5 - 2.8 ºC by 2030 and 2.3 - 3.3 ºC by 2050; annual rainfall is also expected
to increase by 5 - 7% by 2050 [6]. In Saudi Arabia, the mean annual temperature trend is
expected to rise by approximately 0.8 - 1.6 ºC, 0.9 - 2.7 ºC, and 0.7 - 4.1 ºC during the periods
of 2025 - 2044, 2045 - 2064, and 2065 - 2084, respectively, compared to the 1986 - 2005
period under the RCP8.5 scenario [7]. In Central and South America, the air temperature
trend is in accordance with global warming, with an expected increase of 1 - 2 ºC by
2100 under the RCP2.6 scenario and 5 - 6 ºC under the RCP8.5 scenario [8].
According to the 2020 Climate Change Scenarios by the Ministry of Natural Resources
and Environment, the mean annual temperature in Vietnam is expected to increase compared
to the 1986 - 2005 period. Under the RCP4.5 scenario, by the end of the 21st century, northern
temperatures are expected to rise by 1.9 - 2.4 ºC and southern temperatures by 1.5 - 1.9 ºC;
while under the RCP8.5 scenario, northern temperatures may increase by 3.5 - 4.2 ºC, and
southern temperatures by 3.0 - 3.5 ºC [9]. Annual rainfall is also expected to increase by
10 - 20% under the RCP4.5 scenario compared to the 1986 - 2005 period [9]. During the first
half of the 21st century, a study [10] indicates that Vietnam's mean annual temperature trend
has been rising by approximately 0.3 ºC/10 years, and annual rainfall has generally been
increasing nationwide. In the RRD, Ha Noi, Thai Binh, and Nam Dinh are among the
localities most affected by CC; between 1958 - 2014, rainfall in the RRD has been decreasing
by 12.5%/57 years, while average temperatures have been notably increasing, particularly in
Nam Dinh (with a 1 ºC increase between 2001 - 2014 compared to 1981 - 1990) [11]. Due to
urbanization, CC impacts in Ha Noi have become more pronounced, resulting in a growing
temperature difference of 1 - 2 ºC between the inner city and its vicinity [12].
CC has also intensified natural disasters. Between 1976 - 2020, both the RCP 4.5 and
RCP 8.5 scenarios indicate that, in the future, from 2021 to 2050, drought in Hai Duong will
increase in both frequency and intensity, with extreme droughts occurring in cycles of about
9 - 10 years [13]. Sea levels are expected to rise fairly uniformly across localities; by the end
of the 21st century, sea levels along the coastal areas from Mong Cai to Hon Dau may rise by
44 cm under the RCP2.6 scenario, 52 cm under the RCP4.5 scenario, and 72 cm under the
RCP8.5 scenario [9]. According to the 2020 Climate Change Scenarios, if sea levels rise by
100 cm, the RRD risks losing approximately 15% of its natural land area (about 340 thousand
hectares); some localities, such as Nam Dinh (43.67%), Thai Binh (38.22%), and Hai Phong
(25.06%), are projected to lose significant land [9]. The RRD is also severely impacted by
saltwater intrusion; on the Day River, saltwater intrusion may extend an additional 15 km,
reaching 45 km by 2030; on the Red River, it may reach 47 km, increasing by about 5 km;
and on the Van Uc River, it may reach 35 km, increasing by 3-5 km. Several other rivers are
also expected to experience increased saltwater intrusion [14].
CC greatly impacts human life and production activities. Rising temperatures lead to
more frequent heat stress events. A study [15] reports that in Ha Noi, the ET (effective
Nguyen TPH, Nguyen HL & Dao NH
176
temperature index) of the hottest month has been increasing by about 0.014 ºC/year -
0.018 ºC/year, with higher ET values observed in urban Ha Noi, Ha Dong, and Son Tay,
potentially causing people to feel hotter, leading to heat exhaustion and sunstroke if exposed
to the sun for extended periods. Due to changes in temperature, rainfall, and humidity, a
study [16] indicates that, in the context of CC, while winter tends to be milder, sudden cold
snaps are increasing, facilitating the spread of influenza viruses and respiratory diseases
during the cold season.
According to Resolution No. 81/2023/QH15 “On the National Master Plan for the period
2021 - 2030 with a vision to 2050”, Viet Nam currently has six economic regions, including
the RRD, which comprises 11 provinces and cities [17]. The RRD is and will continue to be
the nation’s leading economic region, which is densely populated; and heavily impacted by CC.
Researching the trends of meteorological factors and phenomena in the RRD is of practical
significance as a basis for developing CC response strategies in the locality.
2. Content
2.1. Study area, data, and research methods
2.1.1. Study area
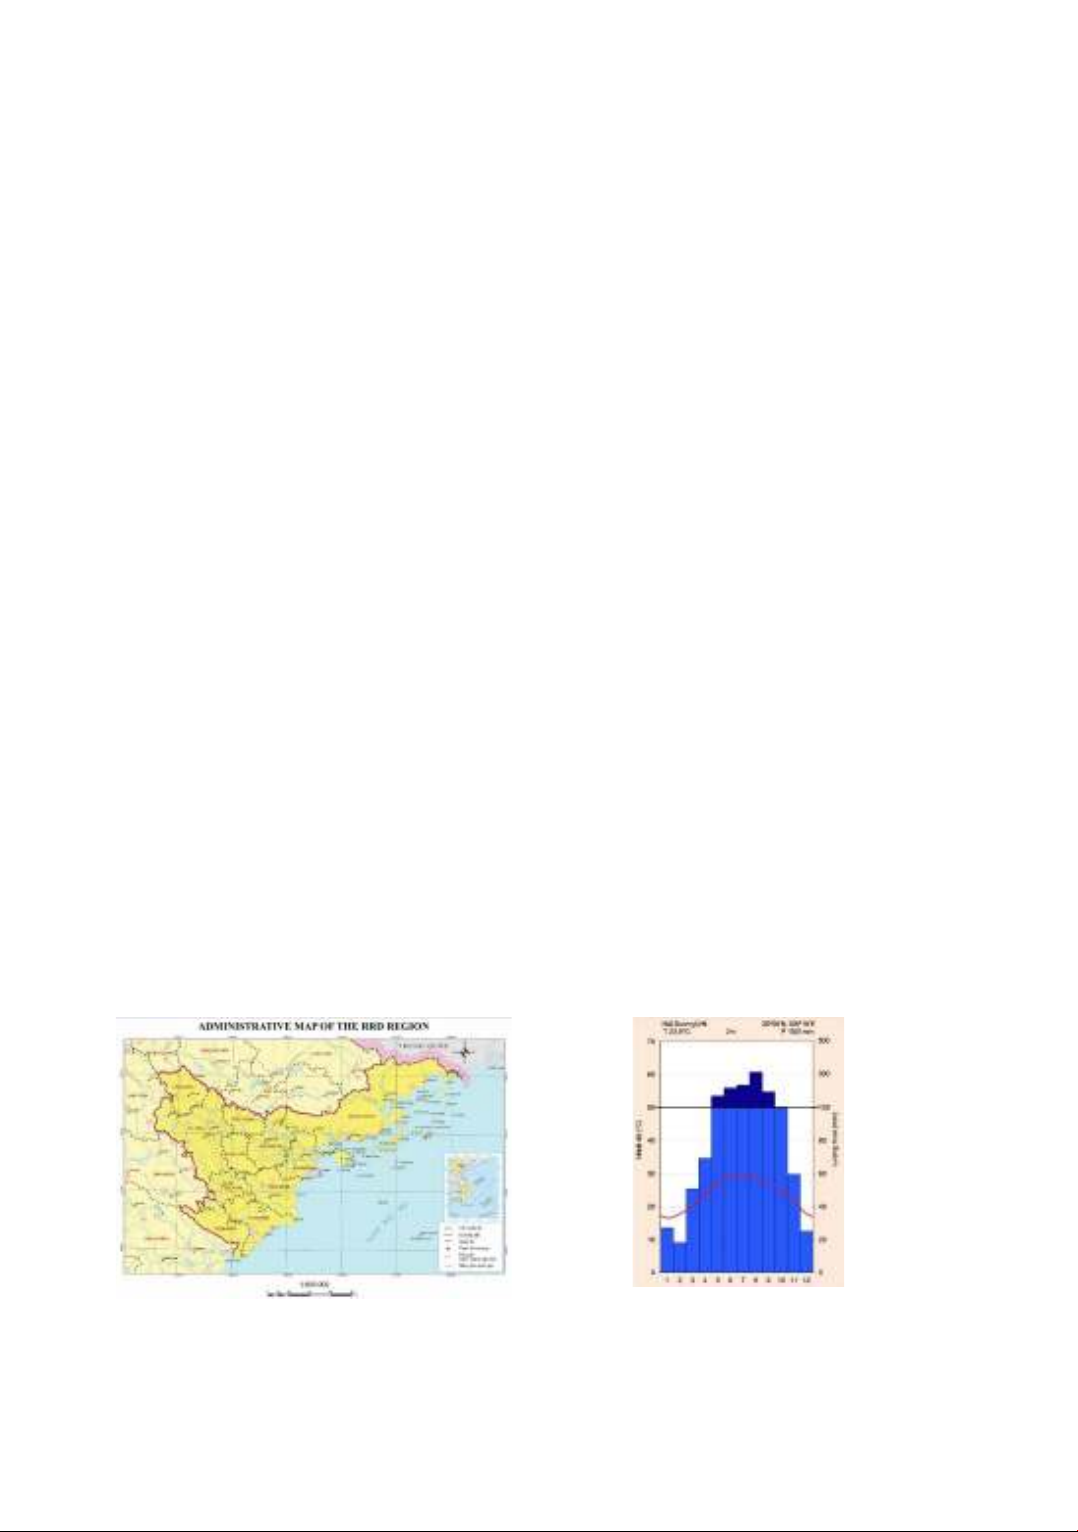
The RRD is located between the Northern Midlands and Mountainous Region to the
north and west, the North Central Region to the southwest, and the East Sea to the east
and southeast. The RRD comprises 11 provinces and cities: Ha Noi, Hai Phong, Hai
Duong, Hung Yen, Vinh Phuc, Bac Ninh, Thai Binh, Nam Dinh, Ha Nam, Ninh Binh,
and Quang Ninh. The area of the RRD is 21,278.6 km², accounting for about 6.4% of the
country's total area. The terrain consists of a triangular-shaped delta with its apex at Viet
Tri (Phu Tho) and its base along the coastline from Hai Phong to Ninh Binh, as well as
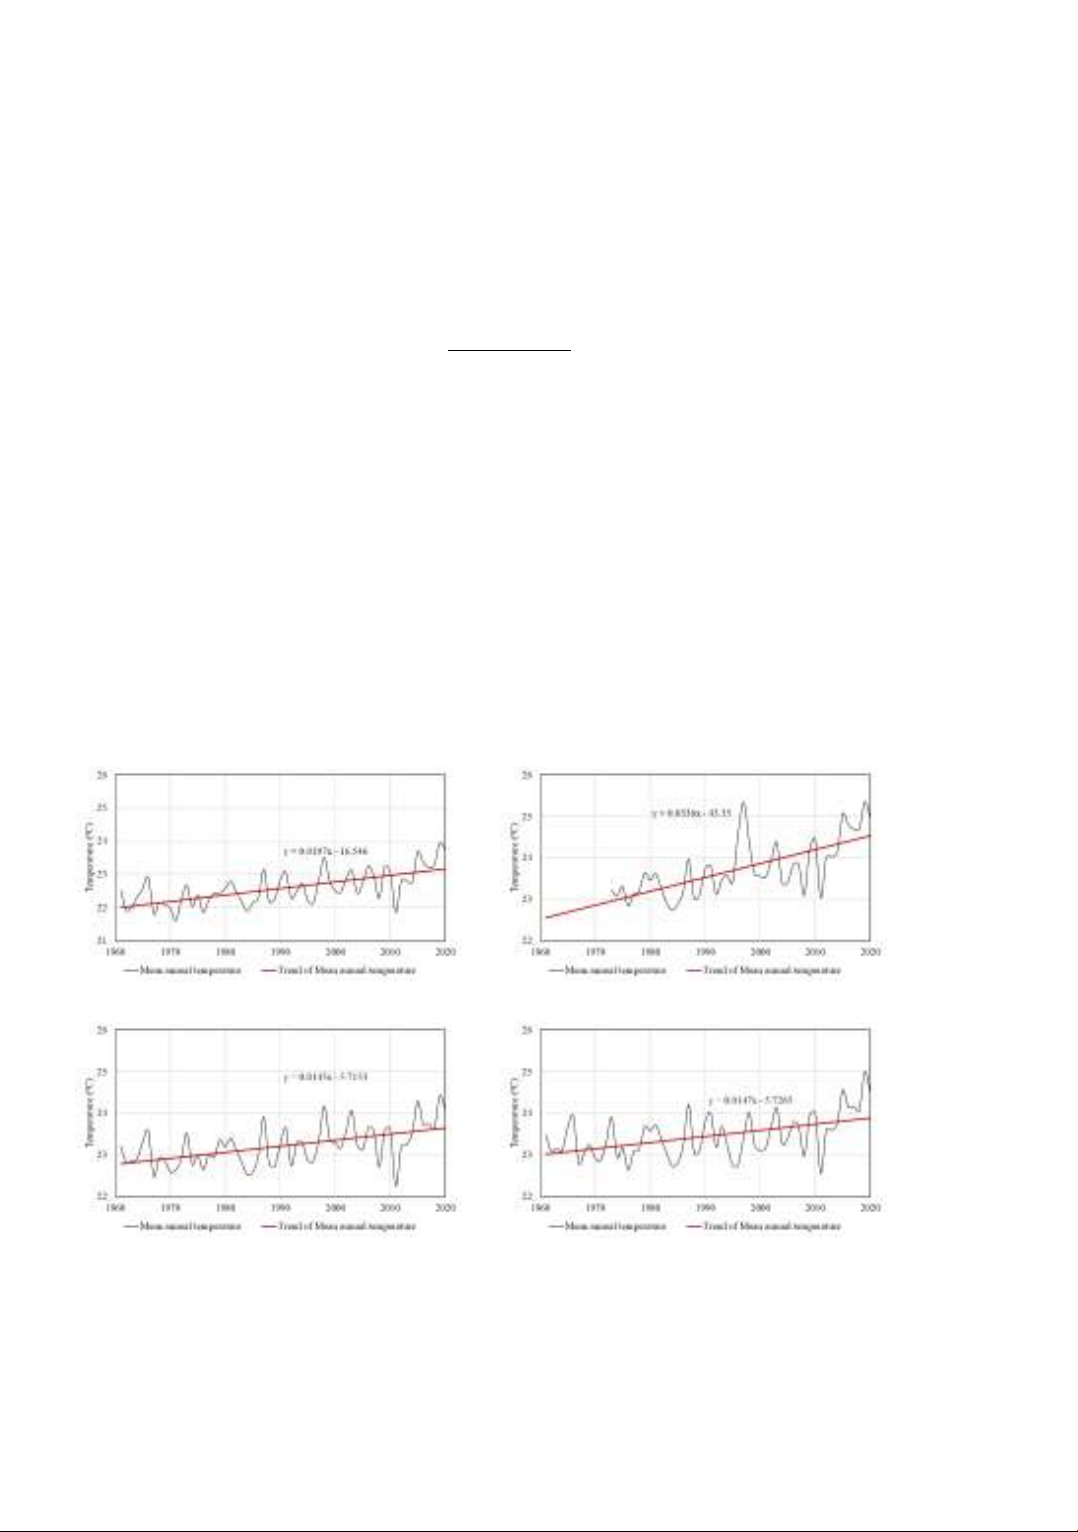
the Quang Ninh region to the northeast. The RRD has a tropical monsoon climate. The
mean annual temperature is about 23 - 25 ºC, with an annual temperature amplitude of
9 - 12 ºC. The annual rainfall in the RRD ranges from 1,400 - 2,000 mm. Rainfall is
seasonal, with the rainy season from May to September or October accounting for 75 - 85%
of the annual rainfall, and the dry season from November to April of the following year.
Figure 1. Administrative map of the RRD
Figure 2. Climatic chart at the
Hai Duong weather station

Climate change trends in the Red River Delta
177
As of 2022, the population of the RRD reached 23,454.1 thousand people, making it
the most populous region in Vietnam. The RRD has the highest population density among
the six economic regions, reaching 1,102 people/km² (in 2022), 3.7 times the national
average figure [18]. The RRD has 7 out of 11 provinces and cities within the planning of
the Northern Key Economic Region, with an economy ranking second in size nationwide,
reaching 2.37 trillion VND in 2020, accounting for 29.4% of the country's GDP structure [19].
2.1.2. Research Data
This study uses meteorological data series, including factors such as mean annual
temperature, annual rainfall, rainfall during the three driest months, number of rainy days,
maximum annual average temperature, maximum daily rainfall, and number of days with
rainfall exceeding 50 mm during the period 1961 - 2020. Data was collected from 23
meteorological stations in the RRD (Ba Vi, Bach Long Vi, Bai Chay, Co To, Cua Ong,
Ha Dong, Ha Nam, Hai Duong, Hon Dau, Hung Yen, Lang, Mong Cai, Nam Dinh, Nho
Quan, Ninh Binh, Phu Lien, Quang Ha, Son Tay, Tam Dao, Thai Binh, Tien Yen, Uong
Bi, Van Ly) and 20 surrounding stations (Dinh Lap, Son Dong, Luc Ngan, Lang Son, Huu
Lung, Bac Giang, Hiep Hoa, Thai Nguyen, Tuyen Quang, Phu Ho, Viet Tri, Minh Dai,
Hoa Binh, Kim Boi, Mai Chau, Lac Son, Chi Ne, Hoi Xuan, Yen Dinh, Bai Thuong).
2.1.3. Key research methods
* Correlation assessment method
To determine the trend of certain climate factors Y, it is necessary to test whether the
climate factor exhibits a trend and establish the trend equation. The correlation between
the meteorological factor y and time t (in this study, time is the independent variable) is
tested using the following formula [20]:
𝑟 = 𝑦∗𝑡
−𝑦∗𝑡
√𝑦2
−(𝑦)2∗√𝑡2
−(𝑡)2
where y is the climate factor, t is time, and r is the correlation coefficient. The correlation
degree of r is specified as follows:
• If r < 0.5, the correlation degree is weak;
• If 0.5 ≤ r < 0.7, the correlation degree is moderate;
• If 0.7 ≤ r < 0.9, the correlation degree is relatively strong;
• When 0.9 ≤ r < 1, the correlation degree is strong;
• If r = 1, the correlation is perfect.
* Regression equation method
The regression equation and trend line will have significance if, after testing, the
correlation degree is relatively strong or higher (r > 0.7 or r² > 0.5). From there, the
regression equation is established to calculate the trend of factor y over time. The trend
of the study object over time is expressed by a linear regression equation as follows [20]:
𝑦𝑡=𝑎𝑡+𝑏
Where y is the climate factor, t is time, 𝑎 =𝑦∗𝑡
−𝑦
∗𝑡
𝑡2
−(𝑡)2 and 𝑏 = 𝑦−𝑎𝑡
Nguyen TPH, Nguyen HL & Dao NH
178
* Inverse distance weighting (IDW) interpolation method
This method was used to create a map of the change in mean annual temperature and
maximum annual average temperature in the RRD. In the interpolation process, sample
points are weighted so that the influence of one point over another decreases with distance
from the unknown point. The weight of each point is calculated using the following
formula [21]:
𝑍0=∑𝑍𝑖
𝑁
𝑖=1 .𝑑𝑖
−𝑛
∑𝑑𝑖
−𝑛
𝑁
𝑖=1
Where Zi is the value at a known point, di is the distance to the unknown point, Z0 is
the value at the unknown point, N is the total number of sample points, and n is the
exponent value.
2.2. Research results
2.2.1. Trends in meteorological factors
The trend of mean annual temperature
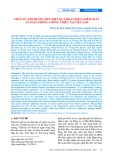
During the period 1961 - 2020, the mean annual temperature in the RRD records an
increasing trend, ranging from 0.013 to 0.034 ºC/year. At the Ha Dong meteorological
station, the trend averaged 0.034 ºC/year, 1.66 times the average trend of the entire region
and 2.32 times that of the Phu Lien station in Hai Phong (0.015 ºC/year).
a) Tien Yen
b) Ha Dong
c) Phu Lien
d) Thai Binh
Figure 3. Long-term variation and trend of the mean annual temperature changes
from 1961 to 2020 in the RRD
According to the spatial distribution, the average annual temperature tends to
decrease gradually towards the west and east of Ha Noi. In the eastern part, the trend of
decreasing average annual temperature is slower compared to the western part.


![Sổ tay Phòng chống lụt bão [Cập nhật mới nhất]](https://cdn.tailieu.vn/images/document/thumbnail/2025/20250605/vijiraiya/135x160/443_so-tay-phong-chong-lut-bao.jpg)


![Tài liệu Vi sinh vật môi trường [Mới nhất]](https://cdn.tailieu.vn/images/document/thumbnail/2025/20251123/ngkimxuyen/135x160/21891763953413.jpg)
![Sổ tay truyền thông Phân loại chất thải rắn sinh hoạt trên địa bàn tỉnh Quảng Nam [Chuẩn nhất]](https://cdn.tailieu.vn/images/document/thumbnail/2025/20251114/kimphuong1001/135x160/1701763094001.jpg)

![Quản lý chất thải nguy hại: Sổ tay Môi trường [Chuẩn nhất]](https://cdn.tailieu.vn/images/document/thumbnail/2025/20251029/kimphuong1001/135x160/9011761720170.jpg)