
HPU2. Nat. Sci. Tech. Vol 02, issue 03 (2023), 51-58
HPU2 Journal of Sciences:
Natural Sciences and Technology
journal homepage: https://sj.hpu2.edu.vn
Article type: Research article
Received date: 22-10-2023 ; Revised date: 02-12-2023 ; Accepted date: 11-12-2023
This is licensed under the CC BY-NC-ND 4.0
Control the solubility of carbon quantum dots
by solvent engineering
Thu-Hoa Do Thia, Duc-Nam Caob, Thu-Huyen Nguyenb, Thi-Kieu Phamb,
Phuong-Nam Nguyenb, Thanh-Nhan Pham Thib, Xuan-Dung Maib,*
aEcological Primary and Secondary Eraschool, Ha Noi, Viet Nam
b Hanoi Pedagogical University 2, Vinh Phuc, Viet Nam
Abstract
Solubility parameters of carbon quantum dots (CQDs) are important physical properties to deploy
CQDs in various applications such as organic light emitting diodes (OLEDs), light-converting
materials in LEDs, and photoluminescent sensors for metal ion detection. Because of the low toxicity
and tunable emission most CQDs have been designed to be water-soluble and biocompatible; oil-
soluble CQDs that are essential for OLEDs are not yet explored. Herein, we used a solvothermal
method to prepare CQDs and demonstrated that the solubility of CQDs could be controlled by the
synthetic solvent. We used hydrophobic (toluene), ambipolar (ethanol), and polar (water) solvents to
prepare three types of CQDs from citric acid and thiourea. Correlating surface chemistry, solubility,
and fluorescent properties of the CQDs suggests that the solubility of CQDs is governed by the
dominate surface functional groups while the more diversity in the surface functional groups shift the
emission of CQDs to longer wavelengths.
Keywords: Carbon quantum dots, solublity parameter, solvent engineering, oil soluble, solvothermal
* Corresponding author, E-mail: maixuandung@hpu2.edu.vn
https://doi.org/10.56764/hpu2.jos.2023.2.3.51-58

HPU2. Nat. Sci. Tech. 2023, 2(3), 51-58
https://sj.hpu2.edu.vn 52
1. Introduction
Carbon quantum dots (CQDs) have been emerged as potential materials to replace Cd-based QDs
in diverse applications, especially in the fields of biology and biochemistry because CQDs have been
improved to be low-toxic, biocompatible, and highly photoluminescent [1], [2]. CQDs could be
synthesized by cutting down large C sp2 structures into nano-sized graphene, known as top-down
methods, or by fusing small organic molecules into nano-sized carbogenic dots, known as bottom-up
strategy [3]. Solvothermal synthesis has been widely used to prepare CQDs from a large bank of
molecular precursors [4]–[7]. Although the concrete formation mechanism of CQDs from molecular
precursors is still in discussion the final structure of bottom-up synthetic CQDs could be classified into
graphitic dots and carbon nanodots [3]. While graphitic dots exhibits size-dependent absorption and
emission spectra [8], [9] the optical properties of carbon nanodots are vastly dominated by a molecular
fluorophore which is an intermediate product of the fusion processes [3], [10]. The structure of carbon
nanodots is fairly described as a carbogenic dot whose core involves polyaromactic hydrocarbons
(PAHs) and the molecular fluorophore [7], [11] while whose surface is decorated with simple groups
such as –COOH, –NH2, and –OH. The optical properties of CQDs are determined by the carbogenic
core, surface functional groups, and the chemical bonding between the core and the surface groups.
Additionally, the surface functional groups determine the solubility as well as chemical reactivity of
CQDs.
From the colloidal chemistry point of view, the solvation of surface functional groups determines
the solubility of CQDs in different solvents. In broader sense, the surface functional groups must
govern the solubility parameters CQDs. The interactions between the surface functional groups with
solvent could lead to the aggregation of CQDs [12], create new emitting centers [13], or redistribute
the charge density in the excited states [14] resulting in changes in the photoluminescent properties of
CQDs [15]. Additionally, surface functional groups also affect the toxicity [16] and metal ion
sensitivity [17] of CQDs. Despite the importance of surface chemistry the surface functional groups of
CQDs cannot be exchanged by ligand exchange methods because of the covalent bonding nature in
CQDs. Post-surface treatment or tuning the synthetic recipe is necessary to obtain CQDs with target
surface functional groups [18]–[21]. Y. Zhang group reported the synthesis of CQDs emitting either in
green or red region simply by changing the synthetic solvent from ethylene glycol to glycerol [20]. K.
Sahu and co-workers treated solvothermally 1,2,4-triaminobenzene and urea in different solvents to
produces CQDs emitting different colors in the visible region [21]. Those early reports imply that
solvent engineering could be an important tool for the development of CQDs toward optoelectronic
applications where hydrophobic CQDs are necessary.
Herein we used a solvothermal method to prepare CQDs using citric acid and thiourea in different
solvents, including toluene, ethanol, and water. Comparing the surface chemistry of CQDs and their
optical properties reveals that the emission spectrum of CQDs gets wider as the surface functional
groups are more complicated.
2. Experimental section
2.1. Chemicals and facilities
Citric acid monohydrate (CA, 99.8%) and thiourea (TUA, 99.5%) were purchased from Aladdin
Chemicals. Ethanol and toluene (HPLC grade) was supplied by Daejung Chemical. Double-distillated
water was prepared freshly in the laboratory and used as solvent. A 50 ml, polyparaphenol (PPL) liner
HPU2. Nat. Sci. Tech. 2023, 2(3), 51-58
https://sj.hpu2.edu.vn 53
autoclave was used as solvothermal reactor. Binder ED115 electric oven was used to provide
controlled temperature environment for the solvothermal synthesis.
2.2. The synthesis of carbon quantum dots
1.47 g of CA (7 mmol) and 0.8 g of TUA (10.5 mmol) was dissolved in water and the resultant
solution was transferred into a PPL liner autoclave. Solvothermal treatment was carried out in an
electric oven at 200oC for 6 hours. After cooling down to room temperature, CQDs was precipitated
by adding acetone and collected by centrifugation at 8000 rounds per minute for 10 minutes at 15oC.
CQDs were then dispersed in water and filtered using a 0.22 μm syringe filter to remove large
particles. Toluene and ethanol was used instead of water to obtain tol-CQDs and eth-CQDs,
respectively.
2.3. Characterizations
The absorption spectra CQDs were carried out using an UV-2450 (Shimadzu) spectrometer while
photoluminescent (PL) and photoluminescent excitation spectra (PLE) were conducted on FLS1000
(Edinburgh Instrument) fluorescent spectrometer. Jasco FT/IR6300 spectrometer was used to measure
FTIR spectra of CQDs.
3. Results and discussion
In a previous study, we were successful in preparation of CQDs from CA and TUA in acetone by
a solvothermal method; the diameter of CQDs varied from 2.5 to 8.5 nm [6]. In current study, we
explored the solvothermal method to different solvents, including toluene, ethanol, and water. The
formation of CQDs could be indirectly improved by the photoluminescence of the CQDs dissolved in
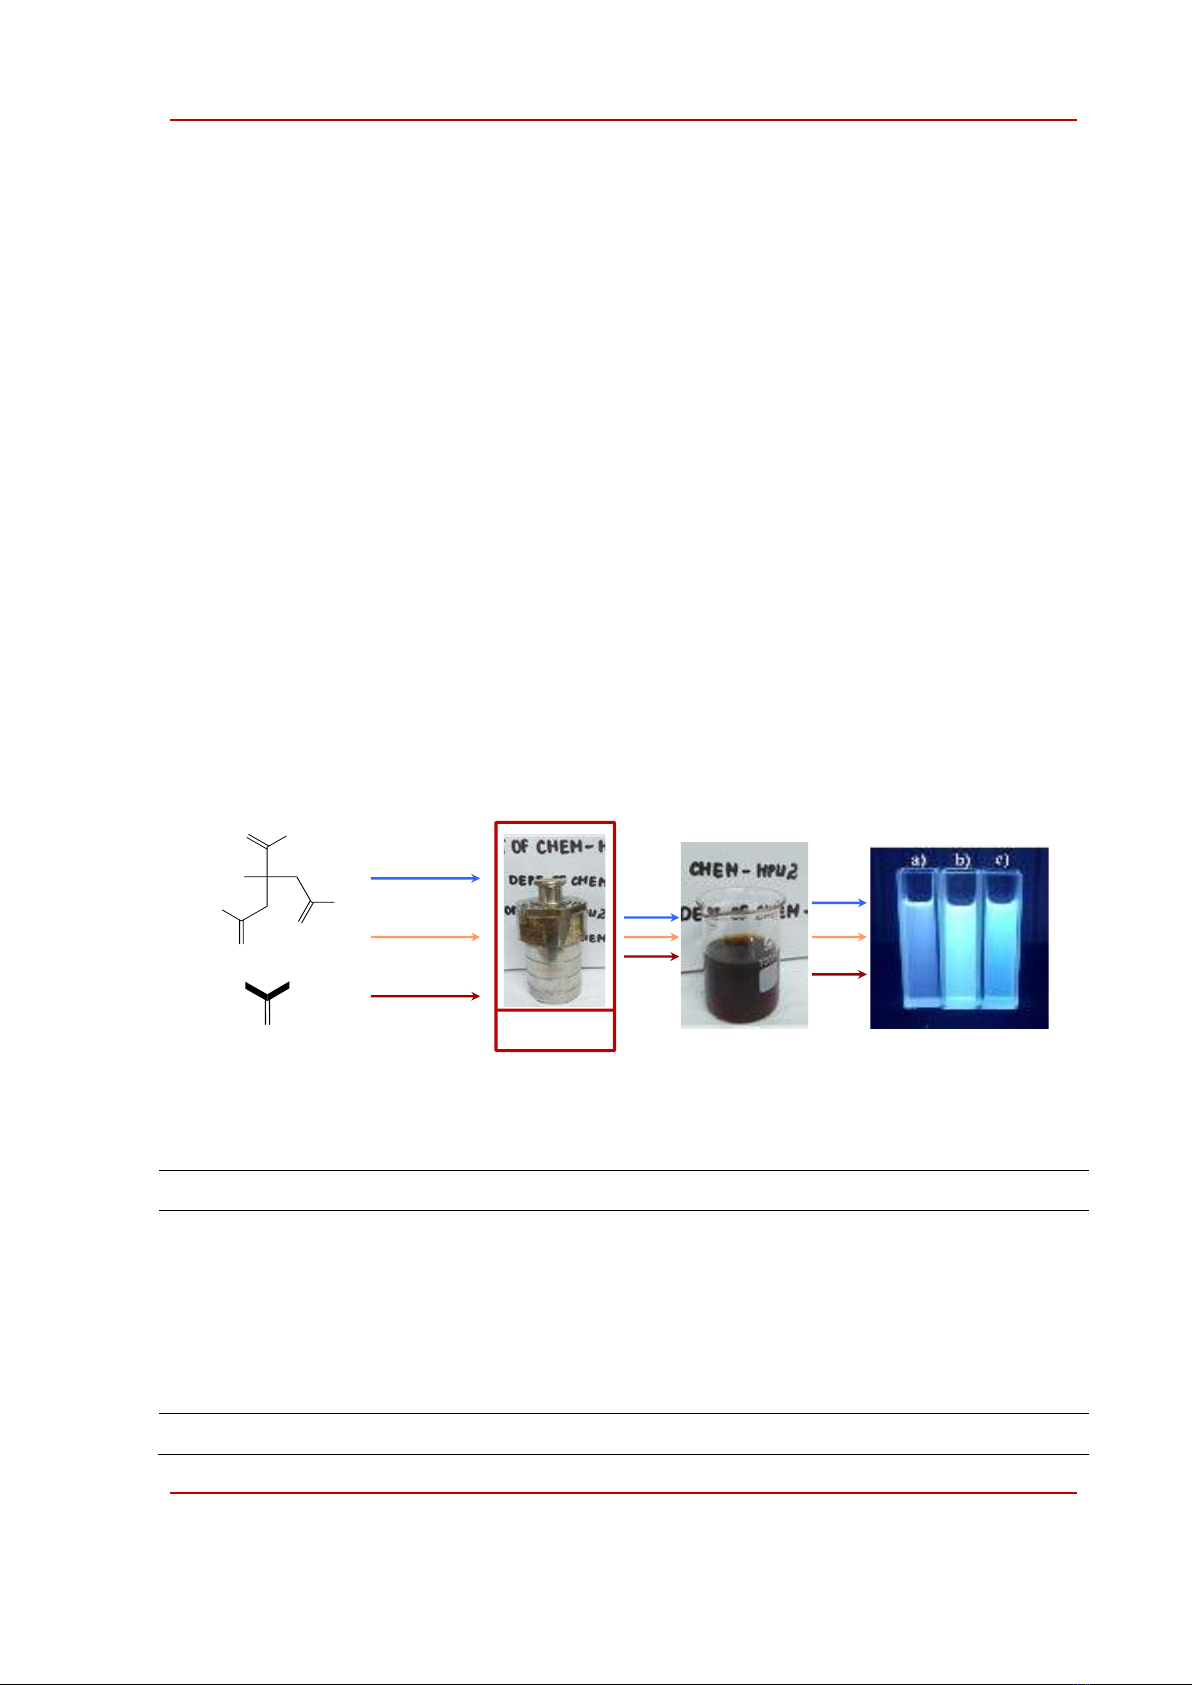
the mother solvents as shown in picture a)-c) in Fig. 1.
Figure 1. Step-wise synthesis of carbon quantum dots. Solutions of tol-CQDs (a), eth-CQDs (b), and
wat-CQDs (c) under UV light at 365 nm.
Table 1. Solubility of CQDs in different solvents
Solvents:
hexane
toluene
chlorobenzene
chloroform
acetonitrile
ethanol
methanol
Water
tol-
CQDs
S
S
S
S
I
I
I
I
eth-
CQDs
I
S
S
S
S
S
S
S
wat-
CQDs
I
I
I
I
S
I
S
S
S: soluble; I: insoluble
HO
O
OH
O OH
O
HO
N H 2
S
H2N
C6H5CH3
C2H5OH
H2O
200oC, 6h
a)
b)
c)
HPU2. Nat. Sci. Tech. 2023, 2(3), 51-58
https://sj.hpu2.edu.vn 54
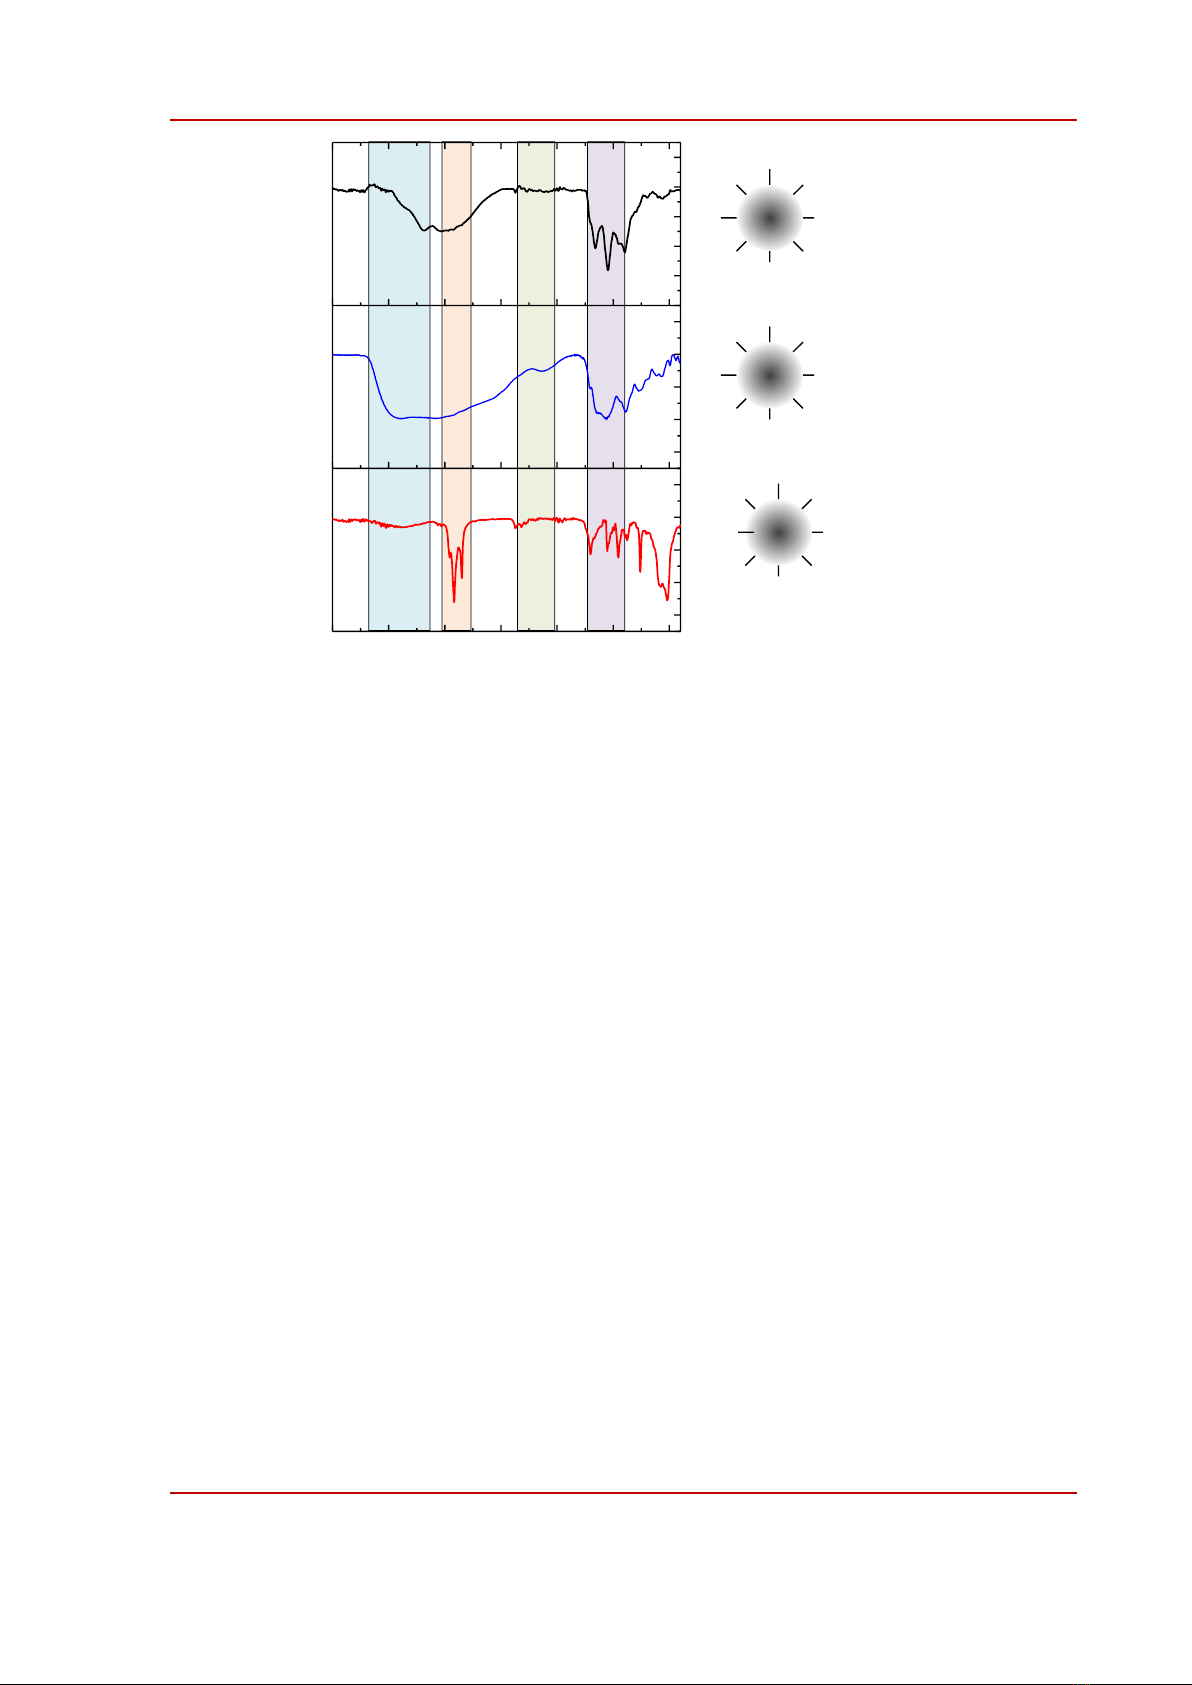
Figure 2. FTIR spectra of CQDs prepared by a solvothermal method using toluene (tol-), ethanol
(eth), and water (wat) solvents. I, II, III, and IV are four groups bonds recognized by the FTIR spectra.
The solubility of CQDs indifferent solvents was tested simply by dissolving about 20 mg into 2
ml of the solvent; CQDs was sad to soluble in a solvent if a homogeneous solution was obtained. The
solubility of CQDs is given in Table 1. Wat-CQDs are soluble in protic or highly polar solvents such
as acetonitrile, methanol, and water; Tol-CQDs are soluble in nonpolar solvent such as hexane,
toluene, and chlorobenzene while eth-CQDs are soluble in various solvents. To correlate the solubility
of CQDs with their surface chemistry we conducted Fourier transform infrared (FTIR) spectra of dried
CQDs and the results are summarized in Fig. 2. We selected four important vibrational regions into
consideration which are noted as I, II, III, and IV respectively in Fig. 2. Stretching vibrations of polar
O-H or N-S bonds appear in region I while stretching of aliphatic C-H bonds is observed in region II.
Possible triple bonds such as C≡C or C≡N would be found in region III. C=O bonds either in
carboxylic acid, ester, and amide and C=C bonds are visible in region IV [6], [18], [22], [23]. The
results indicate that tol-CQDs involve types I and IV functional groups; wat-CQDs include types I, II,
and IV while eth-CQDs include all types as modeled in Fig. 2. The existence of functional groups with
different polarities on the surface of CQDs is in line with the solubility of CQDs in Table 1.
III III IV
I
I
II II
II
IV
IV
IV
I
I
II III
III
IV
II
IV
II
IV
II II
II
IV
II
IV
I: O-H, N-H; II: -C-H
III: C≡C, C≡N
IV: C(OH)=O, C(NH)=O, C=C
4000 3500 3000 2500 2000 1500 1000
Wavenumber (cm-1)
tol-CQDs
Transmitance (%)
eth-CQDs
wat-CQDs
HPU2. Nat. Sci. Tech. 2023, 2(3), 51-58
https://sj.hpu2.edu.vn 55
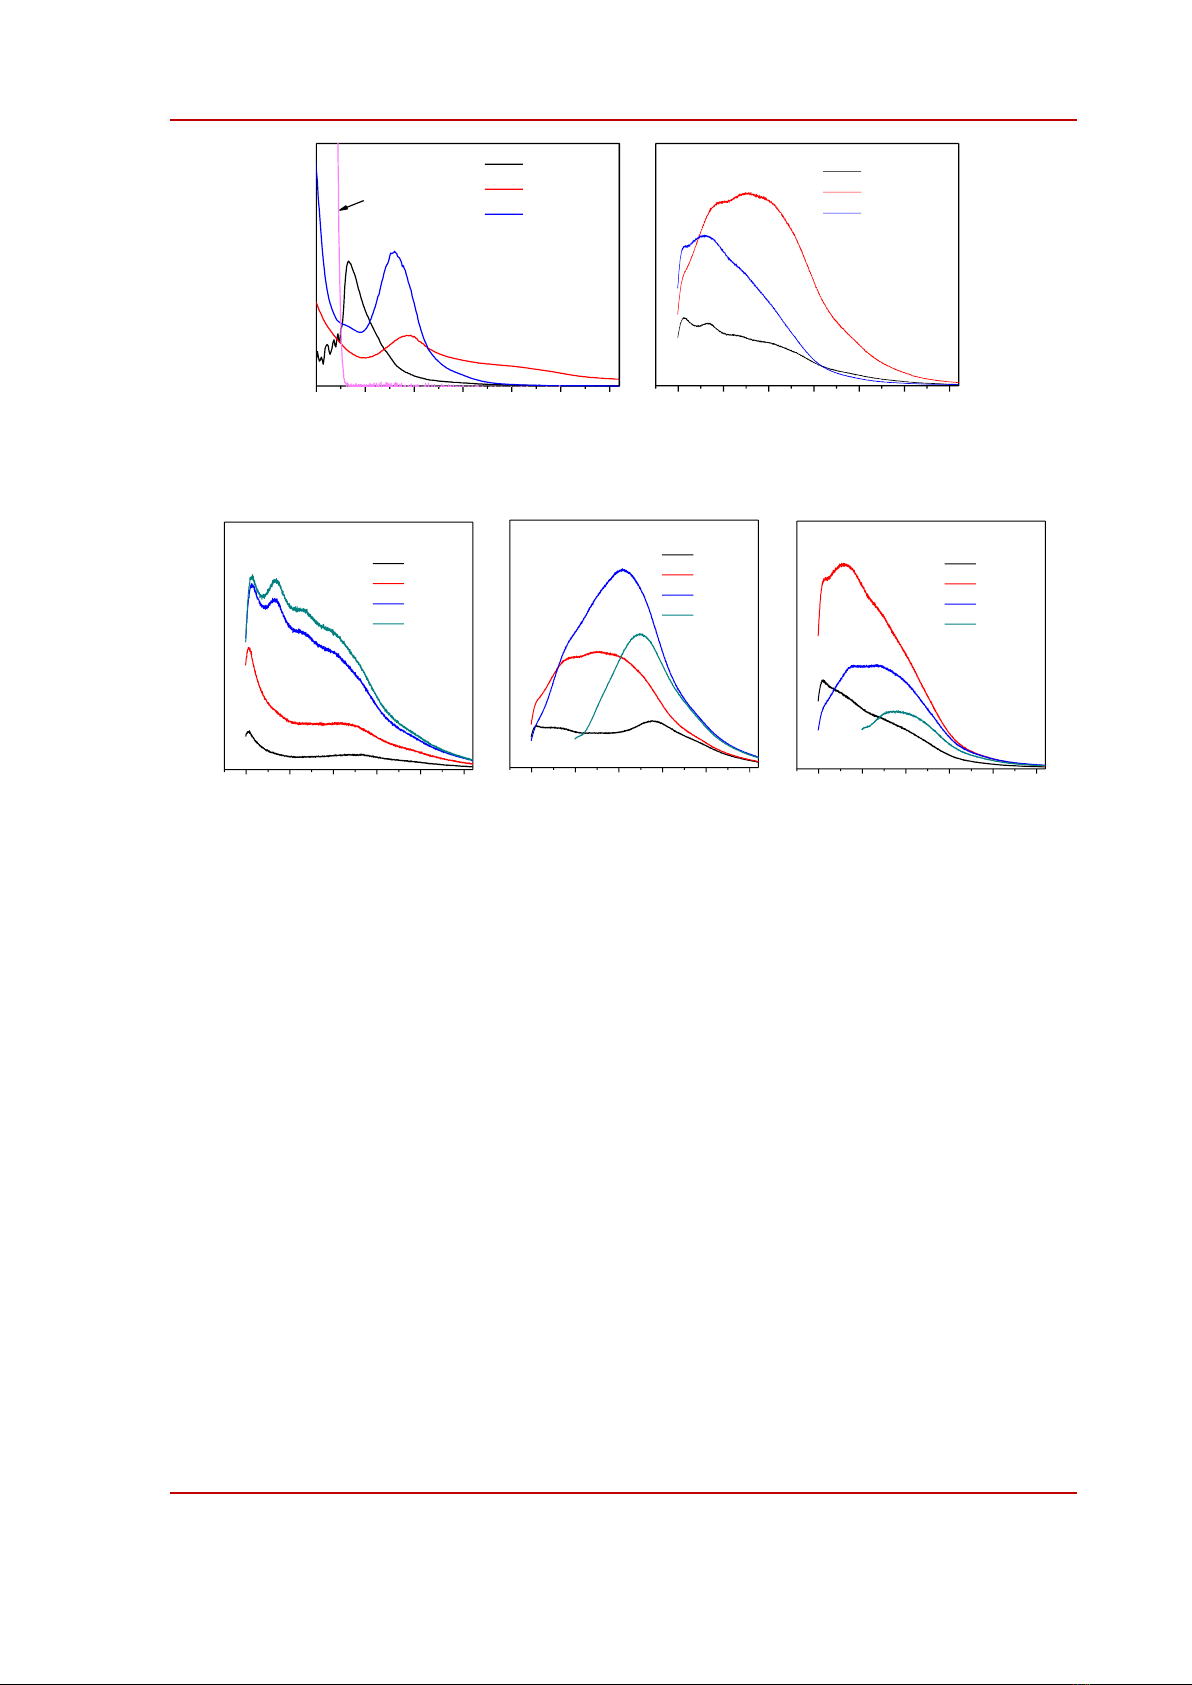
Figure 3. a) absorption and b) photoluminescent spectra of CQDs prepared in toluene (tol-), ethanol
(eth-), and water (wat-). The relative quantum emission efficiencies are given in b).
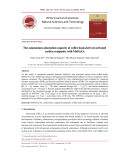
Figure 4. Excitation-dependent photoluminescent spectra of CQDs prepared in toluene (tol-), ethanol
(eth-), and water (wat-).
The optical properties of CQDs are summarized in Fig. 3 and Fig. 4. The absorption of tol-CQDs
dissolved in toluene was featureless; an absorption tail whose absorbance decreased gradually with the
wavelength was similar to the absorption profile of graphene oxide [24]. The observed absorption
band at 280 nm was likely due to the subtraction absorbance of sample to that of toluene solvent. Eth-
CQDs and wat-CQDs exhibited an absorption band at 330-340 nm which could be assigned to an
molecular fluorophore formed via the condensation between CA and TUA [3]. Compared to other
CQDs, eth-CQDs had significant absorbance above 400 nm which originates from low-energy states
of surface functional groups [10]. This difference was consistent with the FTIR results discussed
above that eth-CQDs possessed much richer surface functional groups than other CQDs. The
photoluminescent spectra of CQDs are shown in Fig. 3b. While the emission spectra of tol-CQDs and
wat-CQDs were mostly in the deep blue region maximized at about 425 nm the emission spectrum of
eth-CQDs shifted to blue-green region, maximized at 480 nm. The emission quantum yield that was
calculated by compared to quinine sulfate increased in the order of tol-CQDs (12.6%), wat-CQDs
(22.4%), and eth-CQDs (42.4%). Likely, the more surface sates provide more luminescent
recombination channels in CQDs. To study further into the emission mechanism of CQDs, we
measured PL spectra of CQDs by varying the excitation wavelength across the absorption range of
CQDs; the results are shown in Fig. 4. When changing the excitation wavelength, the emission
spectrum of tol-CQDs only changed in the relative intensity. The PL maximum of wat-CQDs shifted
gradually from 425 nm to 500 nm when increasing the excitation wavelength from 300 nm to 400 nm.
400 450 500 550 600 650 700
PL Intensity (a. u)
Wavelength (nm)
tol-CQDs
eth-CQDs
wat-CQDs
250 300 350 400 450 500 550
Absorbance (a.u)
Wavelength (nm)
tol-CQDs
eth-CQDs
wat-CQDs
Toluene
12.6%
22.4%
42.4%
a) b)
400 450 500 550 600 650
PL Intensity (a.u)
Wavelength (nm)
wat-CQDs
300nm
355 nm
380 nm
400 nm
400 450 500 550 600 650
PL Intensity (a.u)
Wavelength (nm)
eth-CQDs
320nm
355 nm
380 nm
425 nm
400 450 500 550 600 650
PL Intensity (a.u)
Wavelength (nm)
tol-CQDs
300nm
320 nm
340 nm
360 nm
a) b) c)


![Ô nhiễm không khí từ nông nghiệp: Thách thức toàn cầu và định hướng hành động [Mới nhất]](https://cdn.tailieu.vn/images/document/thumbnail/2025/20250917/kimphuong1001/135x160/52891758099584.jpg)